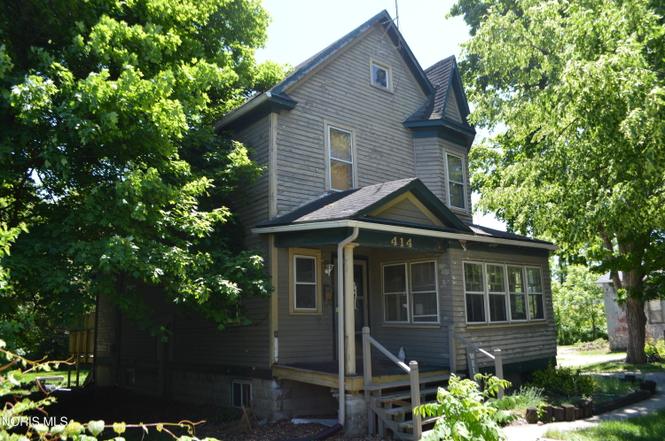
414 E High St · Hicksville, OH
Flood risk 1/10 · Minimal
- FEMA flood zone
- X (unshaded)
- Chance of flooding over 30 yrs
- 0.0%
- Est. flood insurance / yr
- $473 – $860
Fire risk 1/10 · Minimal
- Est. fire insurance / yr
- $713 – $1,323
Heat risk 3/10 · Minor
- Hot days now (above 100°F)
- 7 days/yr
- Hot days in 30 yrs
- 17 days/yr
Wind risk 2/10 · Minimal
- Chance of severe wind over 30 yrs
- —
Air-quality risk 2/10 · Minimal
- Unhealthy air days now
- 1 days/yr
- Unhealthy air days in 30 yrs
- 2 days/yr
Risk factors via First Street. Map © Google.
Why this score? — see what drove the B grade
The composite is a weighted blend of 9 inputs, each scored 0–100. Each bar is that input's sub-score; the figure is the points it added to the 100-point composite (weight × sub-score).
- Cash flow +30.0/30.0
- DSCR +10.0/10.0
- 1% rule +9.8/10.0
- ARV discount +7.5/15.0
- Schools +6.4/10.0
- Livability +3.7/5.0
- Rent growth +2.5/5.0
- Condition / age +2.5/5.0
- Appreciation +0.0/10.0
$79,900
🖨 Deal sheet (PDF) 📄 Offer letter ✓ Due diligence
Listing remarks MLS
This 3 BR, 1 ½ bath home has good potential for fixing up to live in or sell. Basement appears to be relatively dry and has high ceiling. Front of home has a porch that's part open & part enclosed. It offers a lg living room & dining room w/ gas log fireplace, lg deck & backyard that offers great area to relax or enjoy yard games & an area for gardening or to plant grass & expand the back yard.
Key facts
- 0.34 acre lot
- 3 parking spots
- Built 1911
Property features AI
Finance
- HOA & community: Sidewalks in the community
Exterior
- Parking: Parking for 3 vehicles; Circular driveway with gravel surface
- Utilities: Public water; Sanitary sewer; Electricity connected; Natural gas connected; Cable available; Internet available
- Home design: Single-family residence (house); Two levels (2 stories); No attached units or common walls; Living area reported from public records
- Construction: Wood siding exterior; Block foundation; Shingle roof; Built on two levels
- Exterior features: Deck; Front porch; Covered porch; State road frontage; Asphalt/paved road
Interior
- Kitchen: Kitchen on the main level; Breakfast room adjacent to kitchen
- Bedrooms: Bedroom 2 on the upper level; Bedroom 3 on the upper level
- Flooring: Wood flooring; Linoleum flooring
- Bathrooms: 1 full bathroom; 1 half bathroom (total 1.5 bathrooms)
- Heating & cooling: Forced air heating (natural gas); Window air conditioning units
- Interior features: Entrance foyer; One gas log fireplace; Basement (block foundation)
- Laundry & utility: Laundry in basement
Neighborhood map
What this means for you Summary
Snapshot
- This is a 3-bed/1.5-bath single-family listed at $80k.
Deal economics
- At list price, monthly cash flow is $381 ($5k/yr) — positive.
- The deal already cash-flows at list — no discount required.
- Meets the 1% rule at list price ($1k rent vs $80k).
- Cap rate 12.0% vs local median 4.5% in Hicksville — top-decile yield for the area; either an underpriced asset or a hidden risk that comps aren't pricing in. Stress-test before assuming the spread holds.
Location & tenants
- Location reads 73/100 on livability (#335 in OH) — a middle-class / working-renter tenant base. Strengths: crime A+, cost of living A+, housing A+; Watch: amenities F, commute F, health & safety F.
- Hicksville Exempted Village (rural): math 78% / reading 75% proficiency, ranked #91 of 656 in OH (top 14%) — strong family-tenant draw, lease renewals of 3-5y typical.
- Zoned schools: Hicksville Elementary School (math 76% / reading 73%, grade A, #272 of 1,584 statewide, top 19%, 360 students, 86% FRL); Hicksville Middle School (264 students, 0% FRL); Hicksville High School (math 80% / reading 78%, grade A-, #46 of 781 statewide, top 6%, 230 students, 0% FRL) — zoned schools average 29% FRL vs 44% district-wide (16 pts lower); this property's tenant base skews higher-income than the district average.
- Market conditions: 27 active listings in the ZIP; 41 units permitted in Defiance County in 2024 (0 in 5+ unit buildings).
Forward outlook
- Local home prices are declining (-3.0%/yr); year-one equity from $552 of loan paydown is wiped out by about $2k of value loss. Plan a longer hold.
- Defiance County population projected at -16% by 2050 — secular population decline; favor cash flow + early exit over multi-decade hold.
- At projected returns (-3.0% appreciation + 3.0% rent growth), your $22k cash investment doubles in ~6 years — after that, you're playing with house money.
Negotiation context
- Only 7 days on market — expect competitive offers; lowballing is unlikely to land.
- 5 sale attempts since 20y ago with the ask held roughly flat each time — persistent listings suggest the price (not the market) is what's stuck; bring a comps-based counter.
- Current owner paid $53k; list at $80k implies a 50% gain — meaningful room to come down on a strong offer.
Risks & watch-outs
- Watch-outs: built in 1911 — expect roof / HVAC / electrical / plumbing capex.
Questions for the listing agent
- Built in 1911 — when were the roof, HVAC, electrical panel, plumbing, and water heater last replaced?
- Is there a deadline driving the sale (1031 exchange, divorce, estate, relocation)? That informs how much negotiation room exists.
- Schools are A-rated — typically a magnet for longer-tenancy family renters. What's the average tenant stay here, and is there a school-zone premium baked into asking?
- What's the average days-on-market for RENTAL listings here right now (not sales)? A rising rental-DOM trend means longer vacancies and softer asking-rent achievability than the comps imply.
- What's the recent tenant-quality profile in this submarket — average credit score on applications, eviction rate, late-payment / NSF rate, and stable-employment percentage? A property-management company in the area should have these aggregated.
- How much new for-sale + rental construction is in the pipeline within 1–3 miles? Heavy new supply typically softens prices + rents 12–24 months out; constrained supply supports both.
Investment metrics
- 1% rule
- 1.48% ✓
- Cap rate
- 12.02%
- Cash-on-cash
- 20.45%
- DSCR
- 1.91
- GRM
- 5.6
CMA / ARV
- ARV (on-the-fly)
- $160,908
- Comps found
- 12
Show comp detail 12 sales within ~0.75 mi
| Address | Dist | Beds/Ba | Sqft | Sold | Price | $/sf | Match |
|---|---|---|---|---|---|---|---|
| 424 E High St | 0.02mi | 3/2.0 | 1,555 (+2%) | 7mo | $167,500 | $108 | 87 |
| 505 E Smith St | 0.14mi | 3/1.0 | 1,568 (+3%) | 7mo | $127,500 | $81 | 80 |
| 116 E Smith St | 0.29mi | 4/2.0 (+1) | 1,540 (+1%) | 1mo | $140,000 | $91 | 76 |
| 601 E Cornelia St | 0.23mi | 3/2.5 | 1,552 (+2%) | 9mo | $260,000 | $168 | 74 |
| 614 E Cornelia St | 0.20mi | 3/1.5 | 1,320 (-13%) | 6mo | $143,000 | $108 | 64 |
| 411 E High St | 0.03mi | 4/2.0 (+1) | 1,666 (+10%) | 14mo | $176,000 | $106 | 64 |
| 201 N Maple St | 0.27mi | 3/1.0 | 1,330 (-12%) | 2mo | $137,000 | $103 | 63 |
| 105 W Edgerton St | 0.41mi | 3/1.5 | 1,325 (-13%) | 2mo | $140,000 | $106 | 58 |
| 122 W Cornelia St | 0.53mi | 3/2.0 | 1,560 (+3%) | 15mo | $146,000 | $94 | 56 |
| 410 N Bryan St | 0.60mi | 3/2.0 | 1,392 (-8%) | 4mo | $197,000 | $142 | 53 |
| 908 E High St | 0.41mi | 2/1.5 (-1) | 1,380 (-9%) | 11mo | $155,000 | $112 | 52 |
| 202 Spencerville St | 0.69mi | 4/1.0 (+1) | 1,696 (+12%) | 8mo | $175,000 | $103 | 35 |
Match score weights: distance 35% · size 25% · config 20% · recency 20%. Top-matched comps best support the ARV.
Projected returns pro-forma
-3.0% appreciation · 3.0% rent growth · sell at horizon
- IRR
- 12.7%
- Equity multiple
- 1.51×
- Total profit
- $11,353
- Equity at exit
- $11,913
- IRR
- 21.7%
- Equity multiple
- 2.84×
- Total profit
- $41,231
- Equity at exit
- $6,908
Cash invested: $22,372 (down + closing). Projections, not guarantees.
Landlord ↔ Tenant lean methodology
- Overall (STATE)
- 73 Landlord-Friendly
- State Ohio
- 73 Landlord-Friendly · R+6
- County
- — inherits STATE
- City
- — inherits STATE
ZIP-level market 43526
- Home prices YoY
- -13.9%
- Active inventory
- 27
- Price-to-rent
- 5.6×
Monthly cashflow live
- Estimated rent
- $1,184 medium interval (Pro) →
- Mortgage (P&I)
- −$419
- Tax from tax record
- −$102 /mo · $1,226/yr
- Insurance
- −$33
- HOA
- −$0
- Vacancy / Maint / Mgmt
- −$249
- Net cashflow
- $381
Break-even live
Sensitivity live
| Price | -10% $426 | -5% $404 | +0% $381 | +5% $359 | +10% $336 |
|---|---|---|---|---|---|
| Rent | -10% $288 | -5% $334 | +0% $381 | +5% $428 | +10% $475 |
| Rate | -1.0pp $421 | -0.5pp $402 | base $381 | +0.5pp $361 | +1.0pp $339 |
UW: 25.0% down · 7.5% · 30yr · 1.5% tax · 5.0% vac · 8.0% maint · 8.0% mgmt
Financing live
Cash to close
- Down payment
- $19,975
- Closing costs
- $2,397
- Reserves months
- —
- Total cash needed
- —
Loan-product check · same deal, 3 products live
Conventional
25% down · 7.5% · 30yr
- Down + closing
- —
- Monthly P&I
- —
- Monthly cashflow
- —
- DSCR
- —
- Eligible?
- —
Personal DTI + credit; lowest rate.
DSCR
20% down · 8.5% · 30yr
- Down + closing
- —
- Monthly P&I
- —
- Monthly cashflow
- —
- DSCR
- —
- Eligible?
- —
No personal income docs; deal must DSCR.
Hard money
10% down · 12.0% · 12mo
- Down + closing
- —
- Monthly P&I
- —
- Monthly cashflow
- —
- DSCR
- —
- Eligible?
- —
Short-term bridge; refi at stabilization.
Listing history 7 events
-
2026-06-22days on market $79,900 Active 7 DOM
-
2026-06-21days on market $79,900 Active 6 DOM
-
2026-06-21days on market $79,900 Active 5 DOM
-
2026-06-18days on market $79,900 Active 3 DOM
-
2026-06-17days on market $79,900 Active 2 DOM
-
2026-06-16remarks 129-char remark
-
2026-06-16$79,900 Active 1 DOM
ⓘ Source: listings_history table (triggers on properties + properties_extension) + one-shot
backfill from property_details.listing_events for pre-trigger history.
Tax reassessment forecast OH · Partial reset (capped growth)
- Current annual tax
- $1,226 · $102/mo
- Projected year-2 tax
- $1,236 · $103/mo
- Expected delta
- +$10/yr (+$1/mo · 0.8%)
ⓘ Screening estimate from a state-policy table — verify with the county assessor before closing.
Climate risk First Street
- Flood 1/10 Low FEMA zone X (unshaded) · 0% chance over 30 yrs
- Wildfire 1/10 Low
- Heat 3/10 Moderate 7 d/yr ≥100°F today · 17 d/yr by 30 yrs out
- Wind 2/10 Low
- Air quality 2/10 Low 1 unhealthy d/yr today · 2 by 30 yrs out
Nearby sold comps map
Loading sold comps map…
Walkable amenities ~0.75 mi
Loading nearby amenities…
Taxation est. · year 1
- Rental income
- $14,213
- − Mortgage interest
- −$4,476
- − Property taxes
- −$1,226
- − Insurance
- −$400
- − Repairs & maintenance
- −$1,137
- − Management
- −$1,137
- − Depreciation
- −$2,324
- Taxable income
- $3,514
- Est. tax owed @ 24.0%
- −$843
- After-tax cash flow
- $3,732/yr
For passive investors: Depreciation is non-cash, so a rental often shows a tax loss while cash-flowing — sheltering income. Rental losses are passive: they offset passive income freely, and up to $25,000/yr can offset ordinary (W-2) income if you actively participate and your MAGI is under $100k (phasing out to $0 by $150k); unused losses carry forward. On sale, claimed depreciation is recaptured at up to 25%, and gains may owe capital-gains tax (a 1031 exchange can defer both). Figures are a year-1 estimate at your 24.0% rate — not tax advice; consult a CPA.
Schools (NCES district)
- District
- Hicksville Exempted Village
- NCES district ID
- 3904541
- Math proficiency
- 78% ▼ -7.00%
- Reading proficiency
- 75% ▼ -11.00%
- Median HH income
- $45,008
- Composite
- 64.3/100
- National rank
- #558
- State rank
- #91 of 656 in OH
Livability — Hicksville
- Score
- 73/100
- State rank
- #335
- US rank
- #5490
Category grades
Schools grade is shown separately in the Schools card above.
Census & demographics
- Census place
- Hicksville, OH
- County
- Defiance · 37,898 people
- Population (ZIP)
- 6,270
- Household income
- $66,688
- Rent vs Own
- Severe rent burden
- 9.4
Population outlook (Defiance County) Hauer SSP2
- Today (2025)
- 37,051 people
- By 2030
- 36,013 · -2.8%
- By 2040
- 33,583 · -9.4%
- By 2050
- 31,309 · -15.5%
- By 2075
- 26,980 · -27.2%
- By 2100
- 23,416 · -36.8%
Race, ethnicity, and origin ACS 2023
- Neighborhood character
- Predominantly White (88%)
- Race & ethnicity
- White 88% Hispanic / Latino 7% Two or more races 5%
- Hispanic origin (detail)
- Mexican 5%
- Common ancestry
- Iranian 4% Lithuanian 3% Romanian 1%
- Foreign-born
- 4% · Canada
- Languages at home
- 88% English-only · German/W. Germanic 7% Spanish 5%
Political lean MEDSL · Defiance
- 2024 margin
- Solid R (+39.9) · D 29.6% · R 69.5%
- 2008→2024 swing
- -29.4pp toward R · 2008: -10.5pp · 2024: -39.9pp
- All cycles
- 2024: R+39.9 2020: R+36.4 2016: R+34.8 2012: R+14.1 2008: R+10.5
Not yet ingested
- Civics
- —
Market trends
- HPI YoY
- ▼ -36.40%
- Current HPI
- 224.9764
- Rent YoY
- —
- Metro
- —
- State GDP YoY
- ▲ 1.98%
- F500 in state
- 48
Industry mix (Fortune 500 HQ in OH)
| Industry | F500 HQs | Revenue |
|---|---|---|
| Insurance | 3 | $145B |
|
||
| Industrial Machinery | 3 | $49B |
|
||
| Financial Services | 3 | $24B |
|
||
| Consumer Goods | 2 | $93B |
|
||
| Aerospace / Defense | 2 | $47B |
|
||
| Utilities | 2 | $33B |
|
||
Price history
-6.5% since first listed11 events — show timeline
- 2026-06-15 Listed $79,900 NORIS
- 2019-10-08 Sold (Public Records) $53,100 Public Records
- 2019-10-07 Sold (MLS) $53,085 NORIS
- 2019-09-30 Price Changed $53,085 NORIS
- 2019-07-22 Listed $49,900 NORIS
- 2012-01-04 Listing Removed — NORIS
- 2011-09-07 Listed $49,900 NORIS
- 2007-12-31 Listing Removed — NORIS
- 2007-05-24 Listed $85,500 NORIS
- 2007-01-17 Listing Removed — NORIS
- 2006-07-28 Listed $85,500 NORIS
Property tax history
+3.4%/yrLatest (2025): $1,226 · +1.2% YoY. Source: county tax records.
Cash-flow waterfall
monthlySold comps — $/sqft
last 12 mo · ≤1 miLoading sold comps…