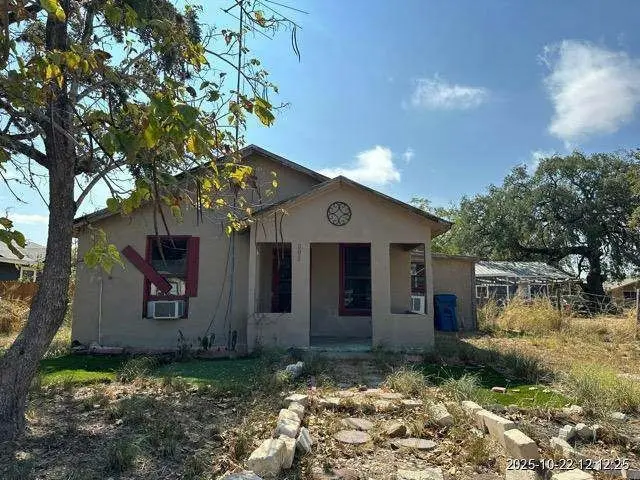
808 Bowen St · Pleasanton, TX
Flood risk 3/10 · Minor
- FEMA flood zone
- X (unshaded)
- Chance of flooding over 30 yrs
- 0.1%
- Est. flood insurance / yr
- $507 – $1,088
Fire risk 5/10 · Moderate
- Est. fire insurance / yr
- $1,222 – $2,270
Heat risk 8/10 · Major
- Hot days now (above 111°F)
- 7 days/yr
- Hot days in 30 yrs
- 21 days/yr
Wind risk 8/10 · Major
- Chance of severe wind over 30 yrs
- 80.0%
Air-quality risk 1/10 · Minimal
- Unhealthy air days now
- 0 days/yr
- Unhealthy air days in 30 yrs
- 0 days/yr
Risk factors via First Street. Map © Google.
Why this score? — see what drove the C+ grade
The composite is a weighted blend of 9 inputs, each scored 0–100. Each bar is that input's sub-score; the figure is the points it added to the 100-point composite (weight × sub-score).
- Cash flow +28.3/30.0
- DSCR +10.0/10.0
- ARV discount +7.5/15.0
- 1% rule +7.2/10.0
- Schools +3.2/10.0
- Livability +3.2/5.0
- Rent growth +2.5/5.0
- Condition / age +2.5/5.0
- Appreciation +0.0/10.0
$89,999
🖨 Deal sheet 📄 Offer letter ✓ Due diligence
Listing remarks
WE JUST LISTED this unique home in Pleasanton, Texas! It needs some work but has a lot of potential. It is located on a large approximately 7,300 square foot lot. Ready for your renovations this home offers the opportunity for you to customize and repair the home to your liking! Since it is located within the city limits, you'll have access to all daily amenities like local shops and restaurants. WE MAKE IT EASY TO OWN. This is a great opportunity! Don't wait, call us today to get information on the owner's easy terms and smooth process that may be able to put the deed in your name and make this your dream home. When you call be sure and ask about the other properties that we may have in th
Key facts
- Access to amenities
- Large lot
- 7,400 sq ft lot
Tags
Property features AI
Finance
- Financial info: Lease not considered
Exterior
- Home design: Residential property; Built in 1960
- Construction: Living area approximately 869; Year built 1960
- Exterior features: Lot approximately 7,401 sq ft (0.1699 acre); Lot described as Other
Interior
- Bedrooms: Primary bedroom on the first floor (approx. 12 x 14); Second bedroom on the first floor (approx. 11 x 13)
- Bathrooms: 1 full bathroom
- Interior features: Two total rooms
Neighborhood map
What this means for you Summary
Snapshot
- This is a 2-bed/1.0-bath single-family listed at $90k.
Deal economics
- At list price, monthly cash flow is $289 ($3k/yr) — positive.
- The deal already cash-flows at list — no discount required.
- Meets the 1% rule at list price ($1k rent vs $90k).
- Cap rate 10.1% vs local median 3.3% in Pleasanton — top-decile yield for the area; either an underpriced asset or a hidden risk that comps aren't pricing in. Stress-test before assuming the spread holds.
Location & tenants
- Location reads 65/100 on livability (#679 in TX) — a middle-class / working-renter tenant base. Strengths: cost of living A+, housing A+, employment B; Watch: amenities F, commute F, health & safety F.
- Pleasanton ISD (town): math 36% / reading 37% proficiency, ranked #470 of 826 in TX (top 57%) — families likely to look elsewhere, expect single-tenant / working-renter base with shorter leases.
- Zoned schools: Pleasanton El (math 35% / reading 35%, grade F, #1,965 of 4,322 statewide, top 46%, 958 students, 70% FRL); Pleasanton J H (math 30% / reading 34%, grade F, #971 of 1,662 statewide, top 60%, 772 students, 66% FRL); Pleasanton H S (math 59% / reading 51%, grade C, #373 of 1,632 statewide, top 23%, 944 students, 60% FRL).
- Market conditions: 233 active listings in the ZIP; 9 comparable units currently listed for rent nearby; rentals lingering (median 44d on market — plan ~5-8 weeks vacancy on turnover, expect pricing pressure); 56% of comp listings sitting > 30 days — soft ceiling on asking rent; 224 units permitted in Atascosa County in 2024 (0 in 5+ unit buildings).
Forward outlook
- Local home prices are declining (-3.0%/yr); year-one equity from $622 of loan paydown is wiped out by about $3k of value loss. Plan a longer hold.
- Atascosa County population projected at +41% by 2050 — long-run rental-demand tailwind backs the buy-and-hold thesis.
- At projected returns (-3.0% appreciation + 3.0% rent growth), your $25k cash investment doubles in ~9 years — after that, you're playing with house money.
Negotiation context
- Only 8 days on market — expect competitive offers; lowballing is unlikely to land.
Risks & watch-outs
- Climate carrying-cost: severe wind risk, 80% chance of damaging wind over 30y; moderate wildfire risk; extreme-heat days projected 7→21/yr by 2055 (HVAC capex compounding) — expect insurance premiums to compound above CPI over the hold.
Questions for the listing agent
- Built in 1960 — when were the roof, HVAC, electrical panel, plumbing, and water heater last replaced?
- Is there a deadline driving the sale (1031 exchange, divorce, estate, relocation)? That informs how much negotiation room exists.
- What's the average days-on-market for RENTAL listings here right now (not sales)? A rising rental-DOM trend means longer vacancies and softer asking-rent achievability than the comps imply.
- What's the recent tenant-quality profile in this submarket — average credit score on applications, eviction rate, late-payment / NSF rate, and stable-employment percentage? A property-management company in the area should have these aggregated.
- How much new for-sale + rental construction is in the pipeline within 1–3 miles? Heavy new supply typically softens prices + rents 12–24 months out; constrained supply supports both.
Investment metrics
- 1% rule
- 1.22% ✓
- Cap rate
- 10.15%
- Cash-on-cash
- 13.77%
- DSCR
- 1.61
- GRM
- 6.8
CMA / ARV
- ARV (on-the-fly)
- $192,049
- Comps found
- 2
Show comp detail 2 sales within ~0.75 mi
| Address | Dist | Beds/Ba | Sqft | Sold | Price | $/sf | Match |
|---|---|---|---|---|---|---|---|
| 727 Austin | 0.44mi | 2/1.0 | 810 (-7%) | 8mo | $70,000 | $86 | 62 |
| 408 San Antonio | 0.54mi | 1/1.0 (-1) | 768 (-12%) | 14mo | $169,999 | $221 | 39 |
Match score weights: distance 35% · size 25% · config 20% · recency 20%. Top-matched comps best support the ARV.
Projected returns pro-forma
-3.0% appreciation · 3.0% rent growth · sell at horizon
- IRR
- 3.9%
- Equity multiple
- 1.15×
- Total profit
- $3,825
- Equity at exit
- $13,419
- IRR
- 13.4%
- Equity multiple
- 2.07×
- Total profit
- $27,006
- Equity at exit
- $7,781
Cash invested: $25,200 (down + closing). Projections, not guarantees.
Landlord ↔ Tenant lean methodology
- Overall (STATE)
- 87 Strongly Landlord-Friendly
- State Texas
- 87 Strongly Landlord-Friendly · R+5
- County
- — inherits STATE
- City
- — inherits STATE
ZIP-level market 78064
- Home prices YoY
- -32.7%
- Active inventory
- 233
- Price-to-rent
- 6.8×
Monthly cashflow live
- Estimated rent
- $1,098 high interval (Pro) →
- Mortgage (P&I)
- −$472
- Tax from tax record
- −$69 /mo · $827/yr
- Insurance
- −$37
- HOA
- −$0
- Vacancy / Maint / Mgmt
- −$231
- Net cashflow
- $289
Break-even live
UW: 25.0% down · 7.5% · 30yr · 1.5% tax · 5.0% vac · 8.0% maint · 8.0% mgmt
Financing live
Cash to close
- Down payment
- $22,500
- Closing costs
- $2,700
- Reserves months
- —
- Total cash needed
- —
Loan-product check · same deal, 3 products live
Conventional
25% down · 7.5% · 30yr
- Down + closing
- —
- Monthly P&I
- —
- Monthly cashflow
- —
- DSCR
- —
- Eligible?
- —
Personal DTI + credit; lowest rate.
DSCR
20% down · 8.5% · 30yr
- Down + closing
- —
- Monthly P&I
- —
- Monthly cashflow
- —
- DSCR
- —
- Eligible?
- —
No personal income docs; deal must DSCR.
Hard money
10% down · 12.0% · 12mo
- Down + closing
- —
- Monthly P&I
- —
- Monthly cashflow
- —
- DSCR
- —
- Eligible?
- —
Short-term bridge; refi at stabilization.
Rent comps 9 comps
| Address | Beds | Baths | Sqft | Rent | $/sqft | DOM | Units | Dist |
|---|---|---|---|---|---|---|---|---|
| 1101 4th St Pleasanton, TX | 2.0 | 2.0 | 1077 | $1,125 | $1.04 | 43d | 1 | 0.17mi |
| 613 Market St Pleasanton, TX | 2.0 | 2.0 | 1077 | $1,200 | $1.11 | 43d | 1 | 0.29mi |
| 737 Commerce St Unit 2A Pleasanton, TX | 1.0 | 1.0 | 675 | $965 | $1.43 | 23d | 1 | 0.29mi |
| 723 Dallas St Pleasanton, TX | 2.0 | 2.0 | 966 | $1,200 | $1.24 | 23d | 1 | 0.50mi |
| 701 Dallas St Pleasanton, TX | 2.0 | 2.0 | 966 | $1,200 | $1.24 | 43d | 1 | 0.51mi |
| 541 Dallas St Unit B Pleasanton, TX | 3.0 | 1.5 | 1080 | $1,000 | $0.93 | 23d | 1 | 0.54mi |
| 176 W White St Pleasanton, TX | 2.0 | 2.0 | 1120 | $1,100 | $0.98 | 43d | 1 | 0.97mi |
| 414 W Johnson St Pleasanton, TX | 2.0 | 1.0 | 792 | $800 | $1.01 | 4d | 1 | 1.01mi |
| 132 S Mansfield St Unit A Pleasanton, TX | 2.0 | 1.0 | 910 | $1,100 | $1.21 | 43d | 1 | 1.20mi |
Listing history 6 events
-
2026-06-18days on market $89,999 Active 8 DOM
-
2026-06-17days on market $89,999 Active 7 DOM
-
2026-06-16days on market $89,999 Active 6 DOM
-
2026-06-15days on market $89,999 Active 5 DOM
-
2026-06-13remarks 699-char remark
-
2026-06-13$89,999 Active 3 DOM
ⓘ Source: listings_history table (triggers on properties + properties_extension) + one-shot
backfill from property_details.listing_events for pre-trigger history.
Tax reassessment forecast TX · Resets to sale price
- Current annual tax
- $827 · $69/mo
- Projected year-2 tax
- $1,647 · $137/mo
- Expected delta
- +$820/yr (+$68/mo · 99.1%)
ⓘ Screening estimate from a state-policy table — verify with the county assessor before closing.
Climate risk First Street
- Flood 3/10 Moderate FEMA zone X (unshaded) · 10% chance over 30 yrs
- Wildfire 5/10 Major
- Heat 8/10 Severe 7 d/yr ≥111°F today · 21 d/yr by 30 yrs out
- Wind 8/10 Severe 80% chance of damaging wind over 30 yrs
- Air quality 1/10 Low 0 unhealthy d/yr today · 0 by 30 yrs out
Nearby sold comps map
Loading sold comps map…
Walkable amenities ~0.75 mi
Loading nearby amenities…
Taxation est. · year 1
- Rental income
- $13,179
- − Mortgage interest
- −$5,041
- − Property taxes
- −$827
- − Insurance
- −$450
- − Repairs & maintenance
- −$1,054
- − Management
- −$1,054
- − Depreciation
- −$2,618
- Taxable income
- $2,133
- Est. tax owed @ 24.0%
- −$512
- After-tax cash flow
- $2,958/yr
For passive investors: Depreciation is non-cash, so a rental often shows a tax loss while cash-flowing — sheltering income. Rental losses are passive: they offset passive income freely, and up to $25,000/yr can offset ordinary (W-2) income if you actively participate and your MAGI is under $100k (phasing out to $0 by $150k); unused losses carry forward. On sale, claimed depreciation is recaptured at up to 25%, and gains may owe capital-gains tax (a 1031 exchange can defer both). Figures are a year-1 estimate at your 24.0% rate — not tax advice; consult a CPA.
Schools (NCES district)
- District
- Pleasanton ISD
- NCES district ID
- 4835190
- Math proficiency
- 36% ▼ -2.00%
- Reading proficiency
- 37% ▲ 4.00%
- Median HH income
- $53,885
- Composite
- 31.97/100
- National rank
- #5843
- State rank
- #470 of 826 in TX
Livability — Pleasanton
- Score
- 65/100
- State rank
- #679
- US rank
- #12731
Category grades
Schools grade is shown separately in the Schools card above.
Census & demographics
- Census place
- Pleasanton, TX
- Population (ZIP)
- 16,420
Population outlook (Atascosa County) Hauer SSP2
- Today (2025)
- 57,233 people
- By 2030
- 61,729 · +7.9%
- By 2040
- 71,122 · +24.3%
- By 2050
- 80,906 · +41.4%
- By 2075
- 106,134 · +85.4%
- By 2100
- 122,415 · +113.9%
Race, ethnicity, and origin ACS 2023
- Neighborhood character
- Majority Hispanic (55%)
- Race & ethnicity
- Hispanic / Latino 55% White 41% Two or more races 27% Black 2%
- Hispanic origin (detail)
- Mexican 49%
- Common ancestry
- Romanian 2% Lithuanian 2% Portuguese 1%
- Foreign-born
- 7% · Canada
- Languages at home
- 67% English-only · Spanish 32% Other Indo-European 1% German/W. Germanic 1%
Political lean MEDSL · Atascosa
- 2024 margin
- Solid R (+43.3) · D 27.9% · R 71.3%
- 2008→2024 swing
- -32.8pp toward R · 2008: -10.5pp · 2024: -43.3pp
- All cycles
- 2024: R+43.3 2020: R+34.0 2016: R+29.1 2012: R+18.3 2008: R+10.5
Not yet ingested
- Civics
- —
Market trends
- HPI YoY
- ▼ -91.53%
- Current HPI
- 188.725
- Rent YoY
- —
- Metro
- —
- State GDP YoY
- ▲ 3.95%
- F500 in state
- 110
Industry mix (Fortune 500 HQ in TX)
| Industry | F500 HQs | Revenue |
|---|---|---|
| Energy | 16 | $1,198B |
|
||
| Technology | 5 | $198B |
|
||
| Engineering / Construction | 4 | $72B |
|
||
| Energy Services | 3 | $60B |
|
||
| Utilities | 3 | $41B |
|
||
| Healthcare | 2 | $330B |
|
||
Price history
1 event — show timeline
- 2026-06-10 Listed $89,999 HARMLS
Property tax history
+1.0%/yrLatest (2025): $827 · +1.6% YoY. Source: county tax records.
Cash-flow waterfall
monthlySold comps — $/sqft
last 12 mo · ≤1 miLoading sold comps…