 6-Plex
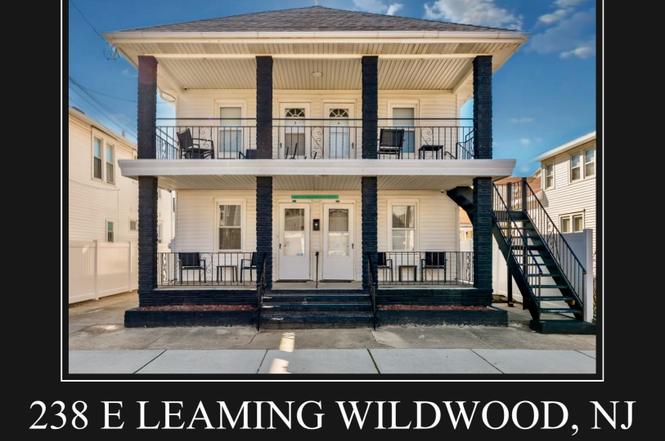
238 E Leaming Ave · Wildwood, NJ
Flood risk 9/10 · Severe
- FEMA flood zone
- AE
- Chance of flooding over 30 yrs
- 0.99%
- Est. flood insurance / yr
- $1,737 – $8,500
Fire risk 1/10 · Minimal
- Est. fire insurance / yr
- $526 – $976
Heat risk 8/10 · Major
- Hot days now (above 95°F)
- 7 days/yr
- Hot days in 30 yrs
- 19 days/yr
Wind risk 8/10 · Major
- Chance of severe wind over 30 yrs
- 80.0%
Air-quality risk 2/10 · Minimal
- Unhealthy air days now
- 1 days/yr
- Unhealthy air days in 30 yrs
- 1 days/yr
Risk factors via First Street. Map © Google.
Why this score? — see what drove the C+ grade
The composite is a weighted blend of 9 inputs, each scored 0–100. Each bar is that input's sub-score; the figure is the points it added to the 100-point composite (weight × sub-score).
- Cash flow +28.8/30.0
- DSCR +10.0/10.0
- ARV discount +7.5/15.0
- 1% rule +7.4/10.0
- Livability +3.7/5.0
- Rent growth +2.5/5.0
- Condition / age +2.5/5.0
- Schools +1.6/10.0
- Appreciation +0.0/10.0
$1,097,777
🖨 Deal sheet 📄 Offer letter ✓ Due diligence
Multi-family units
County records classify this as Multi-Family (5+ Unit). Listing-text estimate: 6 units. confirmed
5+ unit building — per-unit beds/baths from public records are typically unavailable; the breakdown below (if shown) is an estimate from the listing text.
Listing remarks MLS
Amazing Location just a couple blocks to the World Famous Wildwood Beaches, Boardwalk just a few Blocks to Wildwood Crest. There are 2 Buildings that Make up this 6 Unit Complex. The Front Building is 4 Units with 2 on the Upper floor that enjoy Ocean Views and 2 on the First Floor. The apartments are bright and airy. Each feature 2 bedrooms tastefully decorated and are being sold fully furnished as seen. This home has its own private patio area and may also take advantage of the common picnic area between the 2 houses. There is Luxury vinyl plank flooring for convenient cleanup and to protect against sand and water brought back from the beach andoutdoor shower. This property is heated for year round usage and makes a great investment property or 2nd home. Also conveniently located near the convention center, you may take advantage of all of the events in the shoulder seasons as well that are put on at that venue. The Owners have all of the Condo Docs, Surveys and exemptions needed should you decide to convert these to condominiums. The owners were going to sell individually and have been working on the units. Last year the property grossed $133,000 with very little effort or Marketing. The $25,000/unit should be easily attained and should the properties be pushed a bit more and rented over the fall and winter, you could expect another 10k/unit
Key facts
- Common picnic area
- Private patio area
- Outdoor shower
Tags
Neighborhood map
What this means for you Summary
Snapshot
- This is a 6 × 2-bed/1.0-bath units multifamily listed at $1.10M.
Deal economics
- At list price, monthly cash flow is $3k ($39k/yr) — positive. Per door: $546/mo.
- The deal already cash-flows at list — no discount required.
- Meets the 1% rule at list price ($14k rent vs $1.10M).
- Recommended offer: $1.06M (3.0% below list) — sets the bar for market timing.
- Cap rate 10.3% vs local median 5.6% in Wildwood — top-decile yield for the area; either an underpriced asset or a hidden risk that comps aren't pricing in. Stress-test before assuming the spread holds.
Location & tenants
- Location reads 74/100 on livability (#176 in NJ, #4,679 nationally) — a middle-class / working-renter tenant base. Strengths: amenities A+, commute A+, health & safety A+; Watch: employment D, schools F, crime F.
- Wildwood City School District (suburban): math 12% / reading 27% proficiency, ranked #442 of 472 in NJ (top 94%) — low school quality limits family demand, transient renter base, plan for 1-2y turnover; 80% free/reduced lunch — lower-income household profile, screen leases tightly.
- Market conditions: 431 active listings in the ZIP; 877 units permitted in Cape May County in 2024 (35 in 5+ unit buildings).
Forward outlook
- Local home prices are declining (-3.0%/yr); year-one equity from $8k of loan paydown is wiped out by about $33k of value loss. Plan a longer hold.
- Cape May County population projected at -24% by 2050 — secular population decline; favor cash flow + early exit over multi-decade hold.
- At projected returns (-3.0% appreciation + 3.0% rent growth), your $307k cash investment doubles in ~9 years — after that, you're playing with house money.
Negotiation context
- It's been on market 33 days — a 3% lower offer ($1.06M) is reasonable based on typical stale-listing flexibility.
- 4 sale attempts since 11y ago with the ask held roughly flat each time — persistent listings suggest the price (not the market) is what's stuck; bring a comps-based counter.
- Current owner paid $535k; list at $1.10M implies a 105% gain — meaningful room to come down on a strong offer.
Risks & watch-outs
- Watch-outs: flood insurance adds $427/mo; built in 1920 — expect roof / HVAC / electrical / plumbing capex.
- Climate carrying-cost: in FEMA flood zone AE (mandatory federal flood insurance); severe wind risk, 80% chance of damaging wind over 30y; extreme-heat days projected 7→19/yr by 2055 (HVAC capex compounding) — expect insurance premiums to compound above CPI over the hold.
Questions for the listing agent
- It's been on market 33 days. Have you received any prior offers? Is the seller open to a 3% concession, seller financing, or rate buy-down credit?
- Can we see the unit-by-unit rent roll, current vacancy, and any below-market leases? What's the average tenancy length?
- What capital expenditures (roof, boiler, parking lot, exteriors) have been made in the last 5 years, and what's planned in the next 2?
- Built in 1920 — when were the roof, HVAC, electrical panel, plumbing, and water heater last replaced?
- What's the actual annual flood-insurance premium (NFIP or private), and is the property in a SFHA with mandatory coverage?
- Is there a deadline driving the sale (1031 exchange, divorce, estate, relocation)? That informs how much negotiation room exists.
- Schools are F-rated, which usually means shorter tenancies and higher turnover. Who's the typical renter profile here, and what's been the actual vacancy rate?
- Crime grade is F in this area — have there been break-ins, vandalism, or insurance claims at this property in the last 3 years? What carrier currently insures it and at what premium?
- What's the average days-on-market for RENTAL listings here right now (not sales)? A rising rental-DOM trend means longer vacancies and softer asking-rent achievability than the comps imply.
- What's the recent tenant-quality profile in this submarket — average credit score on applications, eviction rate, late-payment / NSF rate, and stable-employment percentage? A property-management company in the area should have these aggregated.
- How much new apartment / multifamily construction is in the pipeline within 1–3 miles? Heavy new supply (>2% of stock underway) typically softens rents 12–24 months out; light construction supports rent growth.
Investment metrics
- 1% rule
- 1.24% ✓
- Cap rate
- 10.34%
- Cash-on-cash
- 14.46%
- DSCR
- 1.64
- GRM
- 6.7
CMA / ARV
No comps found within radius.
Projected returns pro-forma
-3.0% appreciation · 3.0% rent growth · sell at horizon
- IRR
- 2.6%
- Equity multiple
- 1.10×
- Total profit
- $31,032
- Equity at exit
- $163,682
- IRR
- 12.2%
- Equity multiple
- 1.96×
- Total profit
- $296,429
- Equity at exit
- $94,916
Cash invested: $307,378 (down + closing). Projections, not guarantees.
Landlord ↔ Tenant lean methodology
- Overall (STATE)
- 21 Tenant-Leaning
- State New Jersey
- 21 Tenant-Leaning · D+6
- County
- — inherits STATE
- City
- — inherits STATE
ZIP-level market 08260
- Home prices YoY
- -30.7%
- Active inventory
- 431
- Price-to-rent
- 40.3×
Monthly cashflow live
- Estimated rent
- $13,619 medium interval (Pro) →
- Mortgage (P&I)
- −$5,757
- Tax from tax record
- −$840 /mo · $10,082/yr
- Insurance
- −$457
- Flood insurance flood zone
- −$427 /mo · $5,118/yr
- HOA
- −$0
- Vacancy / Maint / Mgmt
- −$2,860
- Net cashflow
- $3,278
Break-even live
6-unit breakdown (identical units grouped — click to expand)
| Units | Beds | Baths | Est. rent |
|---|---|---|---|
| 6× units | 2 | 1 | $13,620 |
| #1 | 2 | 1 | $2,270 |
| #2 | 2 | 1 | $2,270 |
| #3 | 2 | 1 | $2,270 |
| #4 | 2 | 1 | $2,270 |
| #5 | 2 | 1 | $2,270 |
| #6 | 2 | 1 | $2,270 |
| Total (6 units) | $13,619 | ||
UW: 25.0% down · 7.5% · 30yr · 1.5% tax · 5.0% vac · 8.0% maint · 8.0% mgmt
Financing live
Cash to close
- Down payment
- $274,444
- Closing costs
- $32,933
- Reserves months
- —
- Total cash needed
- —
Loan-product check · same deal, 3 products live
Conventional
25% down · 7.5% · 30yr
- Down + closing
- —
- Monthly P&I
- —
- Monthly cashflow
- —
- DSCR
- —
- Eligible?
- —
Personal DTI + credit; lowest rate.
DSCR
20% down · 8.5% · 30yr
- Down + closing
- —
- Monthly P&I
- —
- Monthly cashflow
- —
- DSCR
- —
- Eligible?
- —
No personal income docs; deal must DSCR.
Hard money
10% down · 12.0% · 12mo
- Down + closing
- —
- Monthly P&I
- —
- Monthly cashflow
- —
- DSCR
- —
- Eligible?
- —
Short-term bridge; refi at stabilization.
Listing history 16 events
-
2026-03-06status Under Contract
-
2026-01-31$1,097,777 Active
-
2026-01-01historical Expired 1367-char remark
Show marketing remark (1367 chars)
Amazing Location just a couple blocks to the World Famous Wildwood Beaches, Boardwalk just a few Blocks to Wildwood Crest. There are 2 Buildings that Make up this 6 Unit Complex. The Front Building is 4 Units with 2 on the Upper floor that enjoy Ocean Views and 2 on the First Floor. The apartments are bright and airy. Each feature 2 bedrooms tastefully decorated and are being sold fully furnished as seen. This home has its own private patio area and may also take advantage of the common picnic area between the 2 houses. There is Luxury vinyl plank flooring for convenient cleanup and to protect against sand and water brought back from the beach andoutdoor shower. This property is heated for year round usage and makes a great investment property or 2nd home. Also conveniently located near the convention center, you may take advantage of all of the events in the shoulder seasons as well that are put on at that venue. The Owners have all of the Condo Docs, Surveys and exemptions needed should you decide to convert these to condominiums. The owners were going to sell individually and have been working on the units. Last year the property grossed $133,000 with very little effort or Marketing. The $25,000/unit should be easily attained and should the properties be pushed a bit more and rented over the fall and winter, you could expect another 10k/unit
-
2025-07-08$1,197,777 Active 1367-char remark
Show marketing remark (1367 chars)
Amazing Location just a couple blocks to the World Famous Wildwood Beaches, Boardwalk just a few Blocks to Wildwood Crest. There are 2 Buildings that Make up this 6 Unit Complex. The Front Building is 4 Units with 2 on the Upper floor that enjoy Ocean Views and 2 on the First Floor. The apartments are bright and airy. Each feature 2 bedrooms tastefully decorated and are being sold fully furnished as seen. This home has its own private patio area and may also take advantage of the common picnic area between the 2 houses. There is Luxury vinyl plank flooring for convenient cleanup and to protect against sand and water brought back from the beach andoutdoor shower. This property is heated for year round usage and makes a great investment property or 2nd home. Also conveniently located near the convention center, you may take advantage of all of the events in the shoulder seasons as well that are put on at that venue. The Owners have all of the Condo Docs, Surveys and exemptions needed should you decide to convert these to condominiums. The owners were going to sell individually and have been working on the units. Last year the property grossed $133,000 with very little effort or Marketing. The $25,000/unit should be easily attained and should the properties be pushed a bit more and rented over the fall and winter, you could expect another 10k/unit
-
2022-02-01soldstatus $535,000
-
2021-07-07price $599,777
-
2021-06-19price $624,777
-
2021-04-29soldstatus $449,888
-
2021-04-16soldstatus $449,888 Sold
-
2021-03-14historical Under Contract
-
2021-03-02$435,000 Active
-
2015-06-24soldstatus $275,000
-
2015-06-06soldstatus $275,000 Sold Coop by Member
-
2015-05-30historical
-
2015-04-27$300,000 Active
-
1983-01-10soldstatus $110,000
ⓘ Source: listings_history table (triggers on properties + properties_extension) + one-shot
backfill from property_details.listing_events for pre-trigger history.
Tax reassessment forecast NJ · Partial reset (capped growth)
- Current annual tax
- $10,082 · $840/mo
- Projected year-2 tax
- $18,708 · $1,559/mo
- Expected delta
- +$8,626/yr (+$719/mo · 85.6%)
ⓘ Screening estimate from a state-policy table — verify with the county assessor before closing.
Climate risk First Street
- Flood 9/10 Extreme FEMA zone AE · 99% chance over 30 yrs
- Wildfire 1/10 Low
- Heat 8/10 Severe 7 d/yr ≥95°F today · 19 d/yr by 30 yrs out
- Wind 8/10 Severe 80% chance of damaging wind over 30 yrs
- Air quality 2/10 Low 1 unhealthy d/yr today · 1 by 30 yrs out
Nearby sold comps map
Loading sold comps map…
Walkable amenities ~0.75 mi
Loading nearby amenities…
Taxation est. · year 1
- Rental income
- $163,428
- − Mortgage interest
- −$61,493
- − Property taxes
- −$10,082
- − Insurance
- −$10,607
- − Repairs & maintenance
- −$13,074
- − Management
- −$13,074
- − Depreciation
- −$31,935
- Taxable income
- $23,162
- Est. tax owed @ 24.0%
- −$5,559
- After-tax cash flow
- $33,777/yr
For passive investors: Depreciation is non-cash, so a rental often shows a tax loss while cash-flowing — sheltering income. Rental losses are passive: they offset passive income freely, and up to $25,000/yr can offset ordinary (W-2) income if you actively participate and your MAGI is under $100k (phasing out to $0 by $150k); unused losses carry forward. On sale, claimed depreciation is recaptured at up to 25%, and gains may owe capital-gains tax (a 1031 exchange can defer both). Figures are a year-1 estimate at your 24.0% rate — not tax advice; consult a CPA.
Schools (NCES district)
- District
- Wildwood City School District
- NCES district ID
- 3417940
- Math proficiency
- 12% ▼ -6.00%
- Reading proficiency
- 27% ▲ 5.00%
- Median HH income
- $33,232
- Composite
- 15.84/100
- National rank
- #9261
- State rank
- #442 of 472 in NJ
Livability — Wildwood
- Score
- 74/100
- State rank
- #176
- US rank
- #4679
Category grades
Schools grade is shown separately in the Schools card above.
Census & demographics
- Census place
- Wildwood, NJ
- Population (ZIP)
- 12,913
Population outlook (Cape May County) Hauer SSP2
- Today (2025)
- 88,234 people
- By 2030
- 84,144 · -4.6%
- By 2040
- 75,146 · -14.8%
- By 2050
- 67,389 · -23.6%
- By 2075
- 55,732 · -36.8%
- By 2100
- 44,972 · -49.0%
Race, ethnicity, and origin ACS 2023
- Neighborhood character
- Predominantly White (78%)
- Race & ethnicity
- White 78% Hispanic / Latino 14% Two or more races 7% Black 3% Native American 1%
- Hispanic origin (detail)
- Mexican 10% Puerto Rican 3%
- Common ancestry
- Romanian 7% Slovak 2% Lithuanian 1%
- Foreign-born
- 9% · Canada
- Languages at home
- 84% English-only · Spanish 12% Other Indo-European 3% French/Haitian/Cajun 1%
Political lean MEDSL · Cape May
- 2024 margin
- R (+19.2) · D 39.7% · R 58.9% · Other 1.4%
- 2008→2024 swing
- -10.6pp toward R · 2008: -8.7pp · 2024: -19.2pp
- All cycles
- 2024: R+19.2 2020: R+15.9 2016: R+19.9 2012: R+8.9 2008: R+8.7
Not yet ingested
- Civics
- —
Market trends
- HPI YoY
- ▼ -243.83%
- Current HPI
- 551.3393
- Rent YoY
- —
- Metro
- —
- State GDP YoY
- ▲ 2.05%
- F500 in state
- 34
Industry mix (Fortune 500 HQ in NJ)
| Industry | F500 HQs | Revenue |
|---|---|---|
| Consumer Goods | 3 | $31B |
|
||
| Pharmaceuticals | 2 | $153B |
|
||
| Technology | 2 | $21B |
|
||
| Insurance | 2 | $20B |
|
||
| Healthcare | 2 | $19B |
|
||
| Financial Services | 1 | $70B |
|
||
Price history
+898.0% since first listed16 events — show timeline
- 2026-03-06 Pending — CMCMLS
- 2026-01-31 Listed $1,097,777 CMCMLS
- 2026-01-01 Delisted — CMCMLS
- 2025-07-08 Listed $1,197,777 CMCMLS
- 2022-02-01 Sold (Public Records) $535,000 Public Records
- 2021-07-07 Price Changed $599,777 CMCMLS
- 2021-06-19 Price Changed $624,777 CMCMLS
- 2021-04-29 Sold (Public Records) $449,888 Public Records
- 2021-04-16 Sold (MLS) $449,888 SJSRMLS
- 2021-03-14 Contingent — SJSRMLS
- 2021-03-02 Listed $435,000 SJSRMLS
- 2015-06-24 Sold (Public Records) $275,000 Public Records
- 2015-06-06 Sold (MLS) $275,000 CMCMLS
- 2015-05-30 Delisted — CMCMLS
- 2015-04-27 Listed $300,000 CMCMLS
- 1983-01-10 Sold (Public Records) $110,000 Public Records
Property tax history
+3.6%/yrLatest (2025): $10,082 · +2.9% YoY. Source: county tax records.
Cash-flow waterfall
monthlySold comps — $/sqft
last 12 mo · ≤1 miLoading sold comps…