52 Fly St · Coffeeville, MS
Flood risk 1/10 · Minimal
- FEMA flood zone
- X (unshaded)
- Chance of flooding over 30 yrs
- 0.0%
- Est. flood insurance / yr
- $507 – $1,088
Fire risk 3/10 · Minor
- Est. fire insurance / yr
- $1,241 – $2,305
Heat risk 7/10 · Major
- Hot days now (above 109°F)
- 7 days/yr
- Hot days in 30 yrs
- 21 days/yr
Wind risk 6/10 · Moderate
- Chance of severe wind over 30 yrs
- 27.0%
Air-quality risk 1/10 · Minimal
- Unhealthy air days now
- 0 days/yr
- Unhealthy air days in 30 yrs
- 0 days/yr
Risk factors via First Street. Map © Google.
Why this score? — see what drove the A- grade
The composite is a weighted blend of 9 inputs, each scored 0–100. Each bar is that input's sub-score; the figure is the points it added to the 100-point composite (weight × sub-score).
- Cash flow +30.0/30.0
- ARV discount +15.0/15.0
- 1% rule +10.0/10.0
- DSCR +10.0/10.0
- Appreciation +6.6/10.0
- Livability +3.2/5.0
- Rent growth +2.5/5.0
- Condition / age +2.5/5.0
- Schools +0.6/10.0
$79,900
🖨 Deal sheet (PDF) 📄 Offer letter ✓ Due diligence
Listing remarks
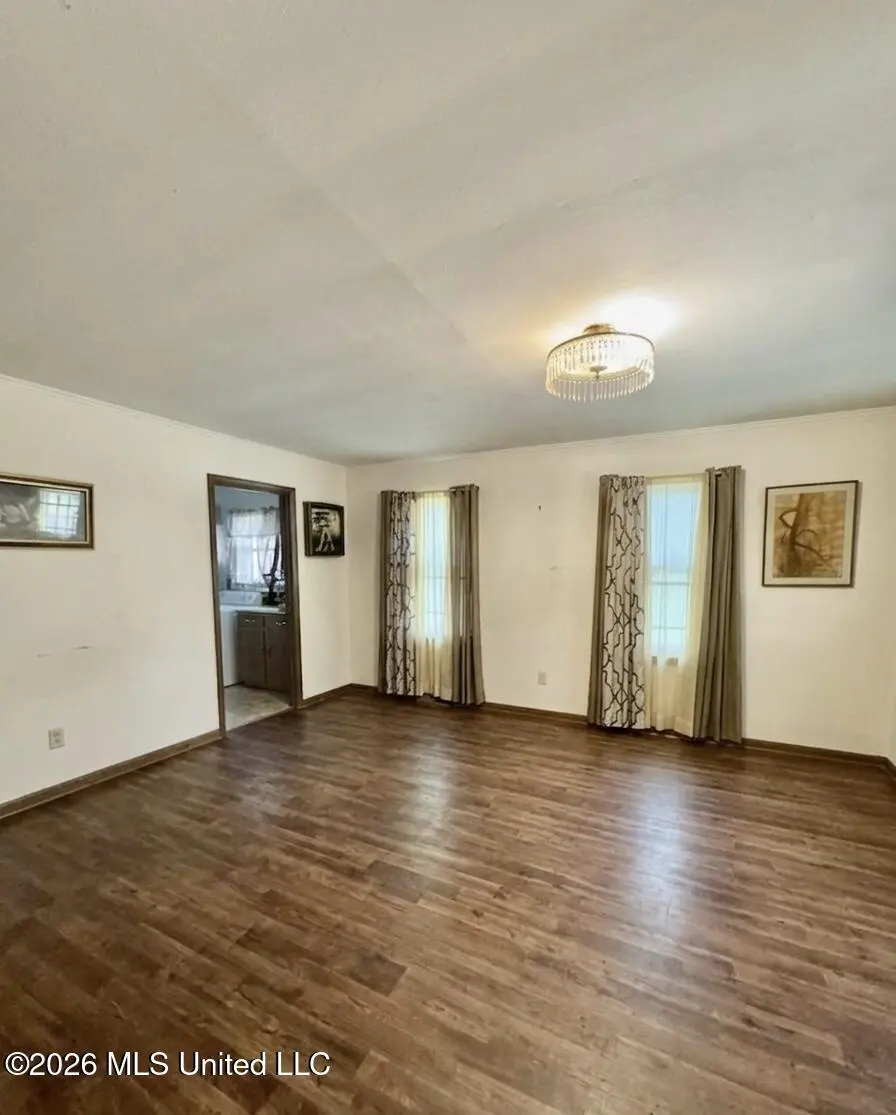
This classic Colonial home with a workshop and an in law apartment with private entrance owner has made some recent small renovations overall is in a good condition owner occupied we can show the house to do inspections after an offer is accepted. the house has a full kitchen upstairs and downstairs. Sold as is No Repairs!
Key facts
- In law apartment
- Colonial home
- Private entrance
Tags
Property features AI
Exterior
- Parking: 2-car garage; Concrete parking
- Utilities: Public water; Public sewer; Cable connected; Electricity connected; Water connected
- Home design: Single family residence; House; Two levels
- Construction: Brick construction; Asphalt roof; Combination foundation; Built in public records (year built source)
- Exterior features: Private yard
Interior
- Kitchen: Built-in electric range
- Bathrooms: 3 full bathrooms
- Heating & cooling: Electric heating; Central cooling
- Interior features: Built-in electric range
Neighborhood map
What this means for you Summary
Snapshot
- This is a 4-bed/3.0-bath single-family listed at $80k.
Deal economics
- At list price, monthly cash flow is $469 ($6k/yr) — positive.
- The deal already cash-flows at list — no discount required.
- Meets the 1% rule at list price ($1k rent vs $80k).
- Recommended offer: $78k (3.0% below list) — sets the bar for market timing.
Location & tenants
- Location reads 64/100 on livability (#132 in MS) — a middle-class / working-renter tenant base. Strengths: crime A+, cost of living A+, housing A+; Watch: health & safety D+, schools F, amenities F.
- Coffeeville School District (rural): math 4% / reading 12% proficiency, ranked #122 of 130 in MS (top 94%) — low school quality limits family demand, transient renter base, plan for 1-2y turnover; 90% free/reduced lunch — lower-income household profile, screen leases tightly.
- Market conditions: 27 active listings in the ZIP; 24 units permitted in Yalobusha County in 2024 (0 in 5+ unit buildings).
Forward outlook
- In year one you build about $3k of equity ($552 loan paydown + $3k appreciation (3.2% local appreciation)).
- Yalobusha County population projected at -11% by 2050 — secular population decline; favor cash flow + early exit over multi-decade hold.
- At projected returns (3.2% appreciation + 3.0% rent growth), your $22k cash investment doubles in ~3 years — after that, you're playing with house money.
- By year 10, paydown + projected appreciation supports a ~$30k cash-out refi (75% LTV) — recoverable capital for the next deal without selling this one.
Negotiation context
- It's been on market 52 days — a 3% lower offer ($78k) is reasonable based on typical stale-listing flexibility.
Risks & watch-outs
- Watch-outs: built in 1957 — expect roof / HVAC / electrical / plumbing capex.
- Climate carrying-cost: major wind risk, 27% chance of damaging wind over 30y; extreme-heat days projected 7→21/yr by 2055 (HVAC capex compounding) — expect insurance premiums to compound above CPI over the hold.
Questions for the listing agent
- It's been on market 52 days. Have you received any prior offers? Is the seller open to a 3% concession, seller financing, or rate buy-down credit?
- Built in 1957 — when were the roof, HVAC, electrical panel, plumbing, and water heater last replaced?
- Is there a deadline driving the sale (1031 exchange, divorce, estate, relocation)? That informs how much negotiation room exists.
- Schools are F-rated, which usually means shorter tenancies and higher turnover. Who's the typical renter profile here, and what's been the actual vacancy rate?
- What's the average days-on-market for RENTAL listings here right now (not sales)? A rising rental-DOM trend means longer vacancies and softer asking-rent achievability than the comps imply.
- What's the recent tenant-quality profile in this submarket — average credit score on applications, eviction rate, late-payment / NSF rate, and stable-employment percentage? A property-management company in the area should have these aggregated.
- How much new for-sale + rental construction is in the pipeline within 1–3 miles? Heavy new supply typically softens prices + rents 12–24 months out; constrained supply supports both.
Investment metrics
- 1% rule
- 1.54% ✓
- Cap rate
- 13.34%
- Cash-on-cash
- 25.15%
- DSCR
- 2.12
- GRM
- 5.4
CMA / ARV
- ARV (median comp)
- $127,709
- List price
- $79,900
- Delta
- -37.44%
- Verdict
- UNDERPRICED
- Comps
- 2 within 1.0 mi
Projected returns pro-forma
3.23% appreciation · 3.0% rent growth · sell at horizon
- IRR
- 31.6%
- Equity multiple
- 2.81×
- Total profit
- $40,451
- Equity at exit
- $36,958
- IRR
- 31.7%
- Equity multiple
- 5.51×
- Total profit
- $100,949
- Equity at exit
- $57,772
Cash invested: $22,372 (down + closing). Projections, not guarantees.
Landlord ↔ Tenant lean methodology
- Overall (STATE)
- 90 Strongly Landlord-Friendly
- State Mississippi
- 90 Strongly Landlord-Friendly · R+11
- County
- — inherits STATE
- City
- — inherits STATE
ZIP-level market 38922
- Home prices YoY
- 2.9%
- Active inventory
- 27
- Price-to-rent
- 5.4×
Monthly cashflow live
- Estimated rent
- $1,231 medium interval (Pro) →
- Mortgage (P&I)
- −$419
- Tax from tax record
- −$51 /mo · $613/yr
- Insurance
- −$33
- HOA
- −$0
- Vacancy / Maint / Mgmt
- −$258
- Net cashflow
- $469
Break-even live
Sensitivity live
| Price | -10% $514 | -5% $492 | +0% $469 | +5% $446 | +10% $424 |
|---|---|---|---|---|---|
| Rent | -10% $372 | -5% $420 | +0% $469 | +5% $518 | +10% $566 |
| Rate | -1.0pp $509 | -0.5pp $489 | base $469 | +0.5pp $448 | +1.0pp $427 |
UW: 25.0% down · 7.5% · 30yr · 1.5% tax · 5.0% vac · 8.0% maint · 8.0% mgmt
Financing live
Cash to close
- Down payment
- $19,975
- Closing costs
- $2,397
- Reserves months
- —
- Total cash needed
- —
Loan-product check · same deal, 3 products live
Conventional
25% down · 7.5% · 30yr
- Down + closing
- —
- Monthly P&I
- —
- Monthly cashflow
- —
- DSCR
- —
- Eligible?
- —
Personal DTI + credit; lowest rate.
DSCR
20% down · 8.5% · 30yr
- Down + closing
- —
- Monthly P&I
- —
- Monthly cashflow
- —
- DSCR
- —
- Eligible?
- —
No personal income docs; deal must DSCR.
Hard money
10% down · 12.0% · 12mo
- Down + closing
- —
- Monthly P&I
- —
- Monthly cashflow
- —
- DSCR
- —
- Eligible?
- —
Short-term bridge; refi at stabilization.
Listing history 21 events
-
2026-06-21days on market $79,900 Active 52 DOM
-
2026-06-19days on market $79,900 Active 50 DOM
-
2026-06-18days on market $79,900 Active 49 DOM
-
2026-06-17days on market $79,900 Active 48 DOM
-
2026-06-16days on market $79,900 Active 47 DOM
-
2026-06-15days on market $79,900 Active 46 DOM
-
2026-06-14days on market $79,900 Active 44 DOM
-
2026-06-12days on market $79,900 Active 43 DOM
-
2026-06-09days on market $79,900 Active 40 DOM
-
2026-06-08days on market $79,900 Active 39 DOM
-
2026-06-07days on market $79,900 Active 38 DOM
-
2026-06-05days on market $79,900 Active 35 DOM
-
2026-06-03days on market $79,900 Active 34 DOM
-
2026-06-02days on market $79,900 Active 33 DOM
-
2026-06-01days on market $79,900 Active 32 DOM
-
2026-05-31days on market $79,900 Active 31 DOM
-
2026-05-30days on market $79,900 Active 30 DOM
-
2026-05-16price $79,900 325-char remark
-
2026-05-13price $74,900 325-char remark
-
2026-04-30$84,900 Active 325-char remark
-
1989-02-02soldstatus
ⓘ Source: listings_history table (triggers on properties + properties_extension) + one-shot
backfill from property_details.listing_events for pre-trigger history.
Tax reassessment forecast MS · Resets to sale price
- Current annual tax
- $613 · $51/mo
- Projected year-2 tax
- $631 · $53/mo
- Expected delta
- +$18/yr (+$2/mo · 2.9%)
ⓘ Screening estimate from a state-policy table — verify with the county assessor before closing.
Climate risk First Street
- Flood 1/10 Low FEMA zone X (unshaded) · 0% chance over 30 yrs
- Wildfire 3/10 Moderate
- Heat 7/10 Severe 7 d/yr ≥109°F today · 21 d/yr by 30 yrs out
- Wind 6/10 Major 27% chance of damaging wind over 30 yrs
- Air quality 1/10 Low 0 unhealthy d/yr today · 0 by 30 yrs out
Nearby sold comps map
Loading sold comps map…
Walkable amenities ~0.75 mi
Loading nearby amenities…
Taxation est. · year 1
- Rental income
- $14,770
- − Mortgage interest
- −$4,476
- − Property taxes
- −$613
- − Insurance
- −$400
- − Repairs & maintenance
- −$1,182
- − Management
- −$1,182
- − Depreciation
- −$2,324
- Taxable income
- $4,594
- Est. tax owed @ 24.0%
- −$1,103
- After-tax cash flow
- $4,525/yr
For passive investors: Depreciation is non-cash, so a rental often shows a tax loss while cash-flowing — sheltering income. Rental losses are passive: they offset passive income freely, and up to $25,000/yr can offset ordinary (W-2) income if you actively participate and your MAGI is under $100k (phasing out to $0 by $150k); unused losses carry forward. On sale, claimed depreciation is recaptured at up to 25%, and gains may owe capital-gains tax (a 1031 exchange can defer both). Figures are a year-1 estimate at your 24.0% rate — not tax advice; consult a CPA.
Schools (NCES district)
- District
- Coffeeville School District
- NCES district ID
- 2801140
- Math proficiency
- 4% ▼ -29.00%
- Reading proficiency
- 12% ▼ -14.00%
- Median HH income
- $33,357
- Composite
- 6.34/100
- National rank
- #10001
- State rank
- #122 of 130 in MS
Livability — Coffeeville
- Score
- 64/100
- State rank
- #132
- US rank
- #14222
Category grades
Schools grade is shown separately in the Schools card above.
Census & demographics
- Census place
- Coffeeville, MS
- Population (ZIP)
- 3,126
Population outlook (Yalobusha County) Hauer SSP2
- Today (2025)
- 12,062 people
- By 2030
- 11,811 · -2.1%
- By 2040
- 11,297 · -6.3%
- By 2050
- 10,771 · -10.7%
- By 2075
- 9,679 · -19.8%
- By 2100
- 8,400 · -30.4%
Race, ethnicity, and origin ACS 2023
- Neighborhood character
- Majority White (57%)
- Race & ethnicity
- White 57% Black 41% Two or more races 2%
- Common ancestry
- Lithuanian 1% Serbian 1%
- Foreign-born
- 0% · Vietnam
- Languages at home
- 99% English-only · Spanish 1%
Political lean MEDSL · Yalobusha
- 2024 margin
- Strong R (+20.9) · D 38.9% · R 59.9% · Other 1.2%
- 2008→2024 swing
- -13.9pp toward R · 2008: -7.0pp · 2024: -20.9pp
- All cycles
- 2024: R+20.9 2020: R+13.6 2016: R+13.1 2012: R+4.4 2008: R+7.0
Not yet ingested
- Civics
- —
Market trends
- HPI YoY
- ▲ 3.23%
- Current HPI
- 114.2626
- Rent YoY
- —
- Metro
- —
- State GDP YoY
- —
- F500 in state
- 0
Price history
-5.9% since first listed4 events — show timeline
- 2026-05-16 Price Changed $79,900 MLSU
- 2026-05-13 Price Changed $74,900 MLSU
- 2026-04-30 Listed $84,900 MLSU
- 1989-02-02 Sold (Public Records) — Public Records
Property tax history
+2.8%/yrLatest (2019): $613 · -23.1% YoY. Source: county tax records.
Cash-flow waterfall
monthlySold comps — $/sqft
last 12 mo · ≤1 miLoading sold comps…