 🏷️ Likely Rental
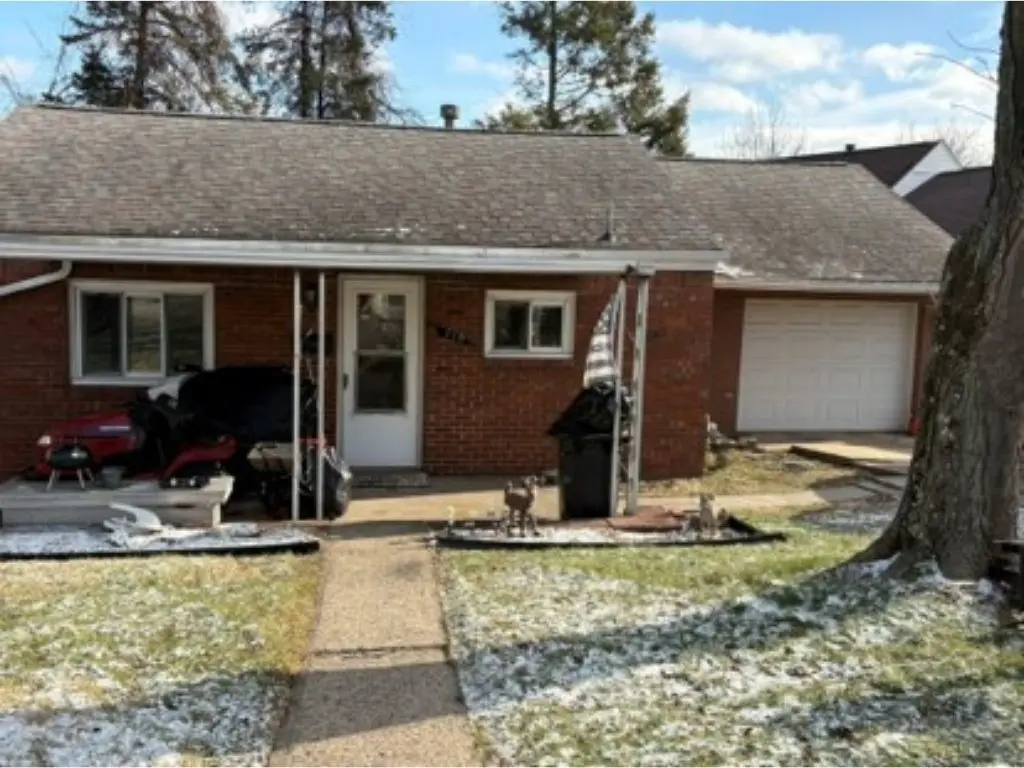
118 Delrose Dr · Liberty, PA
Flood risk 1/10 · Minimal
- FEMA flood zone
- X (unshaded)
- Chance of flooding over 30 yrs
- 0.0%
- Est. flood insurance / yr
- $507 – $1,088
Fire risk 1/10 · Minimal
- Est. fire insurance / yr
- $511 – $949
Heat risk 4/10 · Minor
- Hot days now (above 97°F)
- 7 days/yr
- Hot days in 30 yrs
- 18 days/yr
Wind risk 2/10 · Minimal
- Chance of severe wind over 30 yrs
- —
Air-quality risk 5/10 · Moderate
- Unhealthy air days now
- 8 days/yr
- Unhealthy air days in 30 yrs
- 8 days/yr
Risk factors via First Street. Map © Google.
Why this score? — see what drove the D+ grade
The composite is a weighted blend of 9 inputs, each scored 0–100. Each bar is that input's sub-score; the figure is the points it added to the 100-point composite (weight × sub-score).
- ARV discount +15.0/15.0
- Cash flow +9.2/30.0
- Appreciation +7.3/10.0
- 1% rule +4.1/10.0
- Livability +3.6/5.0
- Schools +2.8/10.0
- DSCR +2.6/10.0
- Rent growth +2.5/5.0
- Condition / age +2.5/5.0
$90,000
🖨 Deal sheet (PDF) 📄 Offer letter ✓ Due diligence
Listing remarks MLS
Attention Investors! Turnkey Rental Property. Long-term Tenant occupied. Please do not disturb occupant, appointment required. 1 BR, 1 Bath with 1 car garage. Central heat & A/C, washer, dryer, stove, refrigerator. New Light fixtures & new deck updates. Start your rental portfolio today.
Key facts
- Central heat
- A/c
- Dryer
Tags
Neighborhood map
What this means for you Summary
Snapshot
- This is a 1-bed/1.0-bath single-family listed at $90k.
Deal economics
- At list price, monthly cash flow is $-67 ($-802/yr) — negative.
- To cash-flow at today's rent, offer at most $78k (13.1% below list).
- To meet the 1% rule (rent ≥ 1% of price), the offer needs to be $82k (9.0% below list).
- Recommended offer: $78k (13.1% below list) — sets the bar for cash-flow.
Location & tenants
- Location reads 72/100 on livability (#659 in PA) — a middle-class / working-renter tenant base. Strengths: crime A+, cost of living A+, housing A+; Watch: employment C-, health & safety D, amenities F.
- South Allegheny SD (suburban): math 23% / reading 44% proficiency, ranked #430 of 539 in PA (top 80%) — families likely to look elsewhere, expect single-tenant / working-renter base with shorter leases.
- Market conditions: 39 active listings in the ZIP; 3 comparable units currently listed for rent nearby; rentals at typical pace (median 25d on market — plan ~3-4 weeks tenant-placement turnaround); 2,996 units permitted in Allegheny County in 2024 (1,588 in 5+ unit buildings).
- This rent is only 15% of the median local income ($66k/yr) — well below the 30% rent-burden line; pricing power to push rent on renewal without tenant pushback.
Forward outlook
- In year one you build about $5k of equity ($622 loan paydown + $4k appreciation (4.5% local appreciation)).
- At projected returns (4.5% appreciation + 3.0% rent growth), your $25k cash investment doubles in ~6 years — after that, you're playing with house money.
- By year 7, paydown + projected appreciation supports a ~$30k cash-out refi (75% LTV) — recoverable capital for the next deal without selling this one.
Negotiation context
- It's been on market 73 days — a 6% lower offer ($85k) is reasonable based on typical stale-listing flexibility.
- Current owner paid $25k; list at $90k implies a 260% gain — meaningful room to come down on a strong offer.
Risks & watch-outs
- Watch-outs: property tax is 2.7% of price; built in 1952 — expect roof / HVAC / electrical / plumbing capex.
Questions for the listing agent
- What do current leases actually rent for vs. the listed asking? Can we see a recent rent roll and the last 12 months of T-12 income?
- It's been on market 73 days. Have you received any prior offers? Is the seller open to a 13% concession, seller financing, or rate buy-down credit?
- Built in 1952 — when were the roof, HVAC, electrical panel, plumbing, and water heater last replaced?
- Property tax is high relative to price — has the assessment been appealed recently, and will the sale trigger a re-assessment?
- Why hasn't it sold? Are there any deal-killer items the seller is aware of (foundation, flood, title, zoning, code violations)?
- Is there a deadline driving the sale (1031 exchange, divorce, estate, relocation)? That informs how much negotiation room exists.
- Schools are B-rated — typically a magnet for longer-tenancy family renters. What's the average tenant stay here, and is there a school-zone premium baked into asking?
- The area grade is low — what's the realistic commute time and amenity access for the typical tenant pool here? Any planned neighborhood developments (good or bad) we should know about?
- What's the average days-on-market for RENTAL listings here right now (not sales)? A rising rental-DOM trend means longer vacancies and softer asking-rent achievability than the comps imply.
- What's the recent tenant-quality profile in this submarket — average credit score on applications, eviction rate, late-payment / NSF rate, and stable-employment percentage? A property-management company in the area should have these aggregated.
- How much new for-sale + rental construction is in the pipeline within 1–3 miles? Heavy new supply typically softens prices + rents 12–24 months out; constrained supply supports both.
Investment metrics
- 1% rule
- 0.91% ✗
- Cap rate
- 5.40%
- Cash-on-cash
- -3.18%
- DSCR
- 0.86
- GRM
- 9.2
CMA / ARV
- ARV (median comp)
- $119,638
- List price
- $90,000
- Delta
- -24.77%
- Verdict
- UNDERPRICED
- Comps
- 16 within 1.0 mi
Show comp detail 1 sale within ~0.75 mi
| Address | Dist | Beds/Ba | Sqft | Sold | Price | $/sf | Match |
|---|---|---|---|---|---|---|---|
| 2811 F St | 0.45mi | 2/1.0 (+1) | 672 (-4%) | 20mo | $25,000 | $37 | 50 |
Match score weights: distance 35% · size 25% · config 20% · recency 20%. Top-matched comps best support the ARV.
Projected returns pro-forma
4.52% appreciation · 3.0% rent growth · sell at horizon
- IRR
- 9.0%
- Equity multiple
- 1.56×
- Total profit
- $14,122
- Equity at exit
- $48,413
- IRR
- 10.8%
- Equity multiple
- 2.89×
- Total profit
- $47,736
- Equity at exit
- $81,489
Cash invested: $25,200 (down + closing). Projections, not guarantees.
Landlord ↔ Tenant lean methodology
- Overall (STATE)
- 62 Landlord-Friendly
- State Pennsylvania
- 62 Landlord-Friendly · EVEN
- County
- — inherits STATE
- City
- — inherits STATE
ZIP-level market 15133
- Home prices YoY
- 2.1%
- Active inventory
- 39
- Price-to-rent
- 9.2×
Monthly cashflow live
- Estimated rent
- $819 medium interval (Pro) →
- Mortgage (P&I)
- −$472
- Tax from tax record
- −$205 /mo · $2,456/yr
- Insurance
- −$38
- HOA
- −$0
- Vacancy / Maint / Mgmt
- −$172
- Net cashflow
- $-67
Break-even live
Sensitivity live
| Price | -10% $-16 | -5% $-41 | +0% $-67 | +5% $-92 | +10% $-118 |
|---|---|---|---|---|---|
| Rent | -10% $-132 | -5% $-99 | +0% $-67 | +5% $-34 | +10% $-2 |
| Rate | -1.0pp $-22 | -0.5pp $-44 | base $-67 | +0.5pp $-90 | +1.0pp $-114 |
UW: 25.0% down · 7.5% · 30yr · 1.5% tax · 5.0% vac · 8.0% maint · 8.0% mgmt
Financing live
Cash to close
- Down payment
- $22,500
- Closing costs
- $2,700
- Reserves months
- —
- Total cash needed
- —
Loan-product check · same deal, 3 products live
Conventional
25% down · 7.5% · 30yr
- Down + closing
- —
- Monthly P&I
- —
- Monthly cashflow
- —
- DSCR
- —
- Eligible?
- —
Personal DTI + credit; lowest rate.
DSCR
20% down · 8.5% · 30yr
- Down + closing
- —
- Monthly P&I
- —
- Monthly cashflow
- —
- DSCR
- —
- Eligible?
- —
No personal income docs; deal must DSCR.
Hard money
10% down · 12.0% · 12mo
- Down + closing
- —
- Monthly P&I
- —
- Monthly cashflow
- —
- DSCR
- —
- Eligible?
- —
Short-term bridge; refi at stabilization.
Rent comps 3 comps
| Address | Beds | Baths | Sqft | Rent | $/sqft | DOM | Units | Dist |
|---|---|---|---|---|---|---|---|---|
| 2860 Washington Blvd Unit 5 McKeesport, PA | 1.0 | 1.0 | 600 | $799 | $1.33 | 25d | 1 | 0.30mi |
| 2860 Washington Blvd Unit 3 McKeesport, PA | 1.0 | 1.0 | 600 | $799 | $1.33 | 45d | 1 | 0.30mi |
| 313 San Juan Dr McKeesport, PA | 1.0 | 1.0 | 520 | $775 | $1.49 | 25d | 1 | 1.49mi |
Listing history 17 events
-
2026-06-21days on market $90,000 Active 73 DOM
-
2026-06-18days on market $90,000 Active 70 DOM
-
2026-06-17days on market $90,000 Active 69 DOM
-
2026-06-16days on market $90,000 Active 68 DOM
-
2026-06-15days on market $90,000 Active 67 DOM
-
2026-06-13days on market $90,000 Active 65 DOM
-
2026-06-13days on market $90,000 Active 64 DOM
-
2026-06-09days on market $90,000 Active 61 DOM
-
2026-06-08days on market $90,000 Active 60 DOM
-
2026-06-07days on market $90,000 Active 59 DOM
-
2026-06-05days on market $90,000 Active 56 DOM
-
2026-06-03days on market $90,000 Active 55 DOM
-
2026-06-02days on market $90,000 Active 54 DOM
-
2026-06-01days on market $90,000 Active 53 DOM
-
2026-05-31days on market $90,000 Active 52 DOM
-
2026-04-09$90,000 Active 301-char remark
Show marketing remark (301 chars)
Attention Investors! Turnkey Rental Property. Long-term Tenant occupied. Please do not disturb occupant, appointment required. 1 BR, 1 Bath with 1 car garage. Central heat & A/C, washer, dryer, stove, refrigerator. New Light fixtures & new deck updates. Start your rental portfolio today.
-
2009-08-20soldstatus $25,000
ⓘ Source: listings_history table (triggers on properties + properties_extension) + one-shot
backfill from property_details.listing_events for pre-trigger history.
Tax reassessment forecast PA · Partial reset (capped growth)
- Current annual tax
- $2,456 · $205/mo
- Projected year-2 tax
- $2,456 · $205/mo
- Expected delta
- $0/yr ($0/mo · 0.0%)
ⓘ Screening estimate from a state-policy table — verify with the county assessor before closing.
Climate risk First Street
- Flood 1/10 Low FEMA zone X (unshaded) · 0% chance over 30 yrs
- Wildfire 1/10 Low
- Heat 4/10 Moderate 7 d/yr ≥97°F today · 18 d/yr by 30 yrs out
- Wind 2/10 Low
- Air quality 5/10 Major 8 unhealthy d/yr today · 8 by 30 yrs out
Nearby sold comps map
Loading sold comps map…
Walkable amenities ~0.75 mi
Loading nearby amenities…
Taxation est. · year 1
- Rental income
- $9,832
- − Mortgage interest
- −$5,041
- − Property taxes
- −$2,456
- − Insurance
- −$450
- − Repairs & maintenance
- −$787
- − Management
- −$787
- − Depreciation
- −$2,618
- Taxable loss
- −$2,307
- Est. tax savings @ 24.0%
- +$554
- After-tax cash flow
- $-249/yr
For passive investors: Depreciation is non-cash, so a rental often shows a tax loss while cash-flowing — sheltering income. Rental losses are passive: they offset passive income freely, and up to $25,000/yr can offset ordinary (W-2) income if you actively participate and your MAGI is under $100k (phasing out to $0 by $150k); unused losses carry forward. On sale, claimed depreciation is recaptured at up to 25%, and gains may owe capital-gains tax (a 1031 exchange can defer both). Figures are a year-1 estimate at your 24.0% rate — not tax advice; consult a CPA.
Schools (NCES district)
- District
- South Allegheny SD
- NCES district ID
- 4221910
- Math proficiency
- 23% ▼ -10.00%
- Reading proficiency
- 44% ▼ -13.00%
- Median HH income
- $40,891
- Composite
- 28.15/100
- National rank
- #6815
- State rank
- #430 of 539 in PA
Livability — Liberty
- Score
- 72/100
- State rank
- #659
- US rank
- #6444
Category grades
Schools grade is shown separately in the Schools card above.
Census & demographics
- Census place
- Liberty, PA
- County
- Allegheny County · 1,022,028 people
- City population
- 6,139
- Metro
- Pittsburgh, PA
- Population (ZIP)
- 6,112
- Household income
- $65,938
- Rent vs Own
- Severe rent burden
- 94.0
Population outlook (Allegheny County) Hauer SSP2
- Today (2025)
- 1,250,282 people
- By 2030
- 1,256,482 · +0.5%
- By 2040
- 1,256,318 · +0.5%
- By 2050
- 1,244,169 · -0.5%
- By 2075
- 1,197,693 · -4.2%
- By 2100
- 1,093,187 · -12.6%
Race, ethnicity, and origin ACS 2023
- Neighborhood character
- Predominantly White (84%)
- Race & ethnicity
- White 84% Two or more races 7% Black 4% Hispanic / Latino 3%
- Common ancestry
- Romanian 10% Slovene 2% Italian 2%
- Foreign-born
- 0%
- Languages at home
- 99% English-only · Other Indo-European 1%
Political lean MEDSL · Allegheny
- 2024 margin
- Strong D (+20.3) · D 59.7% · R 39.4%
- 2008→2024 swing
- +4.8pp toward D · 2008: 15.5pp · 2024: 20.3pp
- All cycles
- 2024: D+20.3 2020: D+20.4 2016: D+16.4 2012: D+14.4 2008: D+15.5
Not yet ingested
- Civics
- —
Market trends
- HPI YoY
- ▲ 4.52%
- Current HPI
- 214.5922
- Rent YoY
- —
- Metro
- Pittsburgh, PA
- State GDP YoY
- ▲ 1.68%
- F500 in state
- 34
Industry mix (Fortune 500 HQ in PA)
| Industry | F500 HQs | Revenue |
|---|---|---|
| Healthcare | 2 | $309B |
|
||
| Insurance | 2 | $27B |
|
||
| Telecommunications / Media | 1 | $124B |
|
||
| Industrial Distribution | 1 | $22B |
|
||
| Financial Services | 1 | $20B |
|
||
| Chemicals / Materials | 1 | $18B |
|
||
Price history
+260.0% since first listed2 events — show timeline
- 2026-04-09 Listed $90,000 West Penn MLS
- 2009-08-20 Sold (Public Records) $25,000 Public Records
Property tax history
+4.7%/yrLatest (2026): $2,456 · +6.0% YoY. Source: county tax records.
Cash-flow waterfall
monthlySold comps — $/sqft
last 12 mo · ≤1 miLoading sold comps…