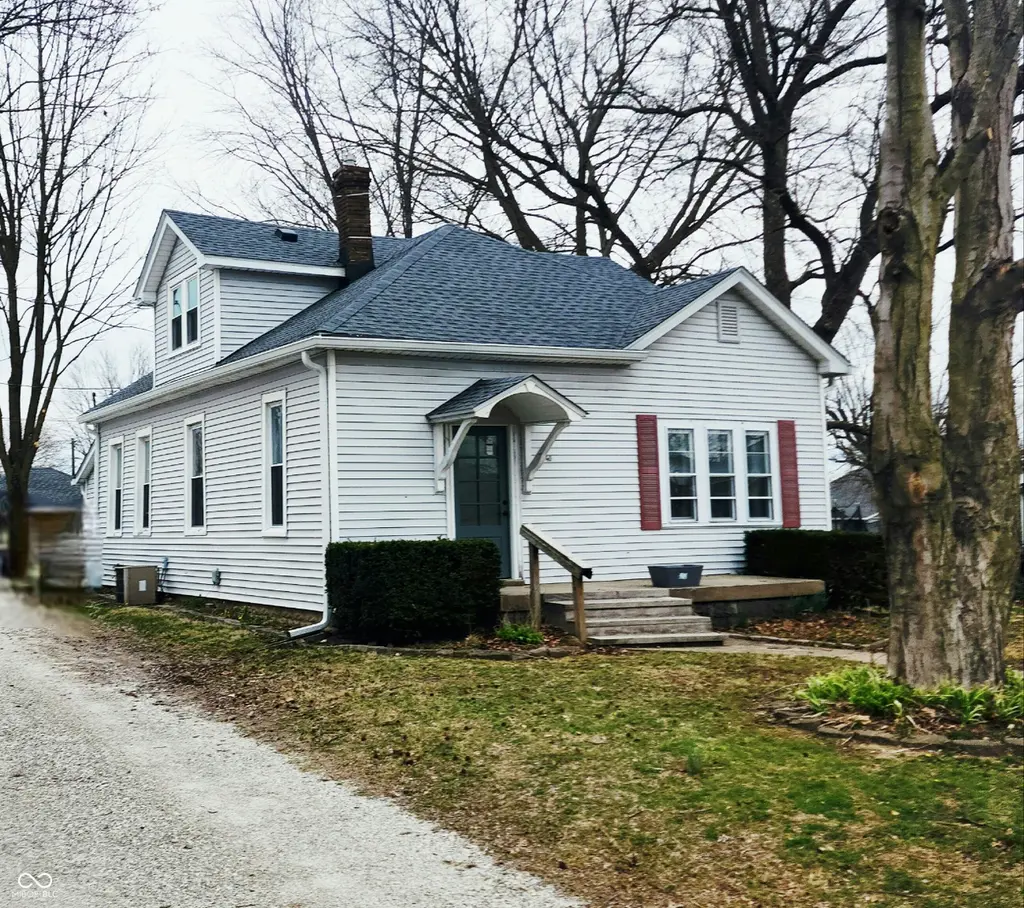
40 W Main St · Monrovia, IN
Flood risk 1/10 · Minimal
- FEMA flood zone
- X (unshaded)
- Chance of flooding over 30 yrs
- 0.0%
- Est. flood insurance / yr
- $507 – $1,088
Fire risk 1/10 · Minimal
- Est. fire insurance / yr
- $717 – $1,331
Heat risk 3/10 · Minor
- Hot days now (above 102°F)
- 7 days/yr
- Hot days in 30 yrs
- 20 days/yr
Wind risk 2/10 · Minimal
- Chance of severe wind over 30 yrs
- 1.0%
Air-quality risk 3/10 · Minor
- Unhealthy air days now
- 2 days/yr
- Unhealthy air days in 30 yrs
- 3 days/yr
Risk factors via First Street. Map © Google.
Why this score? — see what drove the D- grade
The composite is a weighted blend of 9 inputs, each scored 0–100. Each bar is that input's sub-score; the figure is the points it added to the 100-point composite (weight × sub-score).
- ARV discount +12.8/15.0
- Cash flow +7.4/30.0
- Appreciation +4.5/10.0
- Schools +3.4/10.0
- Livability +3.3/5.0
- Rent growth +2.5/5.0
- Condition / age +2.5/5.0
- DSCR +1.5/10.0
- 1% rule +0.8/10.0
$284,999
🖨 Deal sheet 📄 Offer letter ✓ Due diligence
Listing remarks MLS
Come home to this spacious 1930 built Cape Cod-style 4 bedroom, 2 full bath that blends classic character with functional updates. Nestled on easily maintainable .23 acre lot in town, walking distance to Monrovia Schools, local restaurants and local park. Quick commute to i70 and Indianapolis Airport. The house features inviting living spaces filled with natural light, original hardwood floors, and rich history architecture. A formal dining room that creates the perfect setting for family get togethers. 2 car detached garage with storage loft. Many updates including roof, gutters, and underlayment September 2025. Come home to this small town, living storybook gem.
Key facts
- Formal dining room
- Built-in shelves
- Cape cod style
Tags
Neighborhood map
What this means for you Summary
Snapshot
- This is a 2-bed/1.0-bath single-family listed at $285k.
Deal economics
- At list price, monthly cash flow is $-366 ($-4k/yr) — negative.
- To cash-flow at today's rent, offer at most $220k (22.7% below list).
- To meet the 1% rule (rent ≥ 1% of price), the offer needs to be $164k (42.3% below list).
- Recommended offer: $164k (42.3% below list) — sets the bar for 1% rule.
Location & tenants
- Location reads 66/100 on livability (#304 in IN) — a middle-class / working-renter tenant base. Strengths: crime A+, employment A+, cost of living A+; Watch: schools D, amenities F, commute F.
- Monroe-Gregg School District (rural): math 31% / reading 45% proficiency, ranked #143 of 301 in IN (top 48%) — families likely to look elsewhere, expect single-tenant / working-renter base with shorter leases.
- Market conditions: 56 active listings in the ZIP; 330 units permitted in Morgan County in 2024 (0 in 5+ unit buildings).
Forward outlook
- Local home prices are declining (-1.0%/yr); year-one equity from $2k of loan paydown is wiped out by about $3k of value loss. Plan a longer hold.
- Morgan County population projected to shrink 6% by 2050 — rents likely to lag national; underwrite the cash flow, not the appreciation.
Negotiation context
- It's been on market 79 days — a 6% lower offer ($268k) is reasonable based on typical stale-listing flexibility.
- 6 sale attempts since 14y ago; this cycle's ask has dropped $40k (12%) from the opening price — seller is motivated, your offer sets the floor, not the list.
- Current owner paid $145k; list at $285k implies a 97% gain — meaningful room to come down on a strong offer.
Risks & watch-outs
- Watch-outs: built in 1930 — expect roof / HVAC / electrical / plumbing capex.
Questions for the listing agent
- What do current leases actually rent for vs. the listed asking? Can we see a recent rent roll and the last 12 months of T-12 income?
- It's been on market 79 days. Have you received any prior offers? Is the seller open to a 42% concession, seller financing, or rate buy-down credit?
- Built in 1930 — when were the roof, HVAC, electrical panel, plumbing, and water heater last replaced?
- Why hasn't it sold? Are there any deal-killer items the seller is aware of (foundation, flood, title, zoning, code violations)?
- Is there a deadline driving the sale (1031 exchange, divorce, estate, relocation)? That informs how much negotiation room exists.
- Schools are D-rated, which usually means shorter tenancies and higher turnover. Who's the typical renter profile here, and what's been the actual vacancy rate?
- The area grade is low — what's the realistic commute time and amenity access for the typical tenant pool here? Any planned neighborhood developments (good or bad) we should know about?
- What's the average days-on-market for RENTAL listings here right now (not sales)? A rising rental-DOM trend means longer vacancies and softer asking-rent achievability than the comps imply.
- What's the recent tenant-quality profile in this submarket — average credit score on applications, eviction rate, late-payment / NSF rate, and stable-employment percentage? A property-management company in the area should have these aggregated.
- How much new for-sale + rental construction is in the pipeline within 1–3 miles? Heavy new supply typically softens prices + rents 12–24 months out; constrained supply supports both.
Investment metrics
- 1% rule
- 0.58% ✗
- Cap rate
- 4.75%
- Cash-on-cash
- -5.51%
- DSCR
- 0.75
- GRM
- 14.4
CMA / ARV
- ARV (median comp)
- $323,245
- List price
- $284,999
- Delta
- -11.83%
- Verdict
- UNDERPRICED
- Comps
- 20 within 1.0 mi
Show comp detail 2 sales within ~0.75 mi
| Address | Dist | Beds/Ba | Sqft | Sold | Price | $/sf | Match |
|---|---|---|---|---|---|---|---|
| 11027 N Trapunto Ln | 0.53mi | 3/2.5 (+1) | 2,044 (-10%) | 18mo | $300,000 | $147 | 33 |
| 495 S Chestnut St | 0.53mi | 3/2.5 (+1) | 2,498 (+10%) | 17mo | $565,000 | $226 | 32 |
Match score weights: distance 35% · size 25% · config 20% · recency 20%. Top-matched comps best support the ARV.
Projected returns pro-forma
-1.0% appreciation · 3.0% rent growth · sell at horizon
- IRR
- -13.1%
- Equity multiple
- 0.44×
- Total profit
- $-44,907
- Equity at exit
- $68,842
- IRR
- -6.4%
- Equity multiple
- 0.42×
- Total profit
- $-46,544
- Equity at exit
- $72,329
Cash invested: $79,800 (down + closing). Projections, not guarantees.
Landlord ↔ Tenant lean methodology
- Overall (STATE)
- 90 Strongly Landlord-Friendly
- State Indiana
- 90 Strongly Landlord-Friendly · R+11
- County
- — inherits STATE
- City
- — inherits STATE
ZIP-level market 46157
- Home prices YoY
- -0.5%
- Active inventory
- 56
- Price-to-rent
- 14.4×
Monthly cashflow live
- Estimated rent
- $1,644 medium interval (Pro) →
- Mortgage (P&I)
- −$1,495
- Tax from tax record
- −$52 /mo · $625/yr
- Insurance
- −$119
- HOA
- −$0
- Vacancy / Maint / Mgmt
- −$345
- Net cashflow
- $-366
Break-even live
UW: 25.0% down · 7.5% · 30yr · 1.5% tax · 5.0% vac · 8.0% maint · 8.0% mgmt
Financing live
Cash to close
- Down payment
- $71,250
- Closing costs
- $8,550
- Reserves months
- —
- Total cash needed
- —
Loan-product check · same deal, 3 products live
Conventional
25% down · 7.5% · 30yr
- Down + closing
- —
- Monthly P&I
- —
- Monthly cashflow
- —
- DSCR
- —
- Eligible?
- —
Personal DTI + credit; lowest rate.
DSCR
20% down · 8.5% · 30yr
- Down + closing
- —
- Monthly P&I
- —
- Monthly cashflow
- —
- DSCR
- —
- Eligible?
- —
No personal income docs; deal must DSCR.
Hard money
10% down · 12.0% · 12mo
- Down + closing
- —
- Monthly P&I
- —
- Monthly cashflow
- —
- DSCR
- —
- Eligible?
- —
Short-term bridge; refi at stabilization.
Listing history 28 events
-
2026-06-18days on market $284,999 Active 79 DOM
-
2026-06-17days on market $284,999 Active 78 DOM
-
2026-06-16days on market $284,999 Active 77 DOM
-
2026-06-15days on market $284,999 Active 76 DOM
-
2026-06-13days on market $284,999 Active 74 DOM
-
2026-06-09days on market $284,999 Active 70 DOM
-
2026-06-08days on market $284,999 Active 69 DOM
-
2026-06-07days on market $284,999 Active 68 DOM
-
2026-06-05days on market $284,999 Active 65 DOM
-
2026-06-03days on market $284,999 Active 64 DOM
-
2026-06-02days on market $284,999 Active 63 DOM
-
2026-06-01days on market $284,999 Active 62 DOM
-
2026-05-31days on market $284,999 Active 61 DOM
-
2026-05-19price $284,999 672-char remark
Show marketing remark (672 chars)
Come home to this spacious 1930 built Cape Cod-style 4 bedroom, 2 full bath that blends classic character with functional updates. Nestled on easily maintainable .23 acre lot in town, walking distance to Monrovia Schools, local restaurants and local park. Quick commute to i70 and Indianapolis Airport. The house features inviting living spaces filled with natural light, original hardwood floors, and rich history architecture. A formal dining room that creates the perfect setting for family get togethers. 2 car detached garage with storage loft. Many updates including roof, gutters, and underlayment September 2025. Come home to this small town, living storybook gem.
-
2026-04-21price $300,000 672-char remark
Show marketing remark (672 chars)
Come home to this spacious 1930 built Cape Cod-style 4 bedroom, 2 full bath that blends classic character with functional updates. Nestled on easily maintainable .23 acre lot in town, walking distance to Monrovia Schools, local restaurants and local park. Quick commute to i70 and Indianapolis Airport. The house features inviting living spaces filled with natural light, original hardwood floors, and rich history architecture. A formal dining room that creates the perfect setting for family get togethers. 2 car detached garage with storage loft. Many updates including roof, gutters, and underlayment September 2025. Come home to this small town, living storybook gem.
-
2026-04-14price $315,000 672-char remark
Show marketing remark (672 chars)
Come home to this spacious 1930 built Cape Cod-style 4 bedroom, 2 full bath that blends classic character with functional updates. Nestled on easily maintainable .23 acre lot in town, walking distance to Monrovia Schools, local restaurants and local park. Quick commute to i70 and Indianapolis Airport. The house features inviting living spaces filled with natural light, original hardwood floors, and rich history architecture. A formal dining room that creates the perfect setting for family get togethers. 2 car detached garage with storage loft. Many updates including roof, gutters, and underlayment September 2025. Come home to this small town, living storybook gem.
-
2026-03-29$325,000 Active 672-char remark
Show marketing remark (672 chars)
Come home to this spacious 1930 built Cape Cod-style 4 bedroom, 2 full bath that blends classic character with functional updates. Nestled on easily maintainable .23 acre lot in town, walking distance to Monrovia Schools, local restaurants and local park. Quick commute to i70 and Indianapolis Airport. The house features inviting living spaces filled with natural light, original hardwood floors, and rich history architecture. A formal dining room that creates the perfect setting for family get togethers. 2 car detached garage with storage loft. Many updates including roof, gutters, and underlayment September 2025. Come home to this small town, living storybook gem.
-
2018-10-16soldstatus $145,000 Sold 249-char remark
Show marketing remark (249 chars)
Welcome Home! This gem is full of charm and character. Featuring 4 bedrooms, 2 full bathrooms, galley kitchen with formal dining room, built-in cabinetry throughout. New flooring, fresh paint, new water heater and newer roof. Home warranty included.
-
2018-09-11status Pending 249-char remark
Show marketing remark (249 chars)
Welcome Home! This gem is full of charm and character. Featuring 4 bedrooms, 2 full bathrooms, galley kitchen with formal dining room, built-in cabinetry throughout. New flooring, fresh paint, new water heater and newer roof. Home warranty included.
-
2018-09-05status Active 249-char remark
Show marketing remark (249 chars)
Welcome Home! This gem is full of charm and character. Featuring 4 bedrooms, 2 full bathrooms, galley kitchen with formal dining room, built-in cabinetry throughout. New flooring, fresh paint, new water heater and newer roof. Home warranty included.
-
2018-08-28status Pending 249-char remark
Show marketing remark (249 chars)
Welcome Home! This gem is full of charm and character. Featuring 4 bedrooms, 2 full bathrooms, galley kitchen with formal dining room, built-in cabinetry throughout. New flooring, fresh paint, new water heater and newer roof. Home warranty included.
-
2018-08-21$150,000 Active 249-char remark
Show marketing remark (249 chars)
Welcome Home! This gem is full of charm and character. Featuring 4 bedrooms, 2 full bathrooms, galley kitchen with formal dining room, built-in cabinetry throughout. New flooring, fresh paint, new water heater and newer roof. Home warranty included.
-
2014-12-02soldstatus $88,500 Sold
-
2014-09-09$89,900
-
2014-09-05historical
-
2013-07-18$99,900
-
2013-05-21historical
-
2012-06-12$85,400
ⓘ Source: listings_history table (triggers on properties + properties_extension) + one-shot
backfill from property_details.listing_events for pre-trigger history.
Tax reassessment forecast IN · Partial reset (capped growth)
- Current annual tax
- $625 · $52/mo
- Projected year-2 tax
- $1,524 · $127/mo
- Expected delta
- +$899/yr (+$75/mo · 143.8%)
ⓘ Screening estimate from a state-policy table — verify with the county assessor before closing.
Climate risk First Street
- Flood 1/10 Low FEMA zone X (unshaded) · 0% chance over 30 yrs
- Wildfire 1/10 Low
- Heat 3/10 Moderate 7 d/yr ≥102°F today · 20 d/yr by 30 yrs out
- Wind 2/10 Low 100% chance of damaging wind over 30 yrs
- Air quality 3/10 Moderate 2 unhealthy d/yr today · 3 by 30 yrs out
Nearby sold comps map
Loading sold comps map…
Walkable amenities ~0.75 mi
Loading nearby amenities…
Taxation est. · year 1
- Rental income
- $19,733
- − Mortgage interest
- −$15,964
- − Property taxes
- −$625
- − Insurance
- −$1,425
- − Repairs & maintenance
- −$1,579
- − Management
- −$1,579
- − Depreciation
- −$8,291
- Taxable loss
- −$9,729
- Est. tax savings @ 24.0%
- +$2,335
- After-tax cash flow
- $-2,061/yr
For passive investors: Depreciation is non-cash, so a rental often shows a tax loss while cash-flowing — sheltering income. Rental losses are passive: they offset passive income freely, and up to $25,000/yr can offset ordinary (W-2) income if you actively participate and your MAGI is under $100k (phasing out to $0 by $150k); unused losses carry forward. On sale, claimed depreciation is recaptured at up to 25%, and gains may owe capital-gains tax (a 1031 exchange can defer both). Figures are a year-1 estimate at your 24.0% rate — not tax advice; consult a CPA.
Schools (NCES district)
- District
- Monroe-Gregg School District
- NCES district ID
- 1804140
- Math proficiency
- 31% ▼ -9.00%
- Reading proficiency
- 45% ▼ -4.00%
- Median HH income
- $64,767
- Composite
- 34.2/100
- National rank
- #5266
- State rank
- #143 of 301 in IN
Livability — Monrovia
- Score
- 66/100
- State rank
- #304
- US rank
- #12092
Category grades
Schools grade is shown separately in the Schools card above.
Census & demographics
- Census place
- Monrovia, IN
- Population (ZIP)
- 4,370
Population outlook (Morgan County) Hauer SSP2
- Today (2025)
- 71,081 people
- By 2030
- 71,178 · +0.1%
- By 2040
- 69,907 · -1.7%
- By 2050
- 66,455 · -6.5%
- By 2075
- 57,291 · -19.4%
- By 2100
- 43,782 · -38.4%
Race, ethnicity, and origin ACS 2023
- Neighborhood character
- Predominantly White (90%)
- Race & ethnicity
- White 90% Two or more races 5% Hispanic / Latino 3% Black 2% Asian 1%
- Common ancestry
- Slovak 2% Italian 2% Lithuanian 1%
- Foreign-born
- 2%
- Languages at home
- 98% English-only · Tagalog/Filipino 1%
Political lean MEDSL · Morgan
- 2024 margin
- Solid R (+54.3) · D 22.0% · R 76.3% · Other 1.7%
- 2008→2024 swing
- -27.3pp toward R · 2008: -27.1pp · 2024: -54.3pp
- All cycles
- 2024: R+54.3 2020: R+54.6 2016: R+56.6 2012: R+41.1 2008: R+27.1
Not yet ingested
- Civics
- —
Market trends
- HPI YoY
- ▼ -1.00%
- Current HPI
- 212.8798
- Rent YoY
- —
- Metro
- —
- State GDP YoY
- ▲ 2.90%
- F500 in state
- 18
Industry mix (Fortune 500 HQ in IN)
| Industry | F500 HQs | Revenue |
|---|---|---|
| Industrial Machinery | 2 | $37B |
|
||
| Healthcare | 1 | $177B |
|
||
| Pharmaceuticals | 1 | $45B |
|
||
| Metals / Steel | 1 | $18B |
|
||
| Agriculture | 1 | $17B |
|
||
| Packaging | 1 | $12B |
|
||
Price history
+233.7% since first listed15 events — show timeline
- 2026-05-19 Price Changed $284,999 MIBOR as Distributed by MLS Grid
- 2026-04-21 Price Changed $300,000 MIBOR as Distributed by MLS Grid
- 2026-04-14 Price Changed $315,000 MIBOR as Distributed by MLS Grid
- 2026-03-29 Listed $325,000 MIBOR as Distributed by MLS Grid
- 2018-10-16 Sold (MLS) $145,000 MIBOR as Distributed by MLS Grid
- 2018-09-11 Pending — MIBOR as Distributed by MLS Grid
- 2018-09-05 Relisted — MIBOR as Distributed by MLS Grid
- 2018-08-28 Pending — MIBOR as Distributed by MLS Grid
- 2018-08-21 Listed $150,000 MIBOR as Distributed by MLS Grid
- 2014-12-02 Sold (MLS) $88,500 MIBOR as Distributed by MLS Grid
- 2014-09-09 Listed $89,900 MIBOR as Distributed by MLS Grid
- 2014-09-05 Listing Removed — MIBOR as Distributed by MLS Grid
- 2013-07-18 Listed $99,900 MIBOR as Distributed by MLS Grid
- 2013-05-21 Listing Removed — MIBOR as Distributed by MLS Grid
- 2012-06-12 Listed $85,400 MIBOR as Distributed by MLS Grid
Property tax history
-5.4%/yrLatest (2025): $625 · -10.9% YoY. Source: county tax records.
Cash-flow waterfall
monthlySold comps — $/sqft
last 12 mo · ≤1 miLoading sold comps…