1009 Balboa Trl · Raymore, MO
Flood risk No data
- FEMA flood zone
- —
- Chance of flooding over 30 yrs
- —
- Est. flood insurance / yr
- —
Fire risk No data
- Est. fire insurance / yr
- —
Heat risk No data
- Hot days now (above threshold)
- —
- Hot days in 30 yrs
- —
Wind risk No data
- Chance of severe wind over 30 yrs
- —
Air-quality risk No data
- Unhealthy air days now
- —
- Unhealthy air days in 30 yrs
- —
Risk factors via First Street. Map © Google.
Why this score? — see what drove the D- grade
The composite is a weighted blend of 9 inputs, each scored 0–100. Each bar is that input's sub-score; the figure is the points it added to the 100-point composite (weight × sub-score).
- ARV discount +11.6/15.0
- Cash flow +7.9/30.0
- Schools +4.0/10.0
- Rent growth +3.6/5.0
- Livability +3.6/5.0
- 1% rule +2.6/10.0
- Condition / age +2.5/5.0
- DSCR +2.0/10.0
- Appreciation +0.0/10.0
$282,463
🖨 Deal sheet 📄 Offer letter ✓ Due diligence
Listing remarks MLS
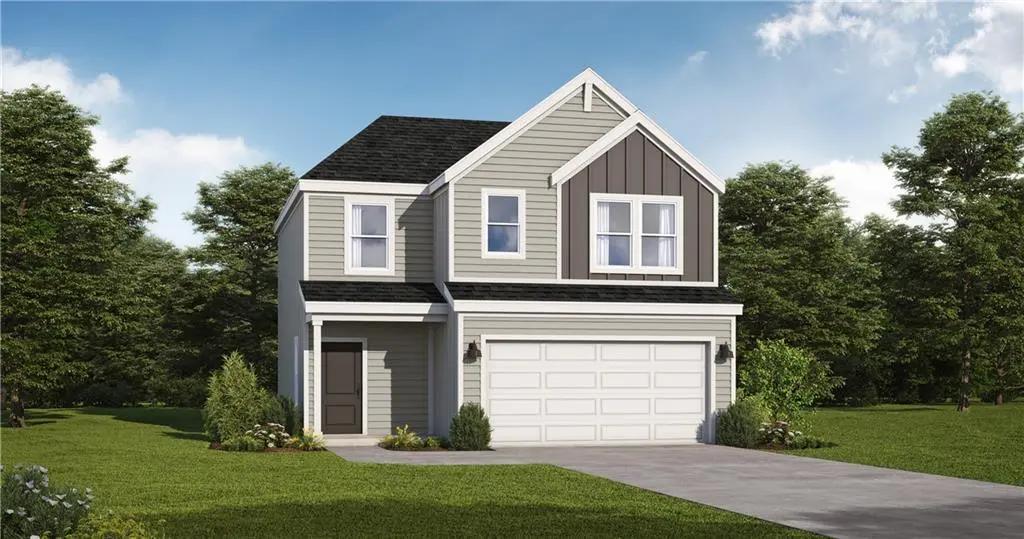
Coming Fall of 2026, Bluebell Model Home in Sendera! Carefully designed to maximize space, The Bluebell offers features today's buyers want, with efficient use of space, practical storage, and a functional layout that makes it comfortable and affordable. The main level features an open-concept great room and kitchen that creates the perfect space for gathering, entertaining, and everyday moments. A spacious island, abundant natural light, and easy access to the patio make the heart of the home feel welcoming and connected. Upstairs, the private primary suite offers a relaxing retreat with a spacious bedroom, en-suite bath, and walk-in closet. Two additional bedrooms, a full bath, and a conveniently located laundry room provide comfortable space for family, guests, or a home office. Like what you see? Set an appointment today to learn more about the design options, finishings, and pricing!
Key facts
- Clubhouse
- Quartz island
- Pool
Tags
Neighborhood map
What this means for you Summary
Snapshot
- This is a 3-bed/2.5-bath single-family listed at $282k.
Deal economics
- At list price, monthly cash flow is $-303 ($-4k/yr) — negative.
- To cash-flow at today's rent, offer at most $239k (15.5% below list).
- To meet the 1% rule (rent ≥ 1% of price), the offer needs to be $215k (24.0% below list).
- Recommended offer: $215k (24.0% below list) — sets the bar for 1% rule.
- Cap rate 5.0% vs local median 3.2% in Raymore — top-decile yield for the area; either an underpriced asset or a hidden risk that comps aren't pricing in. Stress-test before assuming the spread holds.
Location & tenants
- Location reads 71/100 on livability (#111 in MO) — a middle-class / working-renter tenant base. Strengths: employment A+, housing A+, crime A; Watch: amenities F, commute F, health & safety F.
- Raymore-Peculiar R-II (suburban): math 37% / reading 51% proficiency, ranked #70 of 324 in MO (top 22%) — families likely to look elsewhere, expect single-tenant / working-renter base with shorter leases.
- Market conditions: Rents rising fast (+4.6%/yr); 352 active listings in the ZIP; 5 comparable units currently listed for rent nearby; rentals at typical pace (median 17d on market — plan ~3-4 weeks tenant-placement turnaround); solid renter incomes; 588 units permitted in Cass County in 2024 (0 in 5+ unit buildings).
Forward outlook
- Local home prices are declining (-3.0%/yr); year-one equity from $2k of loan paydown is wiped out by about $8k of value loss. Plan a longer hold.
- Cass County population projected to shrink 3% by 2050 — rents likely to lag national; underwrite the cash flow, not the appreciation.
Negotiation context
- It's been on market 104 days — a 9% lower offer ($257k) is reasonable based on typical stale-listing flexibility.
- 2 sale attempts with the ask held roughly flat each time — persistent listings suggest the price (not the market) is what's stuck; bring a comps-based counter.
Questions for the listing agent
- What do current leases actually rent for vs. the listed asking? Can we see a recent rent roll and the last 12 months of T-12 income?
- It's been on market 104 days. Have you received any prior offers? Is the seller open to a 24% concession, seller financing, or rate buy-down credit?
- What does the HOA fee cover, when was the last increase, and are there any pending special assessments or reserve-fund shortfalls?
- Why hasn't it sold? Are there any deal-killer items the seller is aware of (foundation, flood, title, zoning, code violations)?
- Is there a deadline driving the sale (1031 exchange, divorce, estate, relocation)? That informs how much negotiation room exists.
- Schools are B-rated — typically a magnet for longer-tenancy family renters. What's the average tenant stay here, and is there a school-zone premium baked into asking?
- The area grade is low — what's the realistic commute time and amenity access for the typical tenant pool here? Any planned neighborhood developments (good or bad) we should know about?
- What's the average days-on-market for RENTAL listings here right now (not sales)? A rising rental-DOM trend means longer vacancies and softer asking-rent achievability than the comps imply.
- What's the recent tenant-quality profile in this submarket — average credit score on applications, eviction rate, late-payment / NSF rate, and stable-employment percentage? A property-management company in the area should have these aggregated.
- How much new for-sale + rental construction is in the pipeline within 1–3 miles? Heavy new supply typically softens prices + rents 12–24 months out; constrained supply supports both.
Investment metrics
- 1% rule
- 0.76% ✗
- Cap rate
- 5.01%
- Cash-on-cash
- -4.60%
- DSCR
- 0.80
- GRM
- 11.0
CMA / ARV
- ARV (median comp)
- $310,814
- List price
- $282,463
- Delta
- -9.12%
- Verdict
- FAIR
- Comps
- 20 within 1.0 mi
Show comp detail 4 sales within ~0.75 mi
| Address | Dist | Beds/Ba | Sqft | Sold | Price | $/sf | Match |
|---|---|---|---|---|---|---|---|
| 819 Cypress Ct | 0.73mi | 3/2.0 | 1,460 (-2%) | 8mo | $299,950 | $205 | 54 |
| 1012 Bristol Dr | 0.72mi | 3/2.0 | 1,588 (+6%) | 11mo | $300,000 | $189 | 44 |
| 1121 Bristol Dr | 0.74mi | 3/2.0 | 1,518 (+2%) | 20mo | $310,000 | $204 | 44 |
| 1102 Bristol Dr | 0.74mi | 3/2.0 | 1,712 (+15%) | 0mo | $324,000 | $189 | 39 |
Match score weights: distance 35% · size 25% · config 20% · recency 20%. Top-matched comps best support the ARV.
Projected returns pro-forma
-3.0% appreciation · 4.56% rent growth · sell at horizon
- IRR
- -22.3%
- Equity multiple
- 0.22×
- Total profit
- $-61,586
- Equity at exit
- $42,116
- IRR
- -12.8%
- Equity multiple
- 0.19×
- Total profit
- $-63,738
- Equity at exit
- $24,422
Cash invested: $79,090 (down + closing). Projections, not guarantees.
Landlord ↔ Tenant lean methodology
- Overall (STATE)
- 81 Strongly Landlord-Friendly
- State Missouri
- 81 Strongly Landlord-Friendly · R+10
- County
- — inherits STATE
- City
- — inherits STATE
ZIP-level market 64083
- Rents YoY
- 4.6%
- Active inventory
- 352
- Price-to-rent
- 11.0×
Monthly cashflow live
- Estimated rent
- $2,146 high interval (Pro) →
- Mortgage (P&I)
- −$1,481
- Tax est. 1.5%
- −$353 /mo · $4,237/yr
- Insurance
- −$118
- HOA
- −$46
- Vacancy / Maint / Mgmt
- −$451
- Net cashflow
- $-303
Break-even live
UW: 25.0% down · 7.5% · 30yr · 1.5% tax · 5.0% vac · 8.0% maint · 8.0% mgmt
Financing live
Cash to close
- Down payment
- $70,616
- Closing costs
- $8,474
- Reserves months
- —
- Total cash needed
- —
Loan-product check · same deal, 3 products live
Conventional
25% down · 7.5% · 30yr
- Down + closing
- —
- Monthly P&I
- —
- Monthly cashflow
- —
- DSCR
- —
- Eligible?
- —
Personal DTI + credit; lowest rate.
DSCR
20% down · 8.5% · 30yr
- Down + closing
- —
- Monthly P&I
- —
- Monthly cashflow
- —
- DSCR
- —
- Eligible?
- —
No personal income docs; deal must DSCR.
Hard money
10% down · 12.0% · 12mo
- Down + closing
- —
- Monthly P&I
- —
- Monthly cashflow
- —
- DSCR
- —
- Eligible?
- —
Short-term bridge; refi at stabilization.
Rent comps 5 comps
| Address | Beds | Baths | Sqft | Rent | $/sqft | DOM | Units | Dist |
|---|---|---|---|---|---|---|---|---|
| 724 Bristol Dr Raymore, MO | 3.0 | 2.0 | 1718 | $2,026 | $1.18 | 14d | 1 | 0.75mi |
| 728 Corrington Dr Raymore, MO | 3.0 | 2.5 | 1656 | $2,056 | $1.24 | 23d | 1 | 0.91mi |
| 960 Cedarcrest Dr Raymore, MO | 2.0–3.0 | 2.0–2.5 | 1305 | $2,035 | $1.56 | 1d | 11 | 0.97mi |
| 404 Meadow Ln Raymore, MO | 3.0 | 2.0 | 1584 | $1,905 | $1.20 | 21d | 1 | 1.39mi |
| 200 Toucan St Raymore, MO | 3.0 | 2.0 | 1300 | $2,100 | $1.62 | 17d | 1 | 1.43mi |
HOA detail
- Monthly dues
- $46 · $552/yr
Listing history 15 events
-
2026-06-18days on market $282,463 Active 104 DOM
-
2026-06-17days on market $282,463 Active 103 DOM
-
2026-06-16days on market $282,463 Active 102 DOM
-
2026-06-15days on market $282,463 Active 101 DOM
-
2026-06-13days on market $282,463 Active 99 DOM
-
2026-06-13days on market $282,463 Active 98 DOM
-
2026-06-09days on market $282,463 Active 95 DOM
-
2026-06-08days on market $282,463 Active 94 DOM
-
2026-06-07days on market $282,463 Active 93 DOM
-
2026-06-03days on market $282,463 Active 89 DOM
-
2026-06-02days on market $282,463 Active 88 DOM
-
2026-06-01days on market $282,463 Active 87 DOM
-
2026-05-31days on market $282,463 Active 86 DOM
-
2026-03-13$282,463 Active 901-char remark
Show marketing remark (901 chars)
Coming Fall of 2026, Bluebell Model Home in Sendera! Carefully designed to maximize space, The Bluebell offers features today's buyers want, with efficient use of space, practical storage, and a functional layout that makes it comfortable and affordable. The main level features an open-concept great room and kitchen that creates the perfect space for gathering, entertaining, and everyday moments. A spacious island, abundant natural light, and easy access to the patio make the heart of the home feel welcoming and connected. Upstairs, the private primary suite offers a relaxing retreat with a spacious bedroom, en-suite bath, and walk-in closet. Two additional bedrooms, a full bath, and a conveniently located laundry room provide comfortable space for family, guests, or a home office. Like what you see? Set an appointment today to learn more about the design options, finishings, and pricing!
-
2026-03-06$282,463 Active 1666-char remark
Show marketing remark (1666 chars)
BRAND NEW MODEL HOME NOT FOR SALE currently in development, scheduled to dig in 30 days and be completed to preview in July/Aug 2026 to become the Welcome Center. We have other homesites available for you to build your next home. Call the listing agent for more details. Come out and see this Brand-New Summit Homes Community called SendERA and models should be completed around this summer. The Bluebell by award winning Summit Homes is a new design on a slab foundation. This 2 Story home has all 3 bedrooms and 2 full baths upstairs. The kitchen has a quartz island that overlooks the dining room and great room with walk-in pantry. Luxury vinal planks, and carpet on the main level, white cabinets and black hardware & plumbing finishes give a fresh open & inviting look. The huge primary bedroom and bathroom have a walk-in shower and a massive walk-in closet. The 2 guest bedrooms share full bath with quartz tops and tub/shower combo. The laundry room is conveniently located in between those rooms. Wow! Welcome to Sendera, a 7-phase project that will bring over 420 new residences to Raymore! Sendera is located East of I-49 and Cass Parkway interchange on Hubach Hill Road in Raymore. This community will offer a wide range of home products, creating a vibrant neighborhood. Residents will enjoy various amenities, including a clubhouse, pool, playground, cascading pond, and walking trails, with easy access to local attractions such as Raymore Recreation Park, schools, shopping, and restaurants. Pricing is LIVE! We are officially taking appointments and lot reservations! Get in touch with our New Home Specialists to set up an appointment!
ⓘ Source: listings_history table (triggers on properties + properties_extension) + one-shot
backfill from property_details.listing_events for pre-trigger history.
Nearby sold comps map
Loading sold comps map…
Walkable amenities ~0.75 mi
Loading nearby amenities…
Taxation est. · year 1
- Rental income
- $25,748
- − Mortgage interest
- −$15,822
- − Property taxes
- −$4,237
- − Insurance
- −$1,412
- − Repairs & maintenance
- −$2,060
- − Management
- −$2,060
- − HOA
- −$552
- − Depreciation
- −$8,217
- Taxable loss
- −$8,612
- Est. tax savings @ 24.0%
- +$2,067
- After-tax cash flow
- $-1,568/yr
For passive investors: Depreciation is non-cash, so a rental often shows a tax loss while cash-flowing — sheltering income. Rental losses are passive: they offset passive income freely, and up to $25,000/yr can offset ordinary (W-2) income if you actively participate and your MAGI is under $100k (phasing out to $0 by $150k); unused losses carry forward. On sale, claimed depreciation is recaptured at up to 25%, and gains may owe capital-gains tax (a 1031 exchange can defer both). Figures are a year-1 estimate at your 24.0% rate — not tax advice; consult a CPA.
Schools (NCES district)
- District
- Raymore-Peculiar R-II
- NCES district ID
- 2923730
- Math proficiency
- 37% ▼ -10.00%
- Reading proficiency
- 51% ▼ -5.00%
- Median HH income
- $71,939
- Composite
- 39.86/100
- National rank
- #3865
- State rank
- #70 of 324 in MO
Livability — Raymore
- Score
- 71/100
- State rank
- #111
- US rank
- #7062
Category grades
Schools grade is shown separately in the Schools card above.
Census & demographics
- Census place
- Raymore, MO
- County
- Cass County · 65,358 people
- City population
- 26,201
- Metro
- Kansas City, MO-KS
- Population (ZIP)
- 26,201
- Household income
- $101,667
- Rent vs Own
- Severe rent burden
- 488.0
Population outlook (Cass County) Hauer SSP2
- Today (2025)
- 105,292 people
- By 2030
- 106,109 · +0.8%
- By 2040
- 105,786 · +0.5%
- By 2050
- 102,062 · -3.1%
- By 2075
- 88,569 · -15.9%
- By 2100
- 68,293 · -35.1%
Race, ethnicity, and origin ACS 2023
- Neighborhood character
- Predominantly White (78%)
- Race & ethnicity
- White 78% Two or more races 10% Black 9% Hispanic / Latino 6% Asian 1%
- Hispanic origin (detail)
- Mexican 2%
- Common ancestry
- Romanian 4% Italian 3% Serbian 2%
- Foreign-born
- 2% · Canada
- Languages at home
- 97% English-only · Spanish 1% Tagalog/Filipino 1%
Political lean MEDSL · Cass
- 2024 margin
- Solid R (+32.1) · D 33.3% · R 65.4% · Other 1.3%
- 2008→2024 swing
- -12.5pp toward R · 2008: -19.6pp · 2024: -32.1pp
- All cycles
- 2024: R+32.1 2020: R+31.6 2016: R+35.9 2012: R+28.4 2008: R+19.6
Not yet ingested
- Civics
- —
Market trends
- HPI YoY
- ▼ -211.98%
- Current HPI
- 181.1129
- Rent YoY
- ▲ 4.56%
- Metro
- Kansas City, MO-KS
- State GDP YoY
- ▲ 1.84%
- F500 in state
- 20
Industry mix (Fortune 500 HQ in MO)
| Industry | F500 HQs | Revenue |
|---|---|---|
| Healthcare | 1 | $163B |
|
||
| Insurance | 1 | $21B |
|
||
| Industrial Technology | 1 | $17B |
|
||
| Retail | 1 | $16B |
|
||
| Industrial Distribution | 1 | $10B |
|
||
| Utilities | 1 | $9B |
|
||
Price history
+0.0% since first listed2 events — show timeline
- 2026-03-13 Listed $282,463 Zillow
- 2026-03-06 Listed $282,463 Heartland MLS as Distributed by MLS Grid
Cash-flow waterfall
monthlySold comps — $/sqft
last 12 mo · ≤1 miLoading sold comps…