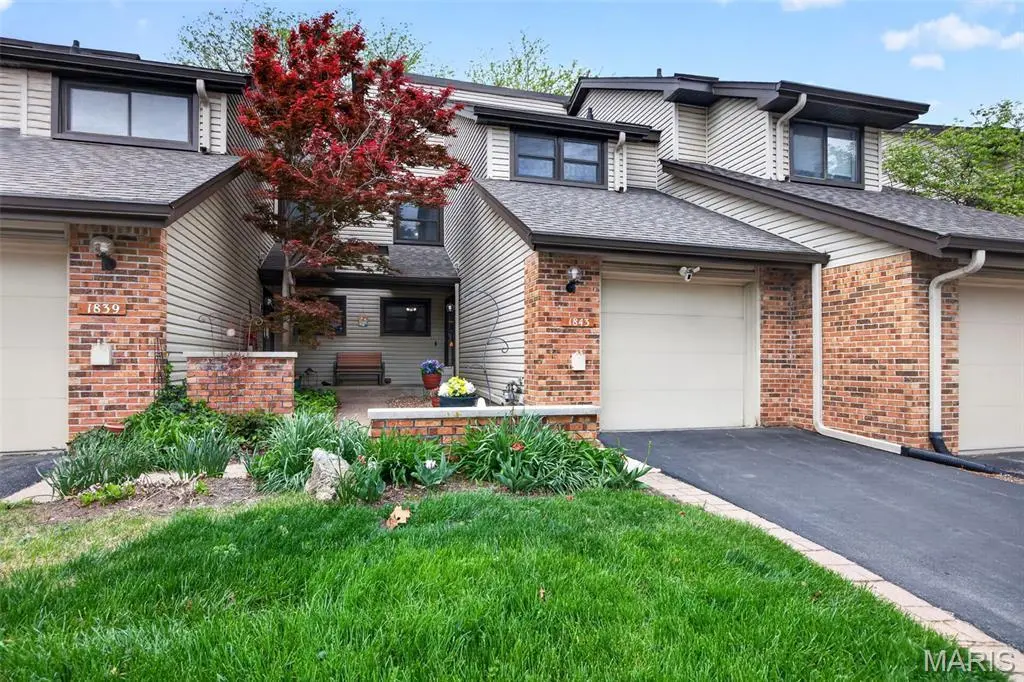
1843 Tawny Ash Dr · Maryland Heights, MO
Flood risk 1/10 · Minimal
- FEMA flood zone
- X (unshaded)
- Chance of flooding over 30 yrs
- 0.0%
- Est. flood insurance / yr
- $473 – $860
Fire risk 1/10 · Minimal
- Est. fire insurance / yr
- $1,054 – $1,958
Heat risk 5/10 · Moderate
- Hot days now (above 107°F)
- 7 days/yr
- Hot days in 30 yrs
- 21 days/yr
Wind risk 2/10 · Minimal
- Chance of severe wind over 30 yrs
- 1.0%
Air-quality risk 2/10 · Minimal
- Unhealthy air days now
- 1 days/yr
- Unhealthy air days in 30 yrs
- 3 days/yr
Risk factors via First Street. Map © Google.
Why this score? — see what drove the D grade
The composite is a weighted blend of 9 inputs, each scored 0–100. Each bar is that input's sub-score; the figure is the points it added to the 100-point composite (weight × sub-score).
- Appreciation +10.0/10.0
- ARV discount +7.5/15.0
- Cash flow +7.2/30.0
- 1% rule +4.2/10.0
- Livability +3.6/5.0
- Schools +3.4/10.0
- Condition / age +2.5/5.0
- Rent growth +1.8/5.0
- DSCR +1.4/10.0
$228,775
🖨 Deal sheet (PDF) 📄 Offer letter ✓ Due diligence
Listing remarks
This beautifully updated townhome in the highly sought-after Westport complex offers the perfect blend of comfort, style, and convenience. Featuring 2 bedrooms, 2.5 bathrooms, a partially finished lower level (ideal for 3rd bedroom), and a single-car attached garage, this home is designed for modern living. Step into the inviting courtyard before entering the foyer with easy access to the garage—perfect for unloading groceries—and a convenient half bath. The main level showcases a spacious family room with a cozy wood-burning fireplace and direct access to a private deck, ideal for relaxing at the end of the day. The fully renovated gourmet kitchen (2018) is a standout, featurin
Key facts
- $504 HOA
- Garage
- Community pool
Neighborhood map
What this means for you Summary
Snapshot
- This is a 3-bed/2.5-bath condo listed at $229k.
Deal economics
- At list price, monthly cash flow is $-314 ($-4k/yr) — negative.
- To cash-flow at today's rent, offer at most $173k (24.3% below list).
- To meet the 1% rule (rent ≥ 1% of price), the offer needs to be $211k (7.8% below list).
- Recommended offer: $173k (24.3% below list) — sets the bar for cash-flow.
Location & tenants
- Location reads 71/100 on livability (#101 in MO) — a middle-class / working-renter tenant base. Strengths: cost of living A+, housing A+, crime A-; Watch: health & safety C-, amenities F, commute F.
- Pattonville R-III (suburban): math 32% / reading 46% proficiency, ranked #147 of 324 in MO (top 45%) — families likely to look elsewhere, expect single-tenant / working-renter base with shorter leases.
- Zoned schools: Willow Brook Elem. (math 42% / reading 47%, grade F, #413 of 1,115 statewide, top 42%, 470 students, 40% FRL); Pattonville Sr. High (math 33% / reading 64%, grade D, #147 of 521 statewide, top 29%, 1,893 students, 39% FRL) — zoned schools at 40% FRL track the district average.
- Market conditions: Rents soft (-3.0%/yr); 173 active listings in the ZIP; 11 comparable units currently listed for rent nearby; rentals leasing fast (median 6d on market — plan ~1-2 weeks tenant-placement turnaround); solid renter incomes; 920 units permitted in St. Louis County in 2024 (250 in 5+ unit buildings).
Forward outlook
- In year one you build about $24k of equity ($2k loan paydown + $23k appreciation (10.0% local appreciation)).
- By year 2, paydown + projected appreciation supports a ~$39k cash-out refi (75% LTV) — recoverable capital for the next deal without selling this one.
Negotiation context
- Only 2 days on market — expect competitive offers; lowballing is unlikely to land.
- Current owner paid $162k; 41% above their basis — modest negotiation headroom, anchor on the comps not their cost.
Risks & watch-outs
- Watch-outs: HOA is 24% of rent.
- Climate carrying-cost: extreme-heat days projected 7→21/yr by 2055 (HVAC capex compounding) — expect insurance premiums to compound above CPI over the hold.
Questions for the listing agent
- What do current leases actually rent for vs. the listed asking? Can we see a recent rent roll and the last 12 months of T-12 income?
- What does the HOA fee cover, when was the last increase, and are there any pending special assessments or reserve-fund shortfalls?
- Any open or pending special assessments — roof, HVAC, plumbing, elevator, façade? What's the per-unit balance and payoff schedule, and is the seller paying it off at close or rolling it to the buyer?
- Is there a deadline driving the sale (1031 exchange, divorce, estate, relocation)? That informs how much negotiation room exists.
- Schools are B-rated — typically a magnet for longer-tenancy family renters. What's the average tenant stay here, and is there a school-zone premium baked into asking?
- The area grade is low — what's the realistic commute time and amenity access for the typical tenant pool here? Any planned neighborhood developments (good or bad) we should know about?
- What's the average days-on-market for RENTAL listings here right now (not sales)? A rising rental-DOM trend means longer vacancies and softer asking-rent achievability than the comps imply.
- What's the recent tenant-quality profile in this submarket — average credit score on applications, eviction rate, late-payment / NSF rate, and stable-employment percentage? A property-management company in the area should have these aggregated.
- How much new apartment / multifamily construction is in the pipeline within 1–3 miles? Heavy new supply (>2% of stock underway) typically softens rents 12–24 months out; light construction supports rent growth.
Investment metrics
- 1% rule
- 0.92% ✗
- Cap rate
- 4.65%
- Cash-on-cash
- -5.88%
- DSCR
- 0.74
- GRM
- 9.0
CMA / ARV
No comps found within radius.
Projected returns pro-forma
10.0% appreciation · 0.0% rent growth · sell at horizon
- IRR
- 19.1%
- Equity multiple
- 2.54×
- Total profit
- $98,692
- Equity at exit
- $206,099
- IRR
- 17.0%
- Equity multiple
- 5.62×
- Total profit
- $295,847
- Equity at exit
- $444,460
Cash invested: $64,057 (down + closing). Projections, not guarantees.
Landlord ↔ Tenant lean methodology
- Overall (STATE)
- 81 Strongly Landlord-Friendly
- State Missouri
- 81 Strongly Landlord-Friendly · R+10
- County
- — inherits STATE
- City
- — inherits STATE
ZIP-level market 63146
- Home prices YoY
- 4.9%
- Rents YoY
- -3.0%
- Active inventory
- 173
- Price-to-rent
- 9.0×
Monthly cashflow live
- Estimated rent
- $2,109 high interval (Pro) →
- Mortgage (P&I)
- −$1,200
- Tax from tax record
- −$181 /mo · $2,170/yr
- Insurance
- −$95
- HOA
- −$504
- Vacancy / Maint / Mgmt
- −$443
- Net cashflow
- $-314
Break-even live
Sensitivity live
| Price | -10% $-185 | -5% $-249 | +0% $-314 | +5% $-379 | +10% $-444 |
|---|---|---|---|---|---|
| Rent | -10% $-481 | -5% $-397 | +0% $-314 | +5% $-231 | +10% $-147 |
| Rate | -1.0pp $-199 | -0.5pp $-256 | base $-314 | +0.5pp $-373 | +1.0pp $-434 |
UW: 25.0% down · 7.5% · 30yr · 1.5% tax · 5.0% vac · 8.0% maint · 8.0% mgmt
Financing live
Cash to close
- Down payment
- $57,194
- Closing costs
- $6,863
- Reserves months
- —
- Total cash needed
- —
Loan-product check · same deal, 3 products live
Conventional
25% down · 7.5% · 30yr
- Down + closing
- —
- Monthly P&I
- —
- Monthly cashflow
- —
- DSCR
- —
- Eligible?
- —
Personal DTI + credit; lowest rate.
DSCR
20% down · 8.5% · 30yr
- Down + closing
- —
- Monthly P&I
- —
- Monthly cashflow
- —
- DSCR
- —
- Eligible?
- —
No personal income docs; deal must DSCR.
Hard money
10% down · 12.0% · 12mo
- Down + closing
- —
- Monthly P&I
- —
- Monthly cashflow
- —
- DSCR
- —
- Eligible?
- —
Short-term bridge; refi at stabilization.
Rent comps 11 comps
| Address | Beds | Baths | Sqft | Rent | $/sqft | DOM | Units | Dist |
|---|---|---|---|---|---|---|---|---|
| 11752 Russet Meadow Dr Saint Louis, MO | 3.0 | 2.5 | 1578 | $2,000 | $1.27 | 6d | 1 | 0.18mi |
| 11864 Featherwood Dr Saint Louis, MO | 3.0 | 3.0 | 1460 | $2,600 | $1.78 | 0d | 1 | 0.53mi |
| 1638 Prestonpark Ln Saint Louis, MO | 3.0 | 2.5 | 1734 | $2,610 | $1.51 | 45d | 1 | 1.03mi |
| 1380 Willow Brook Cove Ct St. Louis, MO | 2.0 | 1.5 | 910 | $1,550 | $1.70 | 16d | 1 | 1.09mi |
| 1434 Willow Brook Cove Ct St. Louis, MO | 2.0 | 1.5 | 910 | $1,395 | $1.53 | 45d | 1 | 1.13mi |
| 11164 De Malle Dr Saint Louis, MO | 3.0 | 2.5 | 1146 | $2,475 | $2.16 | 13d | 1 | 1.17mi |
| 12401 Boulder Springs Pkwy St. Louis, MO | 1.0–3.0 | 1.0–2.0 | 1006 | $2,867 | $2.85 | 0d | 10 | 1.19mi |
| 10900 Oak Forest Pkwy Dr St. Louis, MO | 1.0–2.0 | 1.0 | 800 | $1,600 | $2.00 | 0d | 7 | 1.20mi |
| 1895 Boulder Springs Dr St. Louis, MO | 1.0–3.0 | 1.0–2.5 | 1083 | $3,091 | $2.85 | 0d | 6 | 1.27mi |
| 1432 Glenmeade Dr Maryland Heights, MO | 3.0 | 2.0 | 1090 | $2,176 | $2.00 | 12d | 1 | 1.41mi |
| 1145 Mackinac Dr Saint Louis, MO | 4.0 | 2.5 | 1588 | $2,490 | $1.57 | 0d | 1 | 1.43mi |
HOA detail condo
- Monthly dues
- $504 · $6,048/yr
- Assessments
- None detected in remarks — confirm with the listing agent.
Listing history 10 events
-
2026-04-19status Pending
-
2026-04-17$228,775 Active
-
2026-04-15historical $228,775
-
2006-02-15soldstatus
-
2005-09-29soldstatus $162,000
-
2003-11-04soldstatus $149,500
-
2002-10-09soldstatus $129,900
-
1995-01-13soldstatus $85,960
-
1982-03-01soldstatus $85,498
-
1982-03-01soldstatus
ⓘ Source: listings_history table (triggers on properties + properties_extension) + one-shot
backfill from property_details.listing_events for pre-trigger history.
Tax reassessment forecast MO · Resets to sale price
- Current annual tax
- $2,170 · $181/mo
- Projected year-2 tax
- $2,219 · $185/mo
- Expected delta
- +$49/yr (+$4/mo · 2.3%)
ⓘ Screening estimate from a state-policy table — verify with the county assessor before closing.
Climate risk First Street
- Flood 1/10 Low FEMA zone X (unshaded) · 0% chance over 30 yrs
- Wildfire 1/10 Low
- Heat 5/10 Major 7 d/yr ≥107°F today · 21 d/yr by 30 yrs out
- Wind 2/10 Low 100% chance of damaging wind over 30 yrs
- Air quality 2/10 Low 1 unhealthy d/yr today · 3 by 30 yrs out
Nearby sold comps map
Loading sold comps map…
Walkable amenities ~0.75 mi
Loading nearby amenities…
Taxation est. · year 1
- Rental income
- $25,304
- − Mortgage interest
- −$12,815
- − Property taxes
- −$2,170
- − Insurance
- −$1,144
- − Repairs & maintenance
- −$2,024
- − Management
- −$2,024
- − HOA
- −$6,048
- − Depreciation
- −$6,655
- Taxable loss
- −$7,577
- Est. tax savings @ 24.0%
- +$1,818
- After-tax cash flow
- $-1,950/yr
For passive investors: Depreciation is non-cash, so a rental often shows a tax loss while cash-flowing — sheltering income. Rental losses are passive: they offset passive income freely, and up to $25,000/yr can offset ordinary (W-2) income if you actively participate and your MAGI is under $100k (phasing out to $0 by $150k); unused losses carry forward. On sale, claimed depreciation is recaptured at up to 25%, and gains may owe capital-gains tax (a 1031 exchange can defer both). Figures are a year-1 estimate at your 24.0% rate — not tax advice; consult a CPA.
Schools (NCES district)
- District
- Pattonville R-III
- NCES district ID
- 2923700
- Math proficiency
- 32% ▼ -11.00%
- Reading proficiency
- 46% ▼ -5.00%
- Median HH income
- $50,786
- Composite
- 33.69/100
- National rank
- #5383
- State rank
- #147 of 324 in MO
Livability — Maryland Heights
- Score
- 71/100
- State rank
- #101
- US rank
- #6808
Category grades
Schools grade is shown separately in the Schools card above.
Census & demographics
- County
- Saint Louis County · 888,823 people
- City population
- 21,924
- Metro
- St. Louis, MO-IL
- Population (ZIP)
- 30,678
- Household income
- $84,756
- Rent vs Own
- Severe rent burden
- 1156.0
Population outlook (St. Louis County) Hauer SSP2
- Today (2025)
- 1,025,227 people
- By 2030
- 1,028,023 · +0.3%
- By 2040
- 1,020,940 · -0.4%
- By 2050
- 1,007,280 · -1.8%
- By 2075
- 987,277 · -3.7%
- By 2100
- 921,984 · -10.1%
Race, ethnicity, and origin ACS 2023
- Neighborhood character
- Diverse neighborhood (Simpson 0.56)
- Race & ethnicity
- White 63% Asian 17% Black 13% Two or more races 4% Hispanic / Latino 3%
- Common ancestry
- Scotch-Irish 3% Romanian 3% Italian 2%
- Foreign-born
- 19% · China, South Korea, Canada
- Languages at home
- 79% English-only · Other Asian/Pacific 7% Other Indo-European 4% Chinese 3%
Political lean MEDSL · St. Louis
- 2024 margin
- Strong D (+23.4) · D 60.8% · R 37.4% · Other 1.7%
- 2008→2024 swing
- +3.5pp toward D · 2008: 19.9pp · 2024: 23.4pp
- All cycles
- 2024: D+23.4 2020: D+24.0 2016: D+16.2 2012: D+13.7 2008: D+19.9
Not yet ingested
- Civics
- —
Market trends
- HPI YoY
- ▲ 33.10%
- Current HPI
- 711.49
- Rent YoY
- ▼ -2.96%
- Metro
- St. Louis, MO-IL
- State GDP YoY
- ▲ 1.84%
- F500 in state
- 20
Industry mix (Fortune 500 HQ in MO)
| Industry | F500 HQs | Revenue |
|---|---|---|
| Healthcare | 1 | $163B |
|
||
| Insurance | 1 | $21B |
|
||
| Industrial Technology | 1 | $17B |
|
||
| Retail | 1 | $16B |
|
||
| Industrial Distribution | 1 | $10B |
|
||
| Utilities | 1 | $9B |
|
||
Price history
+167.6% since first listed10 events — show timeline
- 2026-04-19 Pending — MARIS as Distributed by MLS Grid
- 2026-04-17 Listed $228,775 MARIS as Distributed by MLS Grid
- 2026-04-15 Coming Soon $228,775 MARIS as Distributed by MLS Grid
- 2006-02-15 Sold (Public Records) — Public Records
- 2005-09-29 Sold (Public Records) $162,000 Public Records
- 2003-11-04 Sold (Public Records) $149,500 Public Records
- 2002-10-09 Sold (Public Records) $129,900 Public Records
- 1995-01-13 Sold (Public Records) $85,960 Public Records
- 1982-03-01 Sold (Public Records) — Public Records
- 1982-03-01 Sold (Public Records) $85,498 Public Records
Property tax history
+2.4%/yrLatest (2022): $2,170 · +0.5% YoY. Source: county tax records.
Cash-flow waterfall
monthlySold comps — $/sqft
last 12 mo · ≤1 miLoading sold comps…