33-43 14 St Unit 14D · New York, NY
Flood risk 1/10 · Minimal
- FEMA flood zone
- X (unshaded)
- Chance of flooding over 30 yrs
- 0.0%
- Est. flood insurance / yr
- $507 – $1,088
Fire risk 1/10 · Minimal
- Est. fire insurance / yr
- $691 – $1,283
Heat risk 6/10 · Moderate
- Hot days now (above 99°F)
- 7 days/yr
- Hot days in 30 yrs
- 15 days/yr
Wind risk 6/10 · Moderate
- Chance of severe wind over 30 yrs
- 27.0%
Air-quality risk 4/10 · Minor
- Unhealthy air days now
- 5 days/yr
- Unhealthy air days in 30 yrs
- 6 days/yr
Risk factors via First Street. Map © Google.
Why this score? — see what drove the C+ grade
The composite is a weighted blend of 9 inputs, each scored 0–100. Each bar is that input's sub-score; the figure is the points it added to the 100-point composite (weight × sub-score).
- Cash flow +22.3/30.0
- ARV discount +7.5/15.0
- DSCR +7.1/10.0
- Appreciation +6.0/10.0
- 1% rule +5.8/10.0
- Schools +5.0/10.0
- Rent growth +4.3/5.0
- Livability +3.8/5.0
- Condition / age +2.5/5.0
$540,000
🖨 Deal sheet (PDF) 📄 Offer letter ✓ Due diligence
Listing remarks
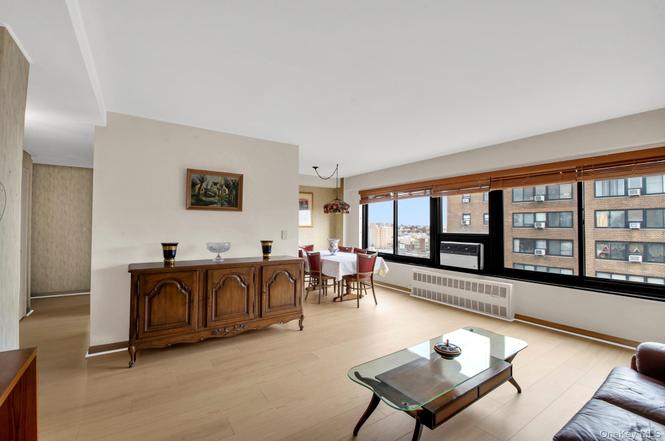
Perched on a high floor, with new floors just installed, this bright 2-bedroom residence expansive exposures of Manhattan and western Queens. The spacious LR and open dining area are framed by a wall of oversized, sliding glass windows that span the full length of both rooms - perfect for soaking in morning light and capturing skyline views. The fully-equipped galley kitchen shares the same views, creating a seamless flow for cooking, dining, and entertaining. Both generously sized bedrooms accommodate king-size beds and offer impressive views of the RFK Bridge and beyond. The full-size bathroom is decorated with a white pedestal sink, large vanity mirrors and tiled flooring. Storage is inc
Key facts
- Landscaped grounds
- Central laundry room
- Built 1958
Tags
Property features AI
Finance
- HOA & community: Association: North Queensview Homes; Pets permitted (call for details; cats and dogs allowed)
Exterior
- Parking: Off-street parking (monthly fee applies)
- Utilities: Public sewer; Cable available; Public trash collection; Water connected
- Home design: Stock cooperative; 14-story building
- Construction: Brick construction
- Exterior features: Brick construction; Landscaped; Paved areas; Not waterfront
Interior
- Kitchen: Dishwasher; Gas oven; Refrigerator
- Bedrooms: Total rooms: 5
- Bathrooms: 1 full bathroom
- Heating & cooling: Steam heating; Wall/window air conditioning unit(s)
- Interior features: Entrance foyer; Galley-style kitchen; Walk-in closet(s)
Neighborhood map
What this means for you Summary
Snapshot
- This is a 2-bed/1.0-bath single-family listed at $540k.
Deal economics
- At list price, monthly cash flow is $890 ($11k/yr) — positive.
- The deal already cash-flows at list — no discount required.
- Meets the 1% rule at list price ($6k rent vs $540k).
- Recommended offer: $475k (12.0% below list) — sets the bar for market timing.
- Cap rate 8.3% vs local median 2.6% in New York — top-decile yield for the area; either an underpriced asset or a hidden risk that comps aren't pricing in. Stress-test before assuming the spread holds.
Location & tenants
- Location reads 75/100 on livability (#268 in NY, #4,188 nationally) — a middle-class / working-renter tenant base. Strengths: amenities A+, commute A+, health & safety A; Watch: crime F, cost of living F.
- Zoned schools: Elm Tree Elementary School (math 27% / reading 52%, grade F, #1,444 of 2,108 statewide, top 71%, 806 students, 94% FRL); Is 227 Louis Armstrong (math 52% / reading 69%, grade B+, #153 of 729 statewide, top 21%, 1,528 students, 68% FRL); Midwood High School (math 94% / reading 96%, grade A+, #83 of 1,100 statewide, top 8%, 4,062 students, 73% FRL).
- Market conditions: Rents rising fast (+7.3%/yr); 109 active listings in the ZIP; 40 comparable units currently listed for rent nearby; rentals at typical pace (median 22d on market — plan ~3-4 weeks tenant-placement turnaround); solid renter incomes; 5,302 units permitted in Queens County in 2024 (4,918 in 5+ unit buildings).
- At $5,851/mo this rent would consume 83% of the median local household income ($85k/yr) (locally 3679% of renters already pay >50% of income on rent) — very limited rent-growth headroom before tenants either downsize or default.
Forward outlook
- In year one you build about $15k of equity ($4k loan paydown + $11k appreciation (2.1% local appreciation)).
- Queens County population projected at +16% by 2050 — long-run rental-demand tailwind backs the buy-and-hold thesis.
- At projected returns (2.1% appreciation + 7.3% rent growth), your $151k cash investment doubles in ~5 years — after that, you're playing with house money.
- By year 3, paydown + projected appreciation supports a ~$38k cash-out refi (75% LTV) — recoverable capital for the next deal without selling this one.
Negotiation context
- It's been on market 177 days — a 12% lower offer ($475k) is reasonable based on typical stale-listing flexibility.
- 3 sale attempts with the ask held roughly flat each time — persistent listings suggest the price (not the market) is what's stuck; bring a comps-based counter.
Risks & watch-outs
- Watch-outs: built in 1958 — expect roof / HVAC / electrical / plumbing capex.
- Climate carrying-cost: major wind risk, 27% chance of damaging wind over 30y; extreme-heat days projected 7→15/yr by 2055 (HVAC capex compounding) — expect insurance premiums to compound above CPI over the hold.
Questions for the listing agent
- It's been on market 177 days. Have you received any prior offers? Is the seller open to a 12% concession, seller financing, or rate buy-down credit?
- Built in 1958 — when were the roof, HVAC, electrical panel, plumbing, and water heater last replaced?
- Why hasn't it sold? Are there any deal-killer items the seller is aware of (foundation, flood, title, zoning, code violations)?
- Is there a deadline driving the sale (1031 exchange, divorce, estate, relocation)? That informs how much negotiation room exists.
- Schools are B-rated — typically a magnet for longer-tenancy family renters. What's the average tenant stay here, and is there a school-zone premium baked into asking?
- Crime grade is F in this area — have there been break-ins, vandalism, or insurance claims at this property in the last 3 years? What carrier currently insures it and at what premium?
- What's the average days-on-market for RENTAL listings here right now (not sales)? A rising rental-DOM trend means longer vacancies and softer asking-rent achievability than the comps imply.
- What's the recent tenant-quality profile in this submarket — average credit score on applications, eviction rate, late-payment / NSF rate, and stable-employment percentage? A property-management company in the area should have these aggregated.
- How much new for-sale + rental construction is in the pipeline within 1–3 miles? Heavy new supply typically softens prices + rents 12–24 months out; constrained supply supports both.
Investment metrics
- 1% rule
- 1.08% ✓
- Cap rate
- 8.27%
- Cash-on-cash
- 7.07%
- DSCR
- 1.31
- GRM
- 7.7
CMA / ARV
No comps found within radius.
Projected returns pro-forma
2.06% appreciation · 7.28% rent growth · sell at horizon
- IRR
- 14.5%
- Equity multiple
- 1.81×
- Total profit
- $121,874
- Equity at exit
- $214,870
- IRR
- 19.4%
- Equity multiple
- 3.88×
- Total profit
- $435,681
- Equity at exit
- $310,866
Cash invested: $151,200 (down + closing). Projections, not guarantees.
Landlord ↔ Tenant lean methodology
- Overall (CITY)
- 0 Strongly Tenant-Friendly
- State New York
- 15 Strongly Tenant-Friendly · D+10
- County
- — inherits STATE
- City New York
- 0 Strongly Tenant-Friendly · D+34
ZIP-level market 11106
- Home prices YoY
- 0.6%
- Rents YoY
- 7.3%
- Active inventory
- 109
- Price-to-rent
- 7.7×
Monthly cashflow live
- Estimated rent
- $5,851 high interval (Pro) →
- Mortgage (P&I)
- −$2,832
- Tax est. 1.5%
- −$675 /mo · $8,100/yr
- Insurance
- −$225
- HOA
- −$0
- Vacancy / Maint / Mgmt
- −$1,229
- Net cashflow
- $890
Break-even live
Sensitivity live
| Price | -10% $1,264 | -5% $1,077 | +0% $890 | +5% $704 | +10% $517 |
|---|---|---|---|---|---|
| Rent | -10% $428 | -5% $659 | +0% $890 | +5% $1,122 | +10% $1,353 |
| Rate | -1.0pp $1,162 | -0.5pp $1,028 | base $890 | +0.5pp $751 | +1.0pp $608 |
UW: 25.0% down · 7.5% · 30yr · 1.5% tax · 5.0% vac · 8.0% maint · 8.0% mgmt
Financing live
Cash to close
- Down payment
- $135,000
- Closing costs
- $16,200
- Reserves months
- —
- Total cash needed
- —
Loan-product check · same deal, 3 products live
Conventional
25% down · 7.5% · 30yr
- Down + closing
- —
- Monthly P&I
- —
- Monthly cashflow
- —
- DSCR
- —
- Eligible?
- —
Personal DTI + credit; lowest rate.
DSCR
20% down · 8.5% · 30yr
- Down + closing
- —
- Monthly P&I
- —
- Monthly cashflow
- —
- DSCR
- —
- Eligible?
- —
No personal income docs; deal must DSCR.
Hard money
10% down · 12.0% · 12mo
- Down + closing
- —
- Monthly P&I
- —
- Monthly cashflow
- —
- DSCR
- —
- Eligible?
- —
Short-term bridge; refi at stabilization.
Rent comps 40 comps
| Address | Beds | Baths | Sqft | Rent | $/sqft | DOM | Units | Dist |
|---|---|---|---|---|---|---|---|---|
| 888 Main St New York, NY | 3.0 | 1.0–2.0 | 908 | $6,151 | $6.77 | 1d | 8 | 0.61mi |
| 3705 30th St Long Island City, NY | 2.0 | 1.0–2.0 | 700 | $6,180 | $8.83 | 12d | 3 | 0.63mi |
| 1420 27th Ave Astoria, NY | 1.0–2.0 | 1.0–2.0 | 887 | $4,899 | $5.52 | 5d | 9 | 0.67mi |
| 515 E 72nd St Unit 17D New York, NY | 1.0 | 1.0 | 687 | $5,500 | $8.01 | 26d | 1 | 1.00mi |
| 501 1/2 E 83rd St #1998 New York, NY | 2.0 | 1.0 | 525 | $5,580 | $10.63 | 26d | 2 | 1.00mi |
| 501 E 74th St #1572 New York, NY | 2.0 | 2.0 | 1000 | $10,210 | $10.21 | 22d | 1 | 1.02mi |
| 435 E 79th St New York, NY | 1.0–3.0 | 1.0–2.0 | 943 | $7,500 | $7.95 | 9d | 3 | 1.03mi |
| 515 E 86th St Unit 589 New York, NY | 1.0 | 1.0 | 695 | $6,070 | $8.73 | 21d | 1 | 1.05mi |
| 1567 York Ave Unit 1021866P New York, NY | 2.0 | 1.0 | 742 | $5,910 | $7.96 | 23d | 1 | 1.05mi |
| 420 E 80th St #198 New York, NY | 1.0 | 1.0 | 623 | $4,760 | $7.64 | 20d | 1 | 1.06mi |
| 34-35 44th St Astoria, NY | 1.0–2.0 | 1.0–2.0 | 613 | $5,794 | $9.45 | 0d | 23 | 1.07mi |
| 501 E 87th St #2094 New York, NY | 1.0 | 1.0 | 618 | $7,050 | $11.41 | 1d | 2 | 1.09mi |
| 404 E 76th St Unit 19C New York, NY | 2.0 | 2.0 | 1100 | $7,500 | $6.82 | 26d | 1 | 1.12mi |
| 404 E 76th St New York, NY | 1.0–2.0 | 1.0–2.0 | 1001 | $7,500 | $7.49 | 5d | 2 | 1.13mi |
| 435 E 86th St Unit 2001 New York, NY | 1.0 | 1.0 | 800 | $5,480 | $6.85 | 26d | 1 | 1.15mi |
| 1373 1st Ave Unit 1952 New York, NY | 2.0 | 2.0 | 650 | $7,260 | $11.17 | 26d | 1 | 1.17mi |
| 347 E 78th St Unit 1530420P New York, NY | 2.0 | 1.0 | 645 | $6,270 | $9.72 | 23d | 1 | 1.18mi |
| 347 E 78th St Unit 1460467P New York, NY | 2.0 | 1.0 | 645 | $7,606 | $11.79 | 26d | 1 | 1.18mi |
| 885 Main St Unit 6B New York, NY | 2.0 | 2.0 | 950 | $5,300 | $5.58 | 1d | 1 | 1.20mi |
| 885 Main St #705 New York, NY | 2.0 | 2.0 | 1100 | $4,800 | $4.36 | 0d | 1 | 1.20mi |
| 403 E 69th St #1518 New York, NY | 1.0–3.0 | 1.0 | 745 | $6,748 | $9.06 | 26d | 3 | 1.20mi |
| 411 E 68th St Unit 1021976P New York, NY | 2.0 | 1.0 | 893 | $6,792 | $7.61 | 23d | 1 | 1.22mi |
| 1290 1st Ave #1499 New York, NY | 2.0 | 1.0 | 671 | $6,100 | $9.09 | 4d | 2 | 1.22mi |
| 315 E 78th St Unit 1021894P New York, NY | 1.0 | 1.0 | 548 | $5,643 | $10.30 | 23d | 1 | 1.23mi |
| 3 Court Sq W #907 Long Island City, NY | 2.0 | 2.0 | 930 | $6,300 | $6.77 | 26d | 1 | 1.24mi |
| 308 E 78th St #2024 New York, NY | 1.0–2.0 | 1.0 | 550 | $5,340 | $9.71 | 26d | 2 | 1.24mi |
| 301 E 79th St Unit 28P New York, NY | 1.0 | 1.0 | 700 | $5,500 | $7.86 | 26d | 1 | 1.25mi |
| 2719 44th Dr Long Island City, NY | 1.0 | 1.0 | 628 | $4,945 | $7.87 | 9d | 2 | 1.26mi |
| 400 E 66th St Unit 1016404P New York, NY | 1.0–2.0 | 1.0–2.0 | 791 | $17,070 | $21.58 | 5d | 2 | 1.29mi |
| 315 E 86th St Unit 1327 New York, NY | 1.0 | 2.0 | 726 | $6,460 | $8.90 | 26d | 1 | 1.30mi |
| 305 E 86th St New York, NY | 1.0–3.0 | 1.0–2.0 | 820 | $8,885 | $10.83 | 26d | 10 | 1.31mi |
| 354 E 91st St #648 New York, NY | 1.0–2.0 | 1.0 | 692 | $6,850 | $9.89 | 1d | 2 | 1.32mi |
| 231 E 76th St #1530 New York, NY | 1.0 | 1.0 | 650 | $6,470 | $9.95 | 22d | 1 | 1.32mi |
| 360 E 65th St #1283 New York, NY | 1.0–3.0 | 1.0–2.0 | 1059 | $6,815 | $6.44 | 5d | 3 | 1.34mi |
| 300 E 69th St Unit 1294661P New York, NY | 2.0 | 1.0 | 839 | $6,870 | $8.19 | 21d | 1 | 1.35mi |
| 1310 2nd Ave Unit 1224958P New York, NY | 1.0–2.0 | 1.0 | 699 | $8,460 | $12.10 | 3d | 2 | 1.36mi |
| 244 E 86th St #604 New York, NY | 1.0–2.0 | 1.0–2.0 | 950 | $9,640 | $10.15 | 5d | 2 | 1.36mi |
| 403 E 62nd St Unit 14C New York, NY | 1.0 | 1.0 | 650 | $4,900 | $7.54 | 23d | 1 | 1.37mi |
| 200 E 82nd St #505 New York, NY | 2.0 | 1.0 | 636 | $7,960 | $12.51 | 3d | 3 | 1.40mi |
| 235 E 89th St Unit 1495783P New York, NY | 2.0 | 1.0 | 699 | $7,443 | $10.65 | 22d | 1 | 1.41mi |
Listing history 7 events
-
2026-04-10status Pending
-
2026-03-29status Active
-
2026-03-07historical
-
2025-12-17price $540,000
-
2025-12-17price $540,000
-
2025-09-24$550,000 Active
-
2025-09-24$550,000 Active
ⓘ Source: listings_history table (triggers on properties + properties_extension) + one-shot
backfill from property_details.listing_events for pre-trigger history.
Climate risk First Street
- Flood 1/10 Low FEMA zone X (unshaded) · 0% chance over 30 yrs
- Wildfire 1/10 Low
- Heat 6/10 Major 7 d/yr ≥99°F today · 15 d/yr by 30 yrs out
- Wind 6/10 Major 27% chance of damaging wind over 30 yrs
- Air quality 4/10 Moderate 5 unhealthy d/yr today · 6 by 30 yrs out
Nearby sold comps map
Loading sold comps map…
Walkable amenities ~0.75 mi
Loading nearby amenities…
Taxation est. · year 1
- Rental income
- $70,212
- − Mortgage interest
- −$30,248
- − Property taxes
- −$8,100
- − Insurance
- −$2,700
- − Repairs & maintenance
- −$5,617
- − Management
- −$5,617
- − Depreciation
- −$15,709
- Taxable income
- $2,220
- Est. tax owed @ 24.0%
- −$533
- After-tax cash flow
- $10,153/yr
For passive investors: Depreciation is non-cash, so a rental often shows a tax loss while cash-flowing — sheltering income. Rental losses are passive: they offset passive income freely, and up to $25,000/yr can offset ordinary (W-2) income if you actively participate and your MAGI is under $100k (phasing out to $0 by $150k); unused losses carry forward. On sale, claimed depreciation is recaptured at up to 25%, and gains may owe capital-gains tax (a 1031 exchange can defer both). Figures are a year-1 estimate at your 24.0% rate — not tax advice; consult a CPA.
Schools (NCES district)
No district data.
Livability — New York
- Score
- 75/100
- State rank
- #268
- US rank
- #4188
Category grades
Schools grade is shown separately in the Schools card above.
Census & demographics
- Census place
- New York, NY
- County
- Queens County · 1,914,869 people
- City population
- 7,731,280
- Metro
- New York-Newark-Jersey City, NY-NJ-PA
- Population (ZIP)
- 40,930
- Household income
- $84,867
- Rent vs Own
- Severe rent burden
- 3679.0
Population outlook (Queens County) Hauer SSP2
- Today (2025)
- 2,546,320 people
- By 2030
- 2,643,059 · +3.8%
- By 2040
- 2,815,563 · +10.6%
- By 2050
- 2,944,423 · +15.6%
- By 2075
- 3,123,338 · +22.7%
- By 2100
- 3,098,688 · +21.7%
Race, ethnicity, and origin ACS 2023
- Neighborhood character
- Highly diverse neighborhood (Simpson 0.71)
- Race & ethnicity
- White 42% Hispanic / Latino 27% Asian 19% Two or more races 12% Black 7% Native American 1%
- Hispanic origin (detail)
- Mexican 7% Puerto Rican 6% Dominican 4%
- Common ancestry
- Scotch-Irish 3% Romanian 3% Estonian 2%
- Foreign-born
- 39% · Canada, Jamaica, China
- Languages at home
- 48% English-only · Spanish 22% Other Indo-European 13% Russian/Polish/Slavic 4%
Political lean MEDSL · Queens
- 2024 margin
- Strong D (+24.6) · D 62.3% · R 37.7%
- 2008→2024 swing
- -26.2pp toward R · 2008: 50.8pp · 2024: 24.6pp
- All cycles
- 2024: D+24.6 2020: D+45.2 2016: D+53.4 2012: D+58.5 2008: D+50.8
Not yet ingested
- Civics
- —
Market trends
- HPI YoY
- ▲ 2.06%
- Current HPI
- 348.3009
- Rent YoY
- ▲ 7.28%
- Metro
- New York-Newark-Jersey City, NY-NJ-PA
- State GDP YoY
- ▲ 2.60%
- F500 in state
- 92
Industry mix (Fortune 500 HQ in NY)
| Industry | F500 HQs | Revenue |
|---|---|---|
| Financial Services | 10 | $950B |
|
||
| Consumer Goods | 9 | $162B |
|
||
| Insurance | 4 | $225B |
|
||
| Telecommunications | 2 | $144B |
|
||
| Pharmaceuticals | 2 | $112B |
|
||
| Media / Entertainment | 2 | $69B |
|
||
Price history
-1.8% since first listed7 events — show timeline
- 2026-04-10 Pending — OneKey® MLS as Distributed by MLS Grid
- 2026-03-29 Relisted — OneKey® MLS as Distributed by MLS Grid
- 2026-03-07 Listing Removed — OneKey® MLS as Distributed by MLS Grid
- 2025-12-17 Price Changed $540,000 RLS at REBNY
- 2025-12-17 Price Changed $540,000 OneKey® MLS as Distributed by MLS Grid
- 2025-09-24 Listed $550,000 OneKey® MLS as Distributed by MLS Grid
- 2025-09-24 Listed $550,000 RLS at REBNY
Cash-flow waterfall
monthlySold comps — $/sqft
last 12 mo · ≤1 miLoading sold comps…