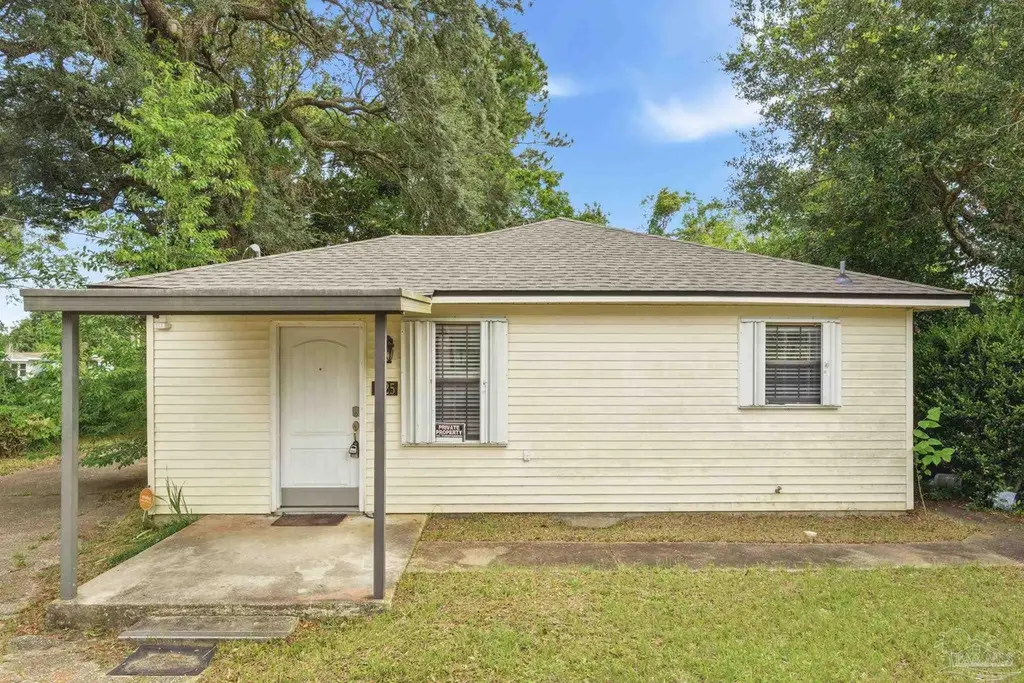
1125 W Scott St · Goulding, FL
Flood risk 1/10 · Minimal
- FEMA flood zone
- X (unshaded)
- Chance of flooding over 30 yrs
- 0.0%
- Est. flood insurance / yr
- $507 – $1,088
Fire risk 1/10 · Minimal
- Est. fire insurance / yr
- $947 – $1,759
Heat risk 10/10 · Severe
- Hot days now (above 105°F)
- 7 days/yr
- Hot days in 30 yrs
- 20 days/yr
Wind risk 9/10 · Severe
- Chance of severe wind over 30 yrs
- 99.0%
Air-quality risk 2/10 · Minimal
- Unhealthy air days now
- 0 days/yr
- Unhealthy air days in 30 yrs
- 1 days/yr
Risk factors via First Street. Map © Google.
Why this score? — see what drove the B grade
The composite is a weighted blend of 9 inputs, each scored 0–100. Each bar is that input's sub-score; the figure is the points it added to the 100-point composite (weight × sub-score).
- Cash flow +30.0/30.0
- 1% rule +10.0/10.0
- DSCR +10.0/10.0
- ARV discount +7.5/15.0
- Rent growth +3.9/5.0
- Livability +3.7/5.0
- Schools +3.6/10.0
- Condition / age +2.5/5.0
- Appreciation +0.0/10.0
$97,500
🖨 Deal sheet 📄 Offer letter ✓ Due diligence
Listing remarks
* Highest and Best by 12pm Monday * Charming patio home in Pensacola featuring an open-concept kitchen and living room area, perfect for entertaining and everyday living. This cozy home offers 3 bedrooms and 1 full bathroom with a functional layout and comfortable living spaces. Conveniently located on Scott St. , close to shopping, dining, schools, and local amenities. Great opportunity for first-time buyers, down-sizers, or investors! * Buyers to verify room dimensions, gross living area, tax, HOA and also school info. *
Key facts
- Close to schools
- Open-concept kitchen
- Living room area
Tags
Property features AI
Finance
- Other: Lot approximately 0.19 acres; Directions: Turn right on North L St. and take Scott St.; home will be on the left.
- HOA & community: No homeowners association
Exterior
- Parking: Driveway with open parking
- Utilities: Public water; Public sewer; Electric service with circuit breakers
- Home design: Single-story (one level); Resale property; Not attached to other units
- Construction: Frame construction; Slab foundation; Built area approximately 1,185 square feet
- Exterior features: Composition roof; Paved public/ county-maintained road access; No horses allowed
Interior
- Kitchen: Kitchen on the first level, approximately 15' x 12'; Electric water heater
- Bedrooms: Master bedroom on the first level, approximately 14' x 13'
- Flooring: Tile
- Bathrooms: 1 full bathroom
- Heating & cooling: Central air; Ceiling fans; Natural gas heating
- Interior features: Tile flooring; Living/dining combo
- Laundry & utility: Circuit breaker electrical panel
Neighborhood map
What this means for you Summary
Snapshot
- This is a 3-bed/2.0-bath single-family listed at $98k.
Deal economics
- At list price, monthly cash flow is $781 ($9k/yr) — positive.
- The deal already cash-flows at list — no discount required.
- Meets the 1% rule at list price ($2k rent vs $98k).
Location & tenants
- Location reads 73/100 on livability (#296 in FL) — a middle-class / working-renter tenant base. Strengths: cost of living A+, health & safety A+, housing A; Watch: amenities F, commute F, employment F.
- Escambia (suburban): math 40% / reading 45% proficiency, ranked #56 of 73 in FL (top 77%) — families likely to look elsewhere, expect single-tenant / working-renter base with shorter leases.
- Market conditions: Rents rising fast (+5.4%/yr); 127 active listings in the ZIP; 20 comparable units currently listed for rent nearby; rentals at typical pace (median 24d on market — plan ~3-4 weeks tenant-placement turnaround); lower-income renter base — watch delinquency; 1,479 units permitted in Escambia County in 2024 (0 in 5+ unit buildings).
- At $1,819/mo this rent would consume 49% of the median local household income ($44k/yr) (locally 816% of renters already pay >50% of income on rent) — very limited rent-growth headroom before tenants either downsize or default.
Forward outlook
- Local home prices are declining (-3.0%/yr); year-one equity from $674 of loan paydown is wiped out by about $3k of value loss. Plan a longer hold.
- Escambia County population projected at +13% by 2050 — modest demand growth; plan on rents tracking national, not racing it.
- At projected returns (-3.0% appreciation + 5.4% rent growth), your $27k cash investment doubles in ~4 years — after that, you're playing with house money.
Negotiation context
- Only 10 days on market — expect competitive offers; lowballing is unlikely to land.
- 4 sale attempts since 18y ago with the ask held roughly flat each time — persistent listings suggest the price (not the market) is what's stuck; bring a comps-based counter.
Risks & watch-outs
- Climate carrying-cost: severe wind risk, 99% chance of damaging wind over 30y; extreme-heat days projected 7→20/yr by 2055 (HVAC capex compounding) — expect insurance premiums to compound above CPI over the hold.
Questions for the listing agent
- Is there a deadline driving the sale (1031 exchange, divorce, estate, relocation)? That informs how much negotiation room exists.
- Schools are A-rated — typically a magnet for longer-tenancy family renters. What's the average tenant stay here, and is there a school-zone premium baked into asking?
- What's the average days-on-market for RENTAL listings here right now (not sales)? A rising rental-DOM trend means longer vacancies and softer asking-rent achievability than the comps imply.
- What's the recent tenant-quality profile in this submarket — average credit score on applications, eviction rate, late-payment / NSF rate, and stable-employment percentage? A property-management company in the area should have these aggregated.
- How much new for-sale + rental construction is in the pipeline within 1–3 miles? Heavy new supply typically softens prices + rents 12–24 months out; constrained supply supports both.
Investment metrics
- 1% rule
- 1.87% ✓
- Cap rate
- 15.91%
- Cash-on-cash
- 34.33%
- DSCR
- 2.53
- GRM
- 4.5
CMA / ARV
- ARV (on-the-fly)
- $214,600
- Comps found
- 12
Show comp detail 12 sales within ~0.75 mi
| Address | Dist | Beds/Ba | Sqft | Sold | Price | $/sf | Match |
|---|---|---|---|---|---|---|---|
| 2363 N F St | 0.11mi | 3/2.0 | 1,196 (+3%) | 1mo | $235,000 | $196 | 89 |
| 2704 N H St | 0.16mi | 3/2.0 | 1,178 (+2%) | 7mo | $209,000 | $177 | 84 |
| 1002 W Yonge St | 0.06mi | 4/2.0 (+1) | 1,218 (+5%) | 2mo | $205,000 | $168 | 82 |
| 620 W Hernandez | 0.44mi | 3/1.0 | 1,180 (+2%) | 3mo | $150,000 | $127 | 70 |
| 821 W Hernandez St | 0.38mi | 2/1.5 (-1) | 1,170 (+1%) | 7mo | $217,000 | $185 | 67 |
| 2419 N L St | 0.33mi | 3/2.0 | 1,285 (+11%) | 2mo | $247,000 | $192 | 64 |
| 621 W Hernandez St | 0.46mi | 4/1.0 (+1) | 1,200 (+3%) | 2mo | $90,000 | $75 | 62 |
| 831 W Mallory St | 0.57mi | 3/1.0 | 1,138 (-2%) | 11mo | $260,000 | $228 | 57 |
| 2412 N Q St | 0.64mi | 3/2.0 | 1,056 (-9%) | 10mo | $153,000 | $145 | 47 |
| 1918 W Maxwell St | 0.46mi | 4/2.0 (+1) | 1,299 (+12%) | 8mo | $152,000 | $117 | 47 |
| 1316 1/2 E Baars St | 0.71mi | 3/1.0 | 989 (-15%) | 1mo | $300,000 | $303 | 37 |
| 120 W Lakeview Ave | 0.69mi | 3/1.0 | 1,330 (+15%) | 4mo | $290,000 | $218 | 36 |
Match score weights: distance 35% · size 25% · config 20% · recency 20%. Top-matched comps best support the ARV.
Projected returns pro-forma
-3.0% appreciation · 5.4% rent growth · sell at horizon
- IRR
- 32.4%
- Equity multiple
- 2.41×
- Total profit
- $38,463
- Equity at exit
- $14,538
- IRR
- 40.8%
- Equity multiple
- 5.29×
- Total profit
- $117,004
- Equity at exit
- $8,430
Cash invested: $27,300 (down + closing). Projections, not guarantees.
Landlord ↔ Tenant lean methodology
- Overall (STATE)
- 87 Strongly Landlord-Friendly
- State Florida
- 87 Strongly Landlord-Friendly · R+3
- County
- — inherits STATE
- City
- — inherits STATE
ZIP-level market 32501
- Rents YoY
- 5.4%
- Active inventory
- 127
- Price-to-rent
- 4.5×
Monthly cashflow live
- Estimated rent
- $1,819 high interval (Pro) →
- Mortgage (P&I)
- −$511
- Tax from tax record
- −$104 /mo · $1,247/yr
- Insurance
- −$41
- HOA
- −$0
- Vacancy / Maint / Mgmt
- −$382
- Net cashflow
- $781
Break-even live
UW: 25.0% down · 7.5% · 30yr · 1.5% tax · 5.0% vac · 8.0% maint · 8.0% mgmt
Financing live
Cash to close
- Down payment
- $24,375
- Closing costs
- $2,925
- Reserves months
- —
- Total cash needed
- —
Loan-product check · same deal, 3 products live
Conventional
25% down · 7.5% · 30yr
- Down + closing
- —
- Monthly P&I
- —
- Monthly cashflow
- —
- DSCR
- —
- Eligible?
- —
Personal DTI + credit; lowest rate.
DSCR
20% down · 8.5% · 30yr
- Down + closing
- —
- Monthly P&I
- —
- Monthly cashflow
- —
- DSCR
- —
- Eligible?
- —
No personal income docs; deal must DSCR.
Hard money
10% down · 12.0% · 12mo
- Down + closing
- —
- Monthly P&I
- —
- Monthly cashflow
- —
- DSCR
- —
- Eligible?
- —
Short-term bridge; refi at stabilization.
Rent comps 20 comps
| Address | Beds | Baths | Sqft | Rent | $/sqft | DOM | Units | Dist |
|---|---|---|---|---|---|---|---|---|
| 721 W Jordan St Pensacola, FL | 3.0 | 2.0 | 1030 | $1,895 | $1.84 | 23d | 1 | 0.37mi |
| 407 W Jordan St Unit NA Pensacola, FL | 3.0 | 2.0 | 1300 | $2,200 | $1.69 | 23d | 1 | 0.48mi |
| 1215 N C St Pensacola, FL | 3.0 | 1.0 | 1203 | $1,775 | $1.48 | 14d | 1 | 0.89mi |
| 1010 N D St Pensacola, FL | 2.0 | 2.0 | 1196 | $1,850 | $1.55 | 23d | 1 | 1.01mi |
| 2303 W Brainerd St Pensacola, FL | 2.0 | 1.0 | 955 | $1,100 | $1.15 | 23d | 1 | 1.10mi |
| 814 N E St Pensacola, FL | 3.0 | 2.0 | 1440 | $1,695 | $1.18 | 23d | 1 | 1.12mi |
| 811 N D St Pensacola, FL | 2.0 | 2.0 | 1035 | $1,395 | $1.35 | 23d | 1 | 1.13mi |
| 1918 W Strong St Unit B Pensacola, FL | 2.0 | 1.0 | 870 | $950 | $1.09 | 14d | 1 | 1.15mi |
| 1717 W Cervantes St Pensacola, FL | 2.0 | 2.0 | 974 | $1,169 | $1.20 | 14d | 3 | 1.21mi |
| 2008 N 8th Ave Pensacola, FL | 3.0 | 2.0 | 1058 | $1,250 | $1.18 | 14d | 1 | 1.30mi |
| 510 N G St Pensacola, FL | 2.0 | 1.0 | 704 | $850 | $1.21 | 23d | 1 | 1.32mi |
| 615 N A St Pensacola, FL | 3.0 | 2.0 | 1122 | $1,900 | $1.69 | 14d | 1 | 1.32mi |
| 3131 N 10th Ave Pensacola, FL | 3.0 | 1.5 | 1085 | $1,700 | $1.57 | 23d | 1 | 1.39mi |
| 418 N C St Pensacola, FL | 3.0 | 2.0 | 1017 | $2,775 | $2.73 | 14d | 1 | 1.41mi |
| 1106 Doctor Martin Luther King Junior Dr Unit A Pensacola, FL | 2.0 | 1.0 | 762 | $1,295 | $1.70 | 14d | 1 | 1.41mi |
| 3417 W Fisher St Unit C Pensacola, FL | 3.0 | 2.0 | 1106 | $1,350 | $1.22 | 23d | 1 | 1.42mi |
| 410 N C St Unit 1367374P Pensacola, FL | 3.0 | 2.0 | 1291 | $3,313 | $2.57 | 14d | 1 | 1.42mi |
| 1011 Doctor M.L.K. Jr Dr Unit B Pensacola, FL | 2.0 | 1.0 | 877 | $1,200 | $1.37 | 23d | 1 | 1.44mi |
| 1804 W Belmont St Unit A Pensacola, FL | 3.0 | 1.0 | 925 | $995 | $1.08 | 21d | 1 | 1.45mi |
| 3206 W Lee St Unit A Pensacola, FL | 2.0 | 1.0 | 800 | $1,550 | $1.94 | 14d | 1 | 1.47mi |
Listing history 18 events
-
2026-06-18days on market $97,500 Active 10 DOM
-
2026-06-17days on market $97,500 Active 9 DOM
-
2026-06-16days on market $97,500 Active 8 DOM
-
2026-06-15days on market $97,500 Active 7 DOM
-
2026-06-03days on market $97,500 Active 6 DOM
-
2026-06-02days on market $97,500 Active 5 DOM
-
2026-06-01days on market $97,500 Active 4 DOM
-
2026-05-31days on market $97,500 Active 3 DOM
-
2026-05-31remarks 530-char remark
-
2026-05-31days on market $97,500 Active 2 DOM
-
2026-05-28$97,500 Active
-
2025-11-26historical
-
2025-11-20price $150,000
-
2025-10-20$154,000 Active
-
2025-10-07historical
-
2025-09-26$139,900 Active
-
2008-10-15historical
-
2008-04-25$78,999
ⓘ Source: listings_history table (triggers on properties + properties_extension) + one-shot
backfill from property_details.listing_events for pre-trigger history.
Tax reassessment forecast FL · Resets to sale price
- Current annual tax
- $1,247 · $104/mo
- Projected year-2 tax
- $1,247 · $104/mo
- Expected delta
- $0/yr ($0/mo · 0.0%)
ⓘ Screening estimate from a state-policy table — verify with the county assessor before closing.
Climate risk First Street
- Flood 1/10 Low FEMA zone X (unshaded) · 0% chance over 30 yrs
- Wildfire 1/10 Low
- Heat 10/10 Extreme 7 d/yr ≥105°F today · 20 d/yr by 30 yrs out
- Wind 9/10 Extreme 99% chance of damaging wind over 30 yrs
- Air quality 2/10 Low 0 unhealthy d/yr today · 1 by 30 yrs out
Nearby sold comps map
Loading sold comps map…
Walkable amenities ~0.75 mi
Loading nearby amenities…
Taxation est. · year 1
- Rental income
- $21,827
- − Mortgage interest
- −$5,462
- − Property taxes
- −$1,247
- − Insurance
- −$488
- − Repairs & maintenance
- −$1,746
- − Management
- −$1,746
- − Depreciation
- −$2,836
- Taxable income
- $8,302
- Est. tax owed @ 24.0%
- −$1,993
- After-tax cash flow
- $7,381/yr
For passive investors: Depreciation is non-cash, so a rental often shows a tax loss while cash-flowing — sheltering income. Rental losses are passive: they offset passive income freely, and up to $25,000/yr can offset ordinary (W-2) income if you actively participate and your MAGI is under $100k (phasing out to $0 by $150k); unused losses carry forward. On sale, claimed depreciation is recaptured at up to 25%, and gains may owe capital-gains tax (a 1031 exchange can defer both). Figures are a year-1 estimate at your 24.0% rate — not tax advice; consult a CPA.
Schools (NCES district)
- District
- Escambia
- NCES district ID
- 1200510
- Math proficiency
- 40% ▼ -9.00%
- Reading proficiency
- 45% ▼ -4.00%
- Median HH income
- $44,649
- Composite
- 36.04/100
- National rank
- #4773
- State rank
- #56 of 73 in FL
Livability — Goulding
- Score
- 73/100
- State rank
- #296
- US rank
- #5022
Category grades
Schools grade is shown separately in the Schools card above.
Census & demographics
- Census place
- Goulding, FL
- County
- Escambia County · 301,722 people
- Metro
- Pensacola-Ferry Pass-Brent, FL
- Population (ZIP)
- 11,036
- Household income
- $44,139
- Rent vs Own
- Severe rent burden
- 816.0
Population outlook (Escambia County) Hauer SSP2
- Today (2025)
- 334,637 people
- By 2030
- 345,779 · +3.3%
- By 2040
- 364,828 · +9.0%
- By 2050
- 378,514 · +13.1%
- By 2075
- 403,220 · +20.5%
- By 2100
- 386,125 · +15.4%
Race, ethnicity, and origin ACS 2023
- Neighborhood character
- Diverse neighborhood (Simpson 0.62)
- Race & ethnicity
- Black 45% White 42% Two or more races 8% Hispanic / Latino 5%
- Common ancestry
- Subsaharan African 2% Italian 2% Slovak 2%
- Foreign-born
- 2% · Canada, Vietnam
- Languages at home
- 97% English-only · Spanish 2%
Political lean MEDSL · Escambia
- 2024 margin
- R (+19.5) · D 39.7% · R 59.2% · Other 1.1%
- 2008→2024 swing
- -0.2pp no change · 2008: -19.3pp · 2024: -19.5pp
- All cycles
- 2024: R+19.5 2020: R+15.1 2016: R+20.6 2012: R+20.6 2008: R+19.3
Not yet ingested
- Civics
- —
Market trends
- HPI YoY
- ▼ -210.53%
- Current HPI
- 273.0151
- Rent YoY
- ▲ 5.40%
- Metro
- Pensacola-Ferry Pass-Brent, FL
- State GDP YoY
- ▲ 3.28%
- F500 in state
- 36
Industry mix (Fortune 500 HQ in FL)
| Industry | F500 HQs | Revenue |
|---|---|---|
| Industrial Technology | 2 | $29B |
|
||
| Insurance | 2 | $17B |
|
||
| Retail | 1 | $60B |
|
||
| Technology Distribution | 1 | $58B |
|
||
| Homebuilding | 1 | $35B |
|
||
| Technology Manufacturing | 1 | $35B |
|
||
Price history
+23.4% since first listed8 events — show timeline
- 2026-05-28 Listed $97,500 PARMLS
- 2025-11-26 Listing Removed — PARMLS
- 2025-11-20 Price Changed $150,000 PARMLS
- 2025-10-20 Listed $154,000 PARMLS
- 2025-10-07 Listing Removed — PARMLS
- 2025-09-26 Listed $139,900 PARMLS
- 2008-10-15 Listing Removed — PARMLS
- 2008-04-25 Listed $78,999 PARMLS
Property tax history
+9.9%/yrLatest (2025): $1,247 · -15.0% YoY. Source: county tax records.
Cash-flow waterfall
monthlySold comps — $/sqft
last 12 mo · ≤1 miLoading sold comps…