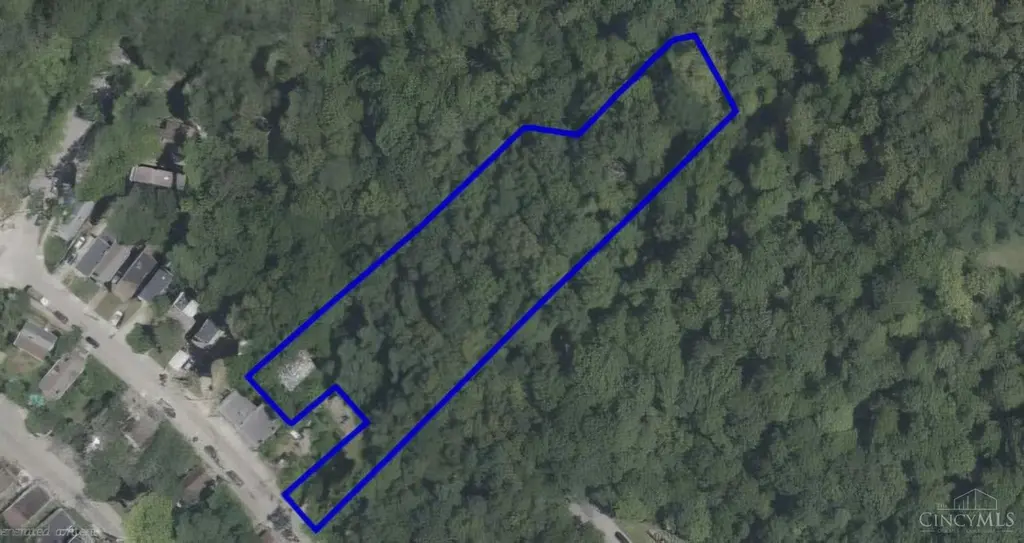
784 Delhi Ave · Cincinnati, OH
Flood risk 1/10 · Minimal
- FEMA flood zone
- X (unshaded)
- Chance of flooding over 30 yrs
- 0.0%
- Est. flood insurance / yr
- $473 – $860
Fire risk 1/10 · Minimal
- Est. fire insurance / yr
- $713 – $1,323
Heat risk 4/10 · Minor
- Hot days now (above 102°F)
- 7 days/yr
- Hot days in 30 yrs
- 19 days/yr
Wind risk 2/10 · Minimal
- Chance of severe wind over 30 yrs
- 1.0%
Air-quality risk 3/10 · Minor
- Unhealthy air days now
- 3 days/yr
- Unhealthy air days in 30 yrs
- 5 days/yr
Risk factors via First Street. Map © Google.
Why this score? — see what drove the D grade
The composite is a weighted blend of 9 inputs, each scored 0–100. Each bar is that input's sub-score; the figure is the points it added to the 100-point composite (weight × sub-score).
- Cash flow +15.0/30.0
- ARV discount +7.5/15.0
- 1% rule +5.0/10.0
- DSCR +5.0/10.0
- Livability +4.0/5.0
- Rent growth +2.5/5.0
- Schools +2.5/10.0
- Condition / age +2.5/5.0
- Appreciation +0.0/10.0
$25,000
🖨 Deal sheet (PDF) 📄 Offer letter ✓ Due diligence
Listing remarks MLS
Rare opportunity to acquire a large vacant parcel in the City of Cincinnati. Approximately 1.85 acres located on Delhi Avenue, zoned SF-4 per City of Cincinnati. Property offers significant frontage and flexibility for future residential development. Convenient access to major roads, downtown Cincinnati, and surrounding neighborhoods. Utilities believed available at street; buyer to verify all zoning, utilities, setbacks, permitted uses, and development requirements with the City of Cincinnati. Property sold as-is. No representations or warranties expressed or implied. Ideal opportunity for builders, developers, or long-term investors seeking infill land in an established area.
Key facts
- Significant frontage
- Large parcel
- 1.85 acre lot
Tags
Property features AI
Finance
- Other: Lot size about 1.847 acres (approximately 80,455 sq ft); Property located in the Sedamsville suburb; Directions: From downtown Cincinnati, take I-75 South to Hopple St exit. Continue west toward Central Pkwy, turn right on Central Pkwy, left on Delhi Ave.
- HOA & community: No homeowners association
Exterior
- Utilities: Water at street; Gas at street; Sewer at street
- Home design: Single-family home; Two levels; Second floor area approximately 1,092
- Construction: Foundation described as 'Other'
- Exterior features: Shingle roof; Windows described as 'Other'; Construction listed as 'Other'
Interior
- Bedrooms: 2 bedrooms total; Primary bedroom on level 1; Second bedroom on level 1
- Bathrooms: 1 full bathroom on level 1
- Interior features: 8 total rooms; Basement area of approximately 1,092 (finished/usable space noted)
Neighborhood map
What this means for you Summary
Snapshot
- This is a 2-bed/1.0-bath single-family listed at $25k.
Deal economics
- At list price, monthly cash flow is $1k ($14k/yr) — positive.
- The deal already cash-flows at list — no discount required.
- Meets the 1% rule at list price ($2k rent vs $25k).
- Cap rate 61.9% vs local median 3.9% in Cincinnati — top-decile yield for the area; either an underpriced asset or a hidden risk that comps aren't pricing in. Stress-test before assuming the spread holds.
Location & tenants
- Location reads 80/100 on livability (#130 in OH, #1,856 nationally) — a professional / high-income tenant draw. Strengths: amenities A+, commute A+, cost of living A+; Watch: employment D, crime F.
- Cincinnati Public Schools (urban): math 25% / reading 36% proficiency, ranked #581 of 656 in OH (top 89%) — families likely to look elsewhere, expect single-tenant / working-renter base with shorter leases; 70% free/reduced lunch — lower-income household profile, screen leases tightly.
- Zoned schools: Roberts Academy (math 16% / reading 22%, grade F, #1,320 of 1,584 statewide, top 83%, 765 students, 0% FRL); Hartwell School (math 17% / reading 31%, grade F, #593 of 654 statewide, top 91%, 447 students, 0% FRL); Walnut Hills High School (math 79% / reading 89%, grade A, #17 of 781 statewide, top 2%, 2,582 students, 14% FRL) — zoned schools average 5% FRL vs 70% district-wide (66 pts lower); this property's tenant base skews higher-income than the district average.
- Market conditions: 33 active listings in the ZIP; 3 comparable units currently listed for rent nearby; rentals leasing fast (median 5d on market — plan ~1-2 weeks tenant-placement turnaround); lower-income renter base — watch delinquency; 801 units permitted in Hamilton County in 2024 (190 in 5+ unit buildings).
- At $1,685/mo this rent would consume 65% of the median local household income ($31k/yr) (locally 487% of renters already pay >50% of income on rent) — very limited rent-growth headroom before tenants either downsize or default.
Forward outlook
- Local home prices are declining (-3.0%/yr); year-one equity from $173 of loan paydown is wiped out by about $750 of value loss. Plan a longer hold.
- At projected returns (-3.0% appreciation + 3.0% rent growth), your $7k cash investment doubles in ~1 year — after that, you're playing with house money.
Negotiation context
- Only 2 days on market — expect competitive offers; lowballing is unlikely to land.
- 7 sale attempts since 25y ago with the ask held roughly flat each time — persistent listings suggest the price (not the market) is what's stuck; bring a comps-based counter.
- Current owner paid $7k; list at $25k implies a 242% gain — meaningful room to come down on a strong offer.
Risks & watch-outs
- Watch-outs: built in 1885 — expect roof / HVAC / electrical / plumbing capex.
Questions for the listing agent
- Built in 1885 — when were the roof, HVAC, electrical panel, plumbing, and water heater last replaced?
- Is there a deadline driving the sale (1031 exchange, divorce, estate, relocation)? That informs how much negotiation room exists.
- Schools are B-rated — typically a magnet for longer-tenancy family renters. What's the average tenant stay here, and is there a school-zone premium baked into asking?
- Crime grade is F in this area — have there been break-ins, vandalism, or insurance claims at this property in the last 3 years? What carrier currently insures it and at what premium?
- The area grade is low — what's the realistic commute time and amenity access for the typical tenant pool here? Any planned neighborhood developments (good or bad) we should know about?
- What's the average days-on-market for RENTAL listings here right now (not sales)? A rising rental-DOM trend means longer vacancies and softer asking-rent achievability than the comps imply.
- What's the recent tenant-quality profile in this submarket — average credit score on applications, eviction rate, late-payment / NSF rate, and stable-employment percentage? A property-management company in the area should have these aggregated.
- How much new for-sale + rental construction is in the pipeline within 1–3 miles? Heavy new supply typically softens prices + rents 12–24 months out; constrained supply supports both.
Investment metrics
- 1% rule
- 6.74% ✓
- Cap rate
- 61.90%
- Cash-on-cash
- 198.59%
- DSCR
- 9.84
- GRM
- 1.2
CMA / ARV
- ARV (on-the-fly)
- $227,136
- Comps found
- 4
Show comp detail 4 sales within ~0.75 mi
| Address | Dist | Beds/Ba | Sqft | Sold | Price | $/sf | Match |
|---|---|---|---|---|---|---|---|
| 550 Enright Ave | 0.46mi | 3/2.0 (+1) | 2,054 (-6%) | 20mo | $185,000 | $90 | 43 |
| 462 Considine Ave | 0.65mi | 3/2.5 (+1) | 2,200 (+1%) | 22mo | $400,000 | $182 | 39 |
| 664 Enright Ave | 0.65mi | 3/1.5 (+1) | 2,004 (-8%) | 17mo | $207,500 | $104 | 34 |
| 602 Hawthorne Ave | 0.74mi | 3/2.0 (+1) | 1,983 (-9%) | 14mo | $90,000 | $45 | 29 |
Match score weights: distance 35% · size 25% · config 20% · recency 20%. Top-matched comps best support the ARV.
Projected returns pro-forma
-3.0% appreciation · 3.0% rent growth · sell at horizon
- IRR
- —
- Equity multiple
- 10.97×
- Total profit
- $69,757
- Equity at exit
- $3,728
- IRR
- —
- Equity multiple
- 23.26×
- Total profit
- $155,854
- Equity at exit
- $2,162
Cash invested: $7,000 (down + closing). Projections, not guarantees.
Landlord ↔ Tenant lean methodology
- Overall (STATE)
- 73 Landlord-Friendly
- State Ohio
- 73 Landlord-Friendly · R+6
- County
- — inherits STATE
- City
- — inherits STATE
ZIP-level market 45204
- Home prices YoY
- -21.2%
- Active inventory
- 33
- Price-to-rent
- 1.2×
Monthly cashflow live
- Estimated rent
- $1,685 medium interval (Pro) →
- Mortgage (P&I)
- −$131
- Tax est. 1.5%
- −$31 /mo · $375/yr
- Insurance
- −$10
- HOA
- −$0
- Vacancy / Maint / Mgmt
- −$354
- Net cashflow
- $1,158
Break-even live
Sensitivity live
| Price | -10% $1,176 | -5% $1,167 | +0% $1,158 | +5% $1,150 | +10% $1,141 |
|---|---|---|---|---|---|
| Rent | -10% $1,025 | -5% $1,092 | +0% $1,158 | +5% $1,225 | +10% $1,292 |
| Rate | -1.0pp $1,171 | -0.5pp $1,165 | base $1,158 | +0.5pp $1,152 | +1.0pp $1,145 |
UW: 25.0% down · 7.5% · 30yr · 1.5% tax · 5.0% vac · 8.0% maint · 8.0% mgmt
Financing live
Cash to close
- Down payment
- $6,250
- Closing costs
- $750
- Reserves months
- —
- Total cash needed
- —
Loan-product check · same deal, 3 products live
Conventional
25% down · 7.5% · 30yr
- Down + closing
- —
- Monthly P&I
- —
- Monthly cashflow
- —
- DSCR
- —
- Eligible?
- —
Personal DTI + credit; lowest rate.
DSCR
20% down · 8.5% · 30yr
- Down + closing
- —
- Monthly P&I
- —
- Monthly cashflow
- —
- DSCR
- —
- Eligible?
- —
No personal income docs; deal must DSCR.
Hard money
10% down · 12.0% · 12mo
- Down + closing
- —
- Monthly P&I
- —
- Monthly cashflow
- —
- DSCR
- —
- Eligible?
- —
Short-term bridge; refi at stabilization.
Rent comps 3 comps
| Address | Beds | Baths | Sqft | Rent | $/sqft | DOM | Units | Dist |
|---|---|---|---|---|---|---|---|---|
| 931 Olive Ave Cincinnati, OH | 3.0 | 1.0 | 1852 | $1,500 | $0.81 | 5d | 1 | 1.09mi |
| 775 Summit Ave Cincinnati, OH | 3.0 | 2.0 | 2700 | $2,100 | $0.78 | 16d | 1 | 1.12mi |
| 4227 W 8th St Cincinnati, OH | 3.0 | 2.0 | 1832 | $2,050 | $1.12 | 3d | 1 | 1.38mi |
Listing history 2 events
-
2026-06-21remarks 699-char remark
-
2026-06-21$25,000 Active 2 DOM
ⓘ Source: listings_history table (triggers on properties + properties_extension) + one-shot
backfill from property_details.listing_events for pre-trigger history.
Climate risk First Street
- Flood 1/10 Low FEMA zone X (unshaded) · 0% chance over 30 yrs
- Wildfire 1/10 Low
- Heat 4/10 Moderate 7 d/yr ≥102°F today · 19 d/yr by 30 yrs out
- Wind 2/10 Low 100% chance of damaging wind over 30 yrs
- Air quality 3/10 Moderate 3 unhealthy d/yr today · 5 by 30 yrs out
Nearby sold comps map
Loading sold comps map…
Walkable amenities ~0.75 mi
Loading nearby amenities…
Taxation est. · year 1
- Rental income
- $20,221
- − Mortgage interest
- −$1,400
- − Property taxes
- −$375
- − Insurance
- −$125
- − Repairs & maintenance
- −$1,618
- − Management
- −$1,618
- − Depreciation
- −$727
- Taxable income
- $14,358
- Est. tax owed @ 24.0%
- −$3,446
- After-tax cash flow
- $10,456/yr
For passive investors: Depreciation is non-cash, so a rental often shows a tax loss while cash-flowing — sheltering income. Rental losses are passive: they offset passive income freely, and up to $25,000/yr can offset ordinary (W-2) income if you actively participate and your MAGI is under $100k (phasing out to $0 by $150k); unused losses carry forward. On sale, claimed depreciation is recaptured at up to 25%, and gains may owe capital-gains tax (a 1031 exchange can defer both). Figures are a year-1 estimate at your 24.0% rate — not tax advice; consult a CPA.
Schools (NCES district)
- District
- Cincinnati Public Schools
- NCES district ID
- 3904375
- Math proficiency
- 25% ▼ -19.00%
- Reading proficiency
- 36% ▼ -14.00%
- Median HH income
- $35,743
- Composite
- 25.21/100
- National rank
- #7508
- State rank
- #581 of 656 in OH
Livability — Cincinnati
- Score
- 80/100
- State rank
- #130
- US rank
- #1856
Category grades
Schools grade is shown separately in the Schools card above.
Census & demographics
- Census place
- Cincinnati, OH
- County
- Hamilton County · 701,295 people
- City population
- 505,555
- Metro
- Cincinnati, OH-KY-IN
- Population (ZIP)
- 8,412
- Household income
- $31,236
- Rent vs Own
- Severe rent burden
- 487.0
Population outlook (Hamilton County) Hauer SSP2
- Today (2025)
- 826,054 people
- By 2030
- 830,947 · +0.6%
- By 2040
- 832,319 · +0.8%
- By 2050
- 822,428 · -0.4%
- By 2075
- 788,688 · -4.5%
- By 2100
- 710,674 · -14.0%
Race, ethnicity, and origin ACS 2023
- Neighborhood character
- Diverse neighborhood (Simpson 0.64)
- Race & ethnicity
- White 44% Black 41% Two or more races 13% Hispanic / Latino 2%
- Common ancestry
- Slovak 1% Lithuanian 1% Italian 1%
- Foreign-born
- 3% · Canada
- Languages at home
- 94% English-only · Spanish 3% Other Indo-European 2% Other Asian/Pacific 1%
Political lean MEDSL · Hamilton
- 2024 margin
- D (+14.9) · D 57.0% · R 42.1%
- 2008→2024 swing
- +7.9pp toward D · 2008: 7.0pp · 2024: 14.9pp
- All cycles
- 2024: D+14.9 2020: D+15.9 2016: D+9.5 2012: D+4.9 2008: D+7.0
Not yet ingested
- Civics
- —
Market trends
- HPI YoY
- ▼ -43.12%
- Current HPI
- 160.5953
- Rent YoY
- —
- Metro
- Cincinnati, OH-KY-IN
- State GDP YoY
- ▲ 1.98%
- F500 in state
- 48
Industry mix (Fortune 500 HQ in OH)
| Industry | F500 HQs | Revenue |
|---|---|---|
| Insurance | 3 | $145B |
|
||
| Industrial Machinery | 3 | $49B |
|
||
| Financial Services | 3 | $24B |
|
||
| Consumer Goods | 2 | $93B |
|
||
| Aerospace / Defense | 2 | $47B |
|
||
| Utilities | 2 | $33B |
|
||
Price history
+25.0% since first listed17 events — show timeline
- 2026-06-19 Listed $25,000 Cincy MLS
- 2026-02-27 Listing Removed — Cincy MLS
- 2026-01-22 Listed $29,900 Cincy MLS
- 2011-02-14 Sold (MLS) $7,300 Cincy MLS
- 2010-12-22 Listed $9,900 Cincy MLS
- 2010-11-05 Sold (MLS) $5,000 Cincy MLS
- 2010-03-06 Listing Removed — Cincy MLS
- 2010-03-06 Listed $9,900 Cincy MLS
- 2009-08-26 Listed $26,900 Cincy MLS
- 2009-08-25 Listing Removed — Cincy MLS
- 2009-02-28 Listed $34,900 Cincy MLS
- 2001-06-06 Sold (Public Records) $46,200 Public Records
- 2001-06-01 Sold (MLS) $46,200 Cincy MLS
- 2001-03-23 Listed — Cincy MLS
- 1994-10-31 Sold (Public Records) $33,500 Public Records
- 1987-12-07 Sold (Public Records) $20,000 Public Records
- 1986-04-09 Sold (Public Records) $20,000 Public Records
Property tax history
+20.8%/yrLatest (2025): $1,414 · +0.1% YoY. Source: county tax records.
Cash-flow waterfall
monthlySold comps — $/sqft
last 12 mo · ≤1 miLoading sold comps…