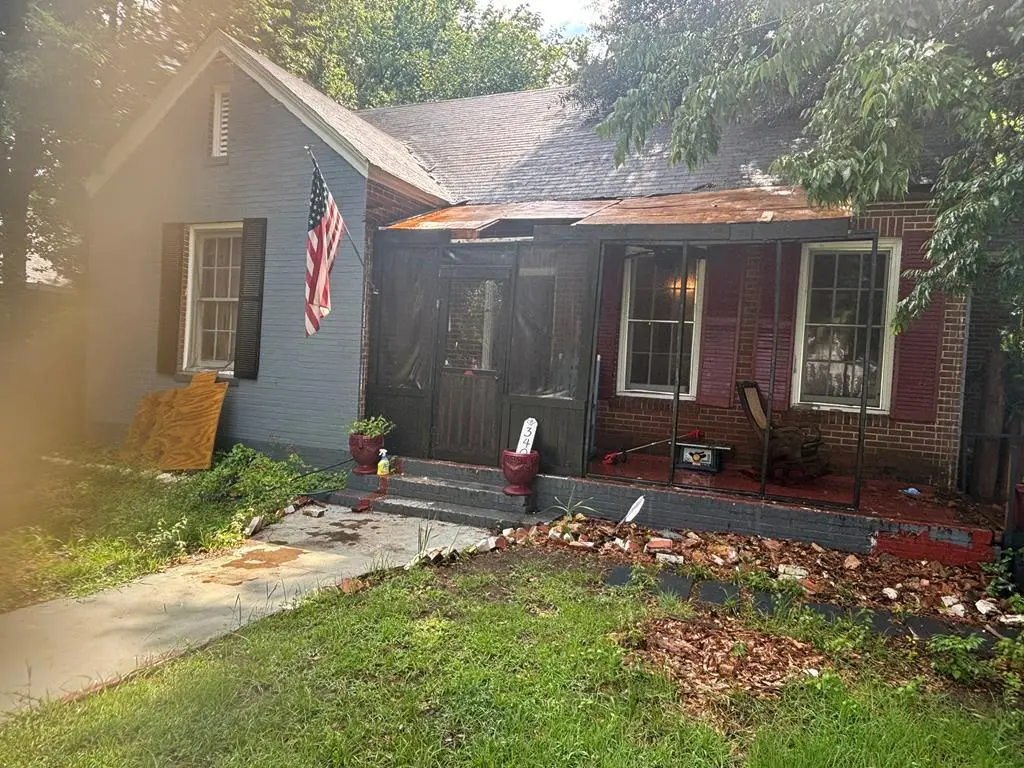
3401 13th Ave · Columbus, GA
Flood risk 1/10 · Minimal
- FEMA flood zone
- X (unshaded)
- Chance of flooding over 30 yrs
- 0.0%
- Est. flood insurance / yr
- $507 – $1,088
Fire risk 1/10 · Minimal
- Est. fire insurance / yr
- $963 – $1,789
Heat risk 7/10 · Major
- Hot days now (above 107°F)
- 7 days/yr
- Hot days in 30 yrs
- 19 days/yr
Wind risk 6/10 · Moderate
- Chance of severe wind over 30 yrs
- 76.0%
Air-quality risk 5/10 · Moderate
- Unhealthy air days now
- 7 days/yr
- Unhealthy air days in 30 yrs
- 8 days/yr
Risk factors via First Street. Map © Google.
Why this score? — see what drove the B- grade
The composite is a weighted blend of 9 inputs, each scored 0–100. Each bar is that input's sub-score; the figure is the points it added to the 100-point composite (weight × sub-score).
- Cash flow +30.0/30.0
- 1% rule +10.0/10.0
- DSCR +10.0/10.0
- ARV discount +7.5/15.0
- Rent growth +3.3/5.0
- Livability +3.2/5.0
- Condition / age +2.5/5.0
- Schools +2.2/10.0
- Appreciation +0.0/10.0
$70,000
🖨 Deal sheet 📄 Offer letter ✓ Due diligence
Listing remarks
So much potential! This all-brick home has good bones. It has hardwood floors almost throughout. Would be great for flipping. Selling as is.
Key facts
- 0.3 acre lot
- Listed 6 days
Property features AI
Exterior
- Utilities: Public water; Public sewer; Cable available
- Home design: Single-family residence; Single story
- Construction: Brick construction; Crawl space foundation
- Exterior features: Lot approximately 70 x 183 (about 0.3 acres); Zoned residential
Interior
- Flooring: Hardwood
- Bathrooms: 1 full bathroom
- Interior features: Hardwood floors; Living room fireplace (1)
- Laundry & utility: Dedicated laundry room
Neighborhood map
What this means for you Summary
Snapshot
- This is a 2-bed/1.0-bath single-family listed at $70k.
Deal economics
- At list price, monthly cash flow is $354 ($4k/yr) — positive.
- The deal already cash-flows at list — no discount required.
- Meets the 1% rule at list price ($1k rent vs $70k).
- Cap rate 12.4% vs local median 4.7% in Columbus — top-decile yield for the area; either an underpriced asset or a hidden risk that comps aren't pricing in. Stress-test before assuming the spread holds.
Location & tenants
- Location reads 64/100 on livability (#254 in GA) — a middle-class / working-renter tenant base. Strengths: cost of living A+, housing A+, health & safety B; Watch: amenities D+, schools F, crime F.
- Muscogee County (urban): math 21% / reading 30% proficiency, ranked #120 of 174 in GA (top 69%) — low school quality limits family demand, transient renter base, plan for 1-2y turnover; 61% free/reduced lunch — lower-income household profile, screen leases tightly.
- Market conditions: Rents rising (+3.0%/yr); 327 active listings in the ZIP; 27 comparable units currently listed for rent nearby; rentals at typical pace (median 21d on market — plan ~3-4 weeks tenant-placement turnaround); 48% of comp listings sitting > 30 days — soft ceiling on asking rent; 291 units permitted in Muscogee County in 2024 (30 in 5+ unit buildings).
Forward outlook
- Local home prices are declining (-3.0%/yr); year-one equity from $484 of loan paydown is wiped out by about $2k of value loss. Plan a longer hold.
- Muscogee County population projected at +15% by 2050 — modest demand growth; plan on rents tracking national, not racing it.
- At projected returns (-3.0% appreciation + 3.0% rent growth), your $20k cash investment doubles in ~6 years — after that, you're playing with house money.
Negotiation context
- Only 6 days on market — expect competitive offers; lowballing is unlikely to land.
Risks & watch-outs
- Watch-outs: property tax is 2.9% of price; built in 1927 — expect roof / HVAC / electrical / plumbing capex.
- Climate carrying-cost: major wind risk, 76% chance of damaging wind over 30y; extreme-heat days projected 7→19/yr by 2055 (HVAC capex compounding) — expect insurance premiums to compound above CPI over the hold.
Questions for the listing agent
- Built in 1927 — when were the roof, HVAC, electrical panel, plumbing, and water heater last replaced?
- Property tax is high relative to price — has the assessment been appealed recently, and will the sale trigger a re-assessment?
- Is there a deadline driving the sale (1031 exchange, divorce, estate, relocation)? That informs how much negotiation room exists.
- Schools are F-rated, which usually means shorter tenancies and higher turnover. Who's the typical renter profile here, and what's been the actual vacancy rate?
- Crime grade is F in this area — have there been break-ins, vandalism, or insurance claims at this property in the last 3 years? What carrier currently insures it and at what premium?
- What's the average days-on-market for RENTAL listings here right now (not sales)? A rising rental-DOM trend means longer vacancies and softer asking-rent achievability than the comps imply.
- What's the recent tenant-quality profile in this submarket — average credit score on applications, eviction rate, late-payment / NSF rate, and stable-employment percentage? A property-management company in the area should have these aggregated.
- How much new for-sale + rental construction is in the pipeline within 1–3 miles? Heavy new supply typically softens prices + rents 12–24 months out; constrained supply supports both.
Investment metrics
- 1% rule
- 1.66% ✓
- Cap rate
- 12.36%
- Cash-on-cash
- 21.65%
- DSCR
- 1.96
- GRM
- 5.0
CMA / ARV
- ARV (on-the-fly)
- $162,750
- Comps found
- 12
Show comp detail 12 sales within ~0.75 mi
| Address | Dist | Beds/Ba | Sqft | Sold | Price | $/sf | Match |
|---|---|---|---|---|---|---|---|
| 1616 30th St | 0.44mi | 2/1.0 | 1,293 (-1%) | 2mo | $169,900 | $131 | 76 |
| 3618 17th Ave | 0.52mi | 2/1.0 | 1,316 (+1%) | 3mo | $72,500 | $55 | 71 |
| 3525 Howard Ave | 0.23mi | 3/1.0 (+1) | 1,260 (-3%) | 9mo | $135,000 | $107 | 71 |
| 4206 Earline Ave | 0.58mi | 3/1.0 (+1) | 1,325 (+2%) | 2mo | $39,000 | $29 | 64 |
| 4109 Sherwood Ave | 0.63mi | 3/1.0 (+1) | 1,350 (+4%) | 4mo | $147,500 | $109 | 56 |
| 3310 Sherwood Ave | 0.42mi | 3/1.0 (+1) | 1,426 (+10%) | 9mo | $178,750 | $125 | 52 |
| 3640 Calvin Dr | 0.75mi | 3/2.0 (+1) | 1,254 (-4%) | 2mo | $177,500 | $142 | 48 |
| 2801 11th Ave | 0.50mi | 3/1.0 (+1) | 1,440 (+11%) | 8mo | $95,000 | $66 | 48 |
| 3408 Barrington Dr | 0.72mi | 3/1.0 (+1) | 1,252 (-4%) | 10mo | $29,000 | $23 | 46 |
| 1402 41st St | 0.48mi | 3/1.0 (+1) | 1,154 (-11%) | 11mo | $154,900 | $134 | 44 |
| 1615 30th St | 0.41mi | 3/2.0 (+1) | 1,488 (+14%) | 9mo | $214,900 | $144 | 40 |
| 1729 41st St | 0.73mi | 3/2.0 (+1) | 1,404 (+8%) | 12mo | $175,000 | $125 | 34 |
Match score weights: distance 35% · size 25% · config 20% · recency 20%. Top-matched comps best support the ARV.
Projected returns pro-forma
-3.0% appreciation · 3.04% rent growth · sell at horizon
- IRR
- 14.4%
- Equity multiple
- 1.58×
- Total profit
- $11,297
- Equity at exit
- $10,437
- IRR
- 23.2%
- Equity multiple
- 3.01×
- Total profit
- $39,305
- Equity at exit
- $6,052
Cash invested: $19,600 (down + closing). Projections, not guarantees.
Landlord ↔ Tenant lean methodology
- Overall (STATE)
- 90 Strongly Landlord-Friendly
- State Georgia
- 90 Strongly Landlord-Friendly · R+3
- County
- — inherits STATE
- City
- — inherits STATE
ZIP-level market 31904
- Rents YoY
- 3.0%
- Active inventory
- 327
- Price-to-rent
- 5.0×
Monthly cashflow live
- Estimated rent
- $1,160 high interval (Pro) →
- Mortgage (P&I)
- −$367
- Tax from tax record
- −$167 /mo · $2,002/yr
- Insurance
- −$29
- HOA
- −$0
- Vacancy / Maint / Mgmt
- −$244
- Net cashflow
- $354
Break-even live
UW: 25.0% down · 7.5% · 30yr · 1.5% tax · 5.0% vac · 8.0% maint · 8.0% mgmt
Financing live
Cash to close
- Down payment
- $17,500
- Closing costs
- $2,100
- Reserves months
- —
- Total cash needed
- —
Loan-product check · same deal, 3 products live
Conventional
25% down · 7.5% · 30yr
- Down + closing
- —
- Monthly P&I
- —
- Monthly cashflow
- —
- DSCR
- —
- Eligible?
- —
Personal DTI + credit; lowest rate.
DSCR
20% down · 8.5% · 30yr
- Down + closing
- —
- Monthly P&I
- —
- Monthly cashflow
- —
- DSCR
- —
- Eligible?
- —
No personal income docs; deal must DSCR.
Hard money
10% down · 12.0% · 12mo
- Down + closing
- —
- Monthly P&I
- —
- Monthly cashflow
- —
- DSCR
- —
- Eligible?
- —
Short-term bridge; refi at stabilization.
Rent comps 27 comps
| Address | Beds | Baths | Sqft | Rent | $/sqft | DOM | Units | Dist |
|---|---|---|---|---|---|---|---|---|
| 3519 Woodlawn Ave Columbus, GA | 3.0 | 1.0 | 1028 | $1,350 | $1.31 | 13d | 1 | 0.33mi |
| 3822 Howard Ave Unit A Columbus, GA | 2.0 | 1.0 | 1241 | $1,150 | $0.93 | 43d | 1 | 0.37mi |
| 2922 Howard Ave Unit 3 Columbus, GA | 2.0 | 2.0 | 1100 | $795 | $0.72 | 43d | 1 | 0.45mi |
| 2807 Beacon Ave Unit A Columbus, GA | 2.0 | 2.0 | 1014 | $1,250 | $1.23 | 43d | 1 | 0.52mi |
| 2807 Beacon Ave Unit B Columbus, GA | 2.0 | 2.5 | 1015 | $1,350 | $1.33 | 43d | 1 | 0.52mi |
| 4022 Young Ave Columbus, GA | 3.0 | 1.5 | 1300 | $1,100 | $0.85 | 43d | 1 | 0.53mi |
| 615 32nd St Columbus, GA | 3.0 | 1.0 | 984 | $900 | $0.91 | 13d | 1 | 0.56mi |
| 1510 28th St Columbus, GA | 3.0 | 2.0 | 1050 | $800 | $0.76 | 43d | 1 | 0.59mi |
| 707 28th St Columbus, GA | 3.0 | 1.0 | 1384 | $1,000 | $0.72 | 13d | 1 | 0.67mi |
| 635 42nd St Columbus, GA | 2.0 | 1.0 | 1008 | $750 | $0.74 | 21d | 1 | 0.68mi |
| 2005 Cherokee Dr Columbus, GA | 2.0 | 1.0 | 891 | $925 | $1.04 | 43d | 1 | 0.73mi |
| 4207 17th Ave Columbus, GA | 3.0 | 1.0 | 1006 | $1,350 | $1.34 | 43d | 1 | 0.73mi |
| 4226 Oates Ave Columbus, GA | 3.0 | 1.5 | 960 | $1,100 | $1.15 | 21d | 1 | 0.74mi |
| 3909 Crestview Dr Columbus, GA | 3.0 | 1.0 | 1110 | $1,250 | $1.13 | 13d | 1 | 0.76mi |
| 108 Comer St Columbus, GA | 2.0 | 1.0 | 1180 | $1,050 | $0.89 | 13d | 1 | 0.95mi |
| 521 46th St Columbus, GA | 2.0 | 1.0 | 954 | $975 | $1.02 | 43d | 1 | 1.02mi |
| 4025 Acacia Dr Columbus, GA | 3.0 | 1.0 | 1186 | $1,250 | $1.05 | 21d | 1 | 1.03mi |
| 403 46th St Columbus, GA | 3.0 | 2.0 | 1410 | $1,550 | $1.10 | 21d | 1 | 1.09mi |
| 4705 20th Ave Apt 2 Columbus, GA | 2.0 | 1.5 | 1127 | $1,100 | $0.98 | 13d | 1 | 1.14mi |
| 1815 17th Ave Apt 7 Columbus, GA | 2.0 | 1.0 | 937 | $1,040 | $1.11 | 43d | 1 | 1.17mi |
| 4308 Saint Francis Ave Unit 4310 Columbus, GA | 2.0 | 1.0 | 1000 | $1,125 | $1.12 | 21d | 1 | 1.21mi |
| 1 Magnolia St Columbus, GA | 3.0 | 2.0 | 1542 | $1,195 | $0.77 | 13d | 1 | 1.24mi |
| 4444 Saint Francis Ave Columbus, GA | 3.0 | 2.0 | 1525 | $1,550 | $1.02 | 13d | 1 | 1.28mi |
| 3711 Armour Ave Apt 21 Columbus, GA | 2.0 | 1.0 | 1200 | $1,057 | $0.88 | 43d | 1 | 1.38mi |
| 3821 Armour Ave Columbus, GA | 2.0 | 2.0 | 1200 | $1,100 | $0.92 | 43d | 1 | 1.42mi |
| 1503 11th Ave Columbus, GA | 3.0 | 2.0 | 1370 | $1,200 | $0.88 | 13d | 1 | 1.45mi |
| 1519 16th Ave Columbus, GA | 1.0 | 1.0 | 1000 | $1,300 | $1.30 | 44d | 1 | 1.48mi |
Listing history 6 events
-
2026-06-18days on market $70,000 Active 6 DOM
-
2026-06-17days on market $70,000 Active 5 DOM
-
2026-06-16days on market $70,000 Active 4 DOM
-
2026-06-15days on market $70,000 Active 3 DOM
-
2026-06-13remarks 141-char remark
-
2026-06-13$70,000 Active 1 DOM
ⓘ Source: listings_history table (triggers on properties + properties_extension) + one-shot
backfill from property_details.listing_events for pre-trigger history.
Tax reassessment forecast GA · Resets to sale price
- Current annual tax
- $2,002 · $167/mo
- Projected year-2 tax
- $2,002 · $167/mo
- Expected delta
- $0/yr ($0/mo · 0.0%)
ⓘ Screening estimate from a state-policy table — verify with the county assessor before closing.
Climate risk First Street
- Flood 1/10 Low FEMA zone X (unshaded) · 0% chance over 30 yrs
- Wildfire 1/10 Low
- Heat 7/10 Severe 7 d/yr ≥107°F today · 19 d/yr by 30 yrs out
- Wind 6/10 Major 76% chance of damaging wind over 30 yrs
- Air quality 5/10 Major 7 unhealthy d/yr today · 8 by 30 yrs out
Nearby sold comps map
Loading sold comps map…
Walkable amenities ~0.75 mi
Loading nearby amenities…
Taxation est. · year 1
- Rental income
- $13,926
- − Mortgage interest
- −$3,921
- − Property taxes
- −$2,002
- − Insurance
- −$350
- − Repairs & maintenance
- −$1,114
- − Management
- −$1,114
- − Depreciation
- −$2,036
- Taxable income
- $3,388
- Est. tax owed @ 24.0%
- −$813
- After-tax cash flow
- $3,431/yr
For passive investors: Depreciation is non-cash, so a rental often shows a tax loss while cash-flowing — sheltering income. Rental losses are passive: they offset passive income freely, and up to $25,000/yr can offset ordinary (W-2) income if you actively participate and your MAGI is under $100k (phasing out to $0 by $150k); unused losses carry forward. On sale, claimed depreciation is recaptured at up to 25%, and gains may owe capital-gains tax (a 1031 exchange can defer both). Figures are a year-1 estimate at your 24.0% rate — not tax advice; consult a CPA.
Schools (NCES district)
- District
- Muscogee County
- NCES district ID
- 1303870
- Math proficiency
- 21% ▼ -11.00%
- Reading proficiency
- 30% ▼ -7.00%
- Median HH income
- $41,176
- Composite
- 21.6/100
- National rank
- #8297
- State rank
- #120 of 174 in GA
Livability — Columbus
- Score
- 64/100
- State rank
- #254
- US rank
- #14102
Category grades
Schools grade is shown separately in the Schools card above.
Census & demographics
- Census place
- Columbus, GA
- County
- Muscogee County · 180,764 people
- City population
- 180,764
- Metro
- Columbus, GA-AL
- Population (ZIP)
- 35,405
- Household income
- $66,291
- Rent vs Own
- Severe rent burden
- 2030.0
Population outlook (Muscogee County) Hauer SSP2
- Today (2025)
- 216,729 people
- By 2030
- 224,504 · +3.6%
- By 2040
- 238,318 · +10.0%
- By 2050
- 249,027 · +14.9%
- By 2075
- 264,862 · +22.2%
- By 2100
- 254,786 · +17.6%
Race, ethnicity, and origin ACS 2023
- Neighborhood character
- Diverse neighborhood (Simpson 0.60)
- Race & ethnicity
- White 56% Black 28% Two or more races 8% Hispanic / Latino 7% Asian 2%
- Hispanic origin (detail)
- Mexican 3% Puerto Rican 1%
- Common ancestry
- Slovak 1% Italian 1% Romanian 1%
- Foreign-born
- 5% · Canada, South Korea
- Languages at home
- 93% English-only · Spanish 4% Korean 1% German/W. Germanic 1%
Political lean MEDSL · Muscogee
- 2024 margin
- Strong D (+23.4) · D 61.4% · R 38.0%
- 2008→2024 swing
- +3.7pp toward D · 2008: 19.7pp · 2024: 23.4pp
- All cycles
- 2024: D+23.4 2020: D+24.0 2016: D+18.6 2012: D+21.3 2008: D+19.7
Not yet ingested
- Civics
- —
Market trends
- HPI YoY
- ▼ -152.06%
- Current HPI
- 155.1405
- Rent YoY
- ▲ 3.04%
- Metro
- Columbus, GA-AL
- State GDP YoY
- ▲ 2.66%
- F500 in state
- 28
Industry mix (Fortune 500 HQ in GA)
| Industry | F500 HQs | Revenue |
|---|---|---|
| Paper / Packaging | 2 | $29B |
|
||
| Retail | 1 | $160B |
|
||
| Transportation / Logistics | 1 | $91B |
|
||
| Airlines | 1 | $62B |
|
||
| Consumer Goods | 1 | $47B |
|
||
| Utilities | 1 | $25B |
|
||
Price history
1 event — show timeline
- 2026-06-11 Listed $70,000 CBOR
Property tax history
+0.4%/yrLatest (2025): $2,002 · +0.0% YoY. Source: county tax records.
Cash-flow waterfall
monthlySold comps — $/sqft
last 12 mo · ≤1 miLoading sold comps…