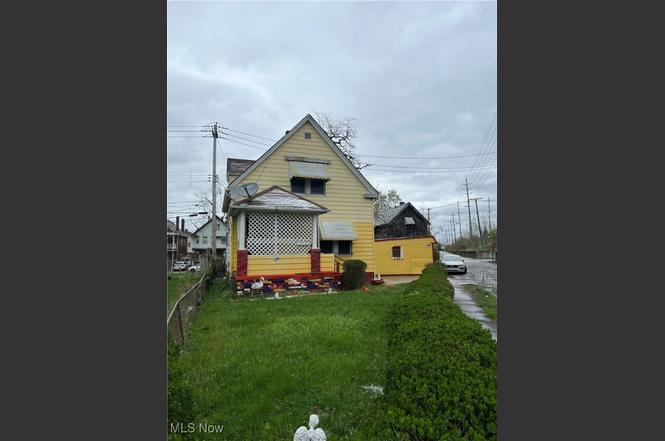
14517 Scioto Ave · East Cleveland, OH
Flood risk 6/10 · Moderate
- FEMA flood zone
- X (unshaded)
- Chance of flooding over 30 yrs
- 0.58%
- Est. flood insurance / yr
- $473 – $860
Fire risk 1/10 · Minimal
- Est. fire insurance / yr
- $713 – $1,323
Heat risk 3/10 · Minor
- Hot days now (above 95°F)
- 7 days/yr
- Hot days in 30 yrs
- 17 days/yr
Wind risk 1/10 · Minimal
- Chance of severe wind over 30 yrs
- —
Air-quality risk 3/10 · Minor
- Unhealthy air days now
- 3 days/yr
- Unhealthy air days in 30 yrs
- 5 days/yr
Risk factors via First Street. Map © Google.
Why this score? — see what drove the B- grade
The composite is a weighted blend of 9 inputs, each scored 0–100. Each bar is that input's sub-score; the figure is the points it added to the 100-point composite (weight × sub-score).
- Cash flow +30.0/30.0
- 1% rule +10.0/10.0
- DSCR +10.0/10.0
- ARV discount +7.5/15.0
- Rent growth +3.8/5.0
- Livability +3.3/5.0
- Condition / age +2.5/5.0
- Schools +0.7/10.0
- Appreciation +0.0/10.0
$65,000
🖨 Deal sheet 📄 Offer letter ✓ Due diligence
Listing remarks MLS
Great investment property located in East Cleveland. A great chance for an investor looking to build value. The property is being sold as is. Schedule your buyers for showing now! * * square footage/acreage is per Realist and is approximate. It is the Buyer's responsibility to verify any square footage/acreage numbers.
Key facts
- 2,687 sq ft lot
- Garage
- Built 1907
Neighborhood map
What this means for you Summary
Snapshot
- This is a 2-bed/1.0-bath single-family listed at $65k.
Deal economics
- At list price, monthly cash flow is $501 ($6k/yr) — positive.
- The deal already cash-flows at list — no discount required.
- Meets the 1% rule at list price ($1k rent vs $65k).
Location & tenants
- Location reads 66/100 on livability (#650 in OH) — a middle-class / working-renter tenant base. Strengths: commute A+, cost of living A+, health & safety A+; Watch: schools F, crime F, employment F.
- East Cleveland City School District (suburban): math 4% / reading 17% proficiency, ranked #652 of 656 in OH (top 99%) — low school quality limits family demand, transient renter base, plan for 1-2y turnover; 92% free/reduced lunch — lower-income household profile, screen leases tightly.
- Market conditions: Rents rising fast (+5.2%/yr); 99 active listings in the ZIP; 32 comparable units currently listed for rent nearby; rentals at typical pace (median 24d on market — plan ~3-4 weeks tenant-placement turnaround); lower-income renter base — watch delinquency; 1,441 units permitted in Cuyahoga County in 2024 (700 in 5+ unit buildings).
- At $1,217/mo this rent would consume 51% of the median local household income ($29k/yr) (locally 1702% of renters already pay >50% of income on rent) — very limited rent-growth headroom before tenants either downsize or default.
Forward outlook
- Local home prices are declining (-3.0%/yr); year-one equity from $449 of loan paydown is wiped out by about $2k of value loss. Plan a longer hold.
- Cuyahoga County population projected to shrink 8% by 2050 — rents likely to lag national; underwrite the cash flow, not the appreciation.
- At projected returns (-3.0% appreciation + 5.2% rent growth), your $18k cash investment doubles in ~4 years — after that, you're playing with house money.
Negotiation context
- Only 3 days on market — expect competitive offers; lowballing is unlikely to land.
- 3 sale attempts since 4y ago with the ask held roughly flat each time — persistent listings suggest the price (not the market) is what's stuck; bring a comps-based counter.
- Current owner paid $10k; list at $65k implies a 550% gain — meaningful room to come down on a strong offer.
Risks & watch-outs
- Watch-outs: built in 1907 — expect roof / HVAC / electrical / plumbing capex.
- Climate carrying-cost: major flood risk — expect insurance premiums to compound above CPI over the hold.
Questions for the listing agent
- Built in 1907 — when were the roof, HVAC, electrical panel, plumbing, and water heater last replaced?
- Is there a deadline driving the sale (1031 exchange, divorce, estate, relocation)? That informs how much negotiation room exists.
- Schools are F-rated, which usually means shorter tenancies and higher turnover. Who's the typical renter profile here, and what's been the actual vacancy rate?
- Crime grade is F in this area — have there been break-ins, vandalism, or insurance claims at this property in the last 3 years? What carrier currently insures it and at what premium?
- What's the average days-on-market for RENTAL listings here right now (not sales)? A rising rental-DOM trend means longer vacancies and softer asking-rent achievability than the comps imply.
- What's the recent tenant-quality profile in this submarket — average credit score on applications, eviction rate, late-payment / NSF rate, and stable-employment percentage? A property-management company in the area should have these aggregated.
- How much new for-sale + rental construction is in the pipeline within 1–3 miles? Heavy new supply typically softens prices + rents 12–24 months out; constrained supply supports both.
Investment metrics
- 1% rule
- 1.87% ✓
- Cap rate
- 15.55%
- Cash-on-cash
- 33.05%
- DSCR
- 2.47
- GRM
- 4.5
CMA / ARV
- ARV (on-the-fly)
- $42,834
- Comps found
- 12
Show comp detail 12 sales within ~0.75 mi
| Address | Dist | Beds/Ba | Sqft | Sold | Price | $/sf | Match |
|---|---|---|---|---|---|---|---|
| 13500 Claiborne Rd | 0.41mi | 3/1.0 (+1) | 1,297 (-0%) | 5mo | $44,500 | $34 | 72 |
| 1367 Shawview Ave | 0.33mi | 3/1.0 (+1) | 1,273 (-2%) | 8mo | $22,000 | $17 | 69 |
| 14200 Scioto Ave | 0.14mi | 3/1.0 (+1) | 1,256 (-3%) | 17mo | $48,500 | $39 | 69 |
| 14526 Orinoco Ave | 0.13mi | 3/1.0 (+1) | 1,462 (+13%) | 3mo | $27,000 | $18 | 65 |
| 14629 Ardenall Ave | 0.24mi | 3/1.0 (+1) | 1,384 (+7%) | 14mo | $59,000 | $43 | 62 |
| 1524 E 133rd St | 0.50mi | 3/1.0 (+1) | 1,232 (-5%) | 6mo | $30,000 | $24 | 58 |
| 15801 Hazel Rd | 0.64mi | 3/1.0 (+1) | 1,246 (-4%) | 4mo | $35,000 | $28 | 55 |
| 13412 5th Ave | 0.44mi | 3/1.0 (+1) | 1,251 (-4%) | 18mo | $86,000 | $69 | 53 |
| 14205 Savannah Ave | 0.19mi | 3/1.5 (+1) | 1,160 (-11%) | 17mo | $40,000 | $34 | 52 |
| 1358 E 134th St | 0.58mi | 3/1.0 (+1) | 1,286 (-1%) | 17mo | $42,500 | $33 | 52 |
| 1371 E 141st St | 0.38mi | 3/1.0 (+1) | 1,216 (-6%) | 19mo | $16,500 | $14 | 51 |
| 1278 E 152nd St | 0.68mi | 3/2.0 (+1) | 1,128 (-13%) | 14mo | $31,000 | $27 | 26 |
Match score weights: distance 35% · size 25% · config 20% · recency 20%. Top-matched comps best support the ARV.
Projected returns pro-forma
-3.0% appreciation · 5.16% rent growth · sell at horizon
- IRR
- 30.7%
- Equity multiple
- 2.33×
- Total profit
- $24,119
- Equity at exit
- $9,692
- IRR
- 39.1%
- Equity multiple
- 5.05×
- Total profit
- $73,799
- Equity at exit
- $5,620
Cash invested: $18,200 (down + closing). Projections, not guarantees.
Landlord ↔ Tenant lean methodology
- Overall (STATE)
- 73 Landlord-Friendly
- State Ohio
- 73 Landlord-Friendly · R+6
- County
- — inherits STATE
- City
- — inherits STATE
ZIP-level market 44112
- Rents YoY
- 5.2%
- Active inventory
- 99
- Price-to-rent
- 4.5×
Monthly cashflow live
- Estimated rent
- $1,217 high interval (Pro) →
- Mortgage (P&I)
- −$341
- Tax from tax record
- −$92 /mo · $1,105/yr
- Insurance
- −$27
- HOA
- −$0
- Vacancy / Maint / Mgmt
- −$256
- Net cashflow
- $501
Break-even live
UW: 25.0% down · 7.5% · 30yr · 1.5% tax · 5.0% vac · 8.0% maint · 8.0% mgmt
Financing live
Cash to close
- Down payment
- $16,250
- Closing costs
- $1,950
- Reserves months
- —
- Total cash needed
- —
Loan-product check · same deal, 3 products live
Conventional
25% down · 7.5% · 30yr
- Down + closing
- —
- Monthly P&I
- —
- Monthly cashflow
- —
- DSCR
- —
- Eligible?
- —
Personal DTI + credit; lowest rate.
DSCR
20% down · 8.5% · 30yr
- Down + closing
- —
- Monthly P&I
- —
- Monthly cashflow
- —
- DSCR
- —
- Eligible?
- —
No personal income docs; deal must DSCR.
Hard money
10% down · 12.0% · 12mo
- Down + closing
- —
- Monthly P&I
- —
- Monthly cashflow
- —
- DSCR
- —
- Eligible?
- —
Short-term bridge; refi at stabilization.
Rent comps 32 comps
| Address | Beds | Baths | Sqft | Rent | $/sqft | DOM | Units | Dist |
|---|---|---|---|---|---|---|---|---|
| 14312 Scioto Ave Cleveland, OH | 3.0 | 1.0 | 1090 | $1,300 | $1.19 | 4d | 1 | 0.08mi |
| 14200 Scioto Ave Cleveland, OH | 3.0 | 1.0 | 1256 | $1,350 | $1.07 | 16d | 1 | 0.14mi |
| 14005 Scioto Ave Cleveland, OH | 3.0 | 1.0 | 1056 | $1,570 | $1.49 | 16d | 1 | 0.21mi |
| 14205 Savannah Ave Cleveland, OH | 3.0 | 1.0 | 1160 | $1,350 | $1.16 | 16d | 1 | 0.21mi |
| 13900 Potomac Ave Cleveland, OH | 3.0 | 1.0 | 1172 | $1,355 | $1.16 | 23d | 1 | 0.28mi |
| 15421 Plymouth Pl East Cleveland, OH | 2.0 | 1.0 | 950 | $972 | $1.02 | 43d | 1 | 0.45mi |
| 1459 E 134th St Unit up East Cleveland, OH | 2.0 | 1.0 | 1150 | $850 | $0.74 | 10d | 1 | 0.47mi |
| 1726 Taylor Rd East Cleveland, OH | 2.0 | 1.0 | 900 | $972 | $1.08 | 43d | 1 | 0.48mi |
| 14813 Alder Ave Cleveland, OH | 3.0 | 1.0 | 1188 | $1,150 | $0.97 | 23d | 1 | 0.59mi |
| 1286 E 152nd St Cleveland, OH | 2.0 | 1.0 | 1638 | $1,095 | $0.67 | 43d | 1 | 0.70mi |
| 16000 Terrace Rd Cleveland, OH | 1.0–3.0 | 1.0–2.0 | 1000 | $932 | $0.93 | 1d | 39 | 0.87mi |
| 14120 Superior Ave Unit 1 East Cleveland, OH | 3.0 | 1.0 | 1400 | $1,350 | $0.96 | 10d | 1 | 0.92mi |
| 14120 Superior Ave Unit 4 East Cleveland, OH | 3.0 | 1.0 | 1408 | $1,350 | $0.96 | 43d | 1 | 0.92mi |
| 876 Eloise Dr Unit Upper Cleveland Heights, OH | 2.0 | 1.0 | 1233 | $1,200 | $0.97 | 16d | 1 | 1.01mi |
| 886 Helmsdale Rd Cleveland Heights, OH | 2.0 | 1.0 | 1037 | $995 | $0.96 | 16d | 1 | 1.08mi |
| 3337 Sylvanhurst Rd Cleveland, OH | 3.0 | 1.0 | 1334 | $1,800 | $1.35 | 7d | 1 | 1.14mi |
| 983 Greyton Rd Cleveland, OH | 3.0 | 2.0 | 1457 | $1,495 | $1.03 | 16d | 1 | 1.17mi |
| 953 Whitby Rd Cleveland, OH | 3.0 | 2.0 | 1188 | $1,575 | $1.33 | 23d | 1 | 1.24mi |
| 1545 Glenmont Rd Unit 1 East Cleveland, OH | 2.0 | 1.0 | 1428 | $800 | $0.56 | 23d | 1 | 1.24mi |
| 14120 Superior Rd Cleveland, OH | 3.0 | 1.0 | 1390 | $1,400 | $1.01 | 43d | 1 | 1.25mi |
| 967 Selwyn Rd Cleveland, OH | 3.0 | 1.5 | 1214 | $1,595 | $1.31 | 16d | 1 | 1.29mi |
| 2827 Avondale Ave Apt 2 Cleveland Heights, OH | 3.0 | 1.0 | 1680 | $1,275 | $0.76 | 23d | 1 | 1.36mi |
| 14172 Superior Rd Unit 2 Cleveland Heights, OH | 2.0 | 1.0 | 1446 | $1,195 | $0.83 | 23d | 1 | 1.36mi |
| 14172 Superior Rd Unit 1 Cleveland Heights, OH | 3.0 | 1.0 | 1446 | $1,295 | $0.90 | 23d | 1 | 1.36mi |
| 1338 Lakeview Rd Unit Down Cleveland, OH | 3.0 | 1.0 | 1000 | $1,900 | $1.90 | 23d | 1 | 1.36mi |
| 1605 Hillcrest Rd Cleveland, OH | 2.0 | 1.0 | 1180 | $1,245 | $1.06 | 16d | 1 | 1.37mi |
| 2401 N Taylor Rd Cleveland, OH | 3.0 | 1.0 | 1347 | $1,325 | $0.98 | 7d | 1 | 1.40mi |
| 1641 Coventry Rd Cleveland, OH | 3.0 | 1.0 | 1848 | $1,200 | $0.65 | 16d | 1 | 1.40mi |
| 1635 Belmar Rd Unit 1 Cleveland Heights, OH | 2.0 | 1.0 | 900 | $1,200 | $1.33 | 23d | 1 | 1.40mi |
| 1633 Eddington Rd Unit 1 Cleveland Heights, OH | 3.0 | 1.0 | 1538 | $1,100 | $0.72 | 23d | 1 | 1.40mi |
| 1007 Elbon Rd Cleveland, OH | 3.0 | 1.0 | 1386 | $1,400 | $1.01 | 10d | 1 | 1.45mi |
| 12511 Euclid Ave Cleveland, OH | 2.0 | 2.5 | 1300 | $1,400 | $1.08 | 43d | 1 | 1.49mi |
Listing history 13 events
-
2025-07-25status Pending
-
2025-07-21$65,000 Active
-
2023-10-19historical
-
2023-05-31price $64,900
-
2023-04-19$69,900 Active
-
2023-03-01soldstatus $10,000 Closed 323-char remark
Show marketing remark (323 chars)
Great investment property located in East Cleveland. A great chance for an investor looking to build value. The property is being sold as is. Schedule your buyers for showing now! * * square footage/acreage is per Realist and is approximate. It is the Buyer's responsibility to verify any square footage/acreage numbers.
-
2023-02-07status Pending 323-char remark
Show marketing remark (323 chars)
Great investment property located in East Cleveland. A great chance for an investor looking to build value. The property is being sold as is. Schedule your buyers for showing now! * * square footage/acreage is per Realist and is approximate. It is the Buyer's responsibility to verify any square footage/acreage numbers.
-
2023-01-05price $20,000 323-char remark
Show marketing remark (323 chars)
Great investment property located in East Cleveland. A great chance for an investor looking to build value. The property is being sold as is. Schedule your buyers for showing now! * * square footage/acreage is per Realist and is approximate. It is the Buyer's responsibility to verify any square footage/acreage numbers.
-
2022-11-22price $28,000 323-char remark
Show marketing remark (323 chars)
Great investment property located in East Cleveland. A great chance for an investor looking to build value. The property is being sold as is. Schedule your buyers for showing now! * * square footage/acreage is per Realist and is approximate. It is the Buyer's responsibility to verify any square footage/acreage numbers.
-
2022-10-03price $35,000 323-char remark
Show marketing remark (323 chars)
Great investment property located in East Cleveland. A great chance for an investor looking to build value. The property is being sold as is. Schedule your buyers for showing now! * * square footage/acreage is per Realist and is approximate. It is the Buyer's responsibility to verify any square footage/acreage numbers.
-
2022-09-21price $40,000 323-char remark
Show marketing remark (323 chars)
Great investment property located in East Cleveland. A great chance for an investor looking to build value. The property is being sold as is. Schedule your buyers for showing now! * * square footage/acreage is per Realist and is approximate. It is the Buyer's responsibility to verify any square footage/acreage numbers.
-
2022-08-01$55,000 Active 323-char remark
Show marketing remark (323 chars)
Great investment property located in East Cleveland. A great chance for an investor looking to build value. The property is being sold as is. Schedule your buyers for showing now! * * square footage/acreage is per Realist and is approximate. It is the Buyer's responsibility to verify any square footage/acreage numbers.
-
1971-12-01soldstatus $12,900
ⓘ Source: listings_history table (triggers on properties + properties_extension) + one-shot
backfill from property_details.listing_events for pre-trigger history.
Tax reassessment forecast OH · Partial reset (capped growth)
- Current annual tax
- $1,105 · $92/mo
- Projected year-2 tax
- $1,105 · $92/mo
- Expected delta
- $0/yr ($0/mo · 0.0%)
ⓘ Screening estimate from a state-policy table — verify with the county assessor before closing.
Climate risk First Street
- Flood 6/10 Major FEMA zone X (unshaded) · 58% chance over 30 yrs
- Wildfire 1/10 Low
- Heat 3/10 Moderate 7 d/yr ≥95°F today · 17 d/yr by 30 yrs out
- Wind 1/10 Low
- Air quality 3/10 Moderate 3 unhealthy d/yr today · 5 by 30 yrs out
Nearby sold comps map
Loading sold comps map…
Walkable amenities ~0.75 mi
Loading nearby amenities…
Taxation est. · year 1
- Rental income
- $14,602
- − Mortgage interest
- −$3,641
- − Property taxes
- −$1,105
- − Insurance
- −$325
- − Repairs & maintenance
- −$1,168
- − Management
- −$1,168
- − Depreciation
- −$1,891
- Taxable income
- $5,304
- Est. tax owed @ 24.0%
- −$1,273
- After-tax cash flow
- $4,742/yr
For passive investors: Depreciation is non-cash, so a rental often shows a tax loss while cash-flowing — sheltering income. Rental losses are passive: they offset passive income freely, and up to $25,000/yr can offset ordinary (W-2) income if you actively participate and your MAGI is under $100k (phasing out to $0 by $150k); unused losses carry forward. On sale, claimed depreciation is recaptured at up to 25%, and gains may owe capital-gains tax (a 1031 exchange can defer both). Figures are a year-1 estimate at your 24.0% rate — not tax advice; consult a CPA.
Schools (NCES district)
- District
- East Cleveland City School District
- NCES district ID
- 3904390
- Math proficiency
- 4% ▼ -16.00%
- Reading proficiency
- 17% ▼ -13.00%
- Median HH income
- $22,726
- Composite
- 7.38/100
- National rank
- #9954
- State rank
- #652 of 656 in OH
Livability — East Cleveland
- Score
- 66/100
- State rank
- #650
- US rank
- #11510
Category grades
Schools grade is shown separately in the Schools card above.
Census & demographics
- Census place
- East Cleveland, OH
- County
- Cuyahoga County · 1,090,369 people
- City population
- 17,848
- Metro
- Cleveland-Elyria, OH
- Population (ZIP)
- 17,848
- Household income
- $28,799
- Rent vs Own
- Severe rent burden
- 1702.0
Population outlook (Cuyahoga County) Hauer SSP2
- Today (2025)
- 1,244,621 people
- By 2030
- 1,230,093 · -1.2%
- By 2040
- 1,189,108 · -4.5%
- By 2050
- 1,145,706 · -7.9%
- By 2075
- 1,076,557 · -13.5%
- By 2100
- 978,987 · -21.3%
Race, ethnicity, and origin ACS 2023
- Neighborhood character
- Predominantly Black (89%)
- Race & ethnicity
- Black 89% White 7% Two or more races 2% Hispanic / Latino 1%
- Common ancestry
- Lithuanian 1%
- Foreign-born
- 4% · Canada
- Languages at home
- 93% English-only · French/Haitian/Cajun 3% Spanish 2% Russian/Polish/Slavic 1%
Political lean MEDSL · Cuyahoga
- 2024 margin
- Solid D (+31.5) · D 65.4% · R 33.9%
- 2008→2024 swing
- -7.4pp toward R · 2008: 38.9pp · 2024: 31.5pp
- All cycles
- 2024: D+31.5 2020: D+34.1 2016: D+35.0 2012: D+38.7 2008: D+38.9
Not yet ingested
- Civics
- —
Market trends
- HPI YoY
- ▼ -115.61%
- Current HPI
- 67.2162
- Rent YoY
- ▲ 5.16%
- Metro
- Cleveland-Elyria, OH
- State GDP YoY
- ▲ 1.98%
- F500 in state
- 48
Industry mix (Fortune 500 HQ in OH)
| Industry | F500 HQs | Revenue |
|---|---|---|
| Insurance | 3 | $145B |
|
||
| Industrial Machinery | 3 | $49B |
|
||
| Financial Services | 3 | $24B |
|
||
| Consumer Goods | 2 | $93B |
|
||
| Aerospace / Defense | 2 | $47B |
|
||
| Utilities | 2 | $33B |
|
||
Price history
+403.9% since first listed13 events — show timeline
- 2025-07-25 Pending — MLSNOW
- 2025-07-21 Listed $65,000 MLSNOW
- 2023-10-19 Listing Removed — MLSNOW
- 2023-05-31 Price Changed $64,900 MLSNOW
- 2023-04-19 Listed $69,900 MLSNOW
- 2023-03-01 Sold (MLS) $10,000 MLSNOW
- 2023-02-07 Pending — MLSNOW
- 2023-01-05 Price Changed $20,000 MLSNOW
- 2022-11-22 Price Changed $28,000 MLSNOW
- 2022-10-03 Price Changed $35,000 MLSNOW
- 2022-09-21 Price Changed $40,000 MLSNOW
- 2022-08-01 Listed $55,000 MLSNOW
- 1971-12-01 Sold (Public Records) $12,900 Public Records
Property tax history
+10.5%/yrLatest (2025): $1,105 · +6.2% YoY. Source: county tax records.
Cash-flow waterfall
monthlySold comps — $/sqft
last 12 mo · ≤1 miLoading sold comps…