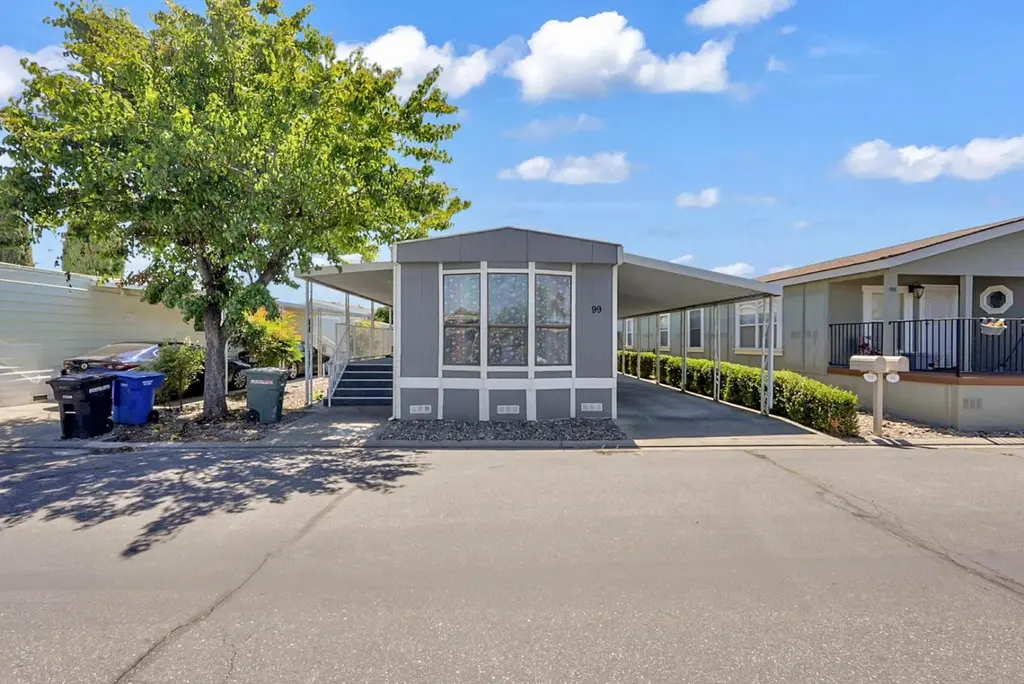
2841 Fowler Rd #99 · Ceres, CA
Flood risk 1/10 · Minimal
- FEMA flood zone
- X (unshaded)
- Chance of flooding over 30 yrs
- 0.0%
- Est. flood insurance / yr
- $507 – $1,088
Fire risk 3/10 · Minor
- Est. fire insurance / yr
- $659 – $1,223
Heat risk 6/10 · Moderate
- Hot days now (above 102°F)
- 7 days/yr
- Hot days in 30 yrs
- 13 days/yr
Wind risk 1/10 · Minimal
- Chance of severe wind over 30 yrs
- —
Air-quality risk 10/10 · Severe
- Unhealthy air days now
- 34 days/yr
- Unhealthy air days in 30 yrs
- 37 days/yr
Risk factors via First Street. Map © Google.
Why this score? — see what drove the B grade
The composite is a weighted blend of 9 inputs, each scored 0–100. Each bar is that input's sub-score; the figure is the points it added to the 100-point composite (weight × sub-score).
- Cash flow +30.0/30.0
- ARV discount +13.1/15.0
- 1% rule +10.0/10.0
- DSCR +10.0/10.0
- Condition / age +3.8/5.0
- Schools +2.8/10.0
- Livability +2.7/5.0
- Rent growth +2.5/5.0
- Appreciation +0.0/10.0
$70,000
🖨 Deal sheet 📄 Offer letter ✓ Due diligence
Listing remarks
Don't miss this clean, well-maintained 2-bedroom, 1-bath home nestled in a welcoming all-age park and offering one of the lowest space rents in the area. Whether you're looking to own without overpaying or simply ready to stop renting, this home checks the boxes that matter most. Enjoy the convenience of in-unit laundry, covered parking, and a yard of your own, perfect for relaxing, entertaining, or making it your own. Inside, the home is move-in ready, with comfortable, functional layout that's been well maintained. Located just minutes from shopping and with easy freeway access, you get the quiet of a tight-knit community without giving up everyday convenience.
Key facts
- Covered parking
- Yard of your own
- Easy freeway access
Tags
Property features AI
Finance
- Other: Located in Las Casitas Mobile Home Park
- HOA & community: Land lease in place ($825); Rent includes trash, water, and sewer
Exterior
- Parking: Covered parking space
- Utilities: Public sewer; District/public water
- Home design: Single-story mobile home (14' x 56'); Mobile home remains on site
- Construction: Year built reported by seller
- Exterior features: Community pool; Street lighting; Lot has rock landscaping; Elevation measured in feet
Interior
- Bathrooms: 1 full bathroom
- Interior features: Entry on main level
- Laundry & utility: Laundry inside the unit
Neighborhood map
What this means for you Summary
Snapshot
- This is a 2-bed/1.0-bath manufactured listed at $70k. Condition is rated good.
Deal economics
- At list price, monthly cash flow is $869 ($10k/yr) — positive.
- The deal already cash-flows at list — no discount required.
- Meets the 1% rule at list price ($2k rent vs $70k).
- Recommended offer: $68k (3.0% below list) — sets the bar for market timing.
- Cap rate 21.2% vs local median 3.8% in Ceres — top-decile yield for the area; either an underpriced asset or a hidden risk that comps aren't pricing in. Stress-test before assuming the spread holds.
Location & tenants
- Location reads 54/100 on livability (#923 in CA) — a working-class tenant base; expect higher turnover. Strengths: housing A+; Watch: employment C-, crime D+, schools D-.
- Ceres Unified (suburban): math 15% / reading 50% proficiency, ranked #303 of 517 in CA (top 59%) — families likely to look elsewhere, expect single-tenant / working-renter base with shorter leases; 69% free/reduced lunch — lower-income household profile, screen leases tightly.
- Market conditions: 87 active listings in the ZIP; 11 comparable units currently listed for rent nearby; rentals at typical pace (median 21d on market — plan ~3-4 weeks tenant-placement turnaround); solid renter incomes; 923 units permitted in Stanislaus County in 2024 (63 in 5+ unit buildings).
Forward outlook
- Local home prices are declining (-3.0%/yr); year-one equity from $484 of loan paydown is wiped out by about $2k of value loss. Plan a longer hold.
- Stanislaus County population projected at +14% by 2050 — modest demand growth; plan on rents tracking national, not racing it.
- At projected returns (-3.0% appreciation + 3.0% rent growth), your $20k cash investment doubles in ~3 years — after that, you're playing with house money.
Negotiation context
- It's been on market 36 days — a 3% lower offer ($68k) is reasonable based on typical stale-listing flexibility.
Risks & watch-outs
- Climate carrying-cost: extreme-heat days projected 7→13/yr by 2055 (HVAC capex compounding) — expect insurance premiums to compound above CPI over the hold.
Questions for the listing agent
- It's been on market 36 days. Have you received any prior offers? Is the seller open to a 3% concession, seller financing, or rate buy-down credit?
- Is there a deadline driving the sale (1031 exchange, divorce, estate, relocation)? That informs how much negotiation room exists.
- Schools are D-rated, which usually means shorter tenancies and higher turnover. Who's the typical renter profile here, and what's been the actual vacancy rate?
- Crime grade is D in this area — have there been break-ins, vandalism, or insurance claims at this property in the last 3 years? What carrier currently insures it and at what premium?
- What's the average days-on-market for RENTAL listings here right now (not sales)? A rising rental-DOM trend means longer vacancies and softer asking-rent achievability than the comps imply.
- What's the recent tenant-quality profile in this submarket — average credit score on applications, eviction rate, late-payment / NSF rate, and stable-employment percentage? A property-management company in the area should have these aggregated.
- How much new for-sale + rental construction is in the pipeline within 1–3 miles? Heavy new supply typically softens prices + rents 12–24 months out; constrained supply supports both.
Investment metrics
- 1% rule
- 2.45% ✓
- Cap rate
- 21.19%
- Cash-on-cash
- 53.20%
- DSCR
- 3.37
- GRM
- 3.4
CMA / ARV
- ARV (median comp)
- $80,046
- List price
- $70,000
- Delta
- -12.55%
- Verdict
- UNDERPRICED
- Comps
- 12 within 1.0 mi
Show comp detail 4 sales within ~0.75 mi
| Address | Dist | Beds/Ba | Sqft | Sold | Price | $/sf | Match |
|---|---|---|---|---|---|---|---|
| 2841 Fowler Rd #99 | 0.00mi | 2/1.0 | 784 (0%) | 0mo | $68,000 | $87 | 100 |
| 2841 2841 Fowler Rd #94 | 0.15mi | 2/1.0 | 784 (0%) | 22mo | $57,500 | $73 | 75 |
| 2845 E Hatch Rd #23 | 0.44mi | 3/2.0 (+1) | 840 (+7%) | 14mo | $90,000 | $107 | 47 |
| 2845 Hatch Rd Rd #42 | 0.47mi | 2/1.0 | 720 (-8%) | 22mo | $60,000 | $83 | 46 |
Match score weights: distance 35% · size 25% · config 20% · recency 20%. Top-matched comps best support the ARV.
Projected returns pro-forma
-3.0% appreciation · 3.0% rent growth · sell at horizon
- IRR
- 51.3%
- Equity multiple
- 3.25×
- Total profit
- $44,030
- Equity at exit
- $10,437
- IRR
- 56.6%
- Equity multiple
- 6.60×
- Total profit
- $109,713
- Equity at exit
- $6,052
Cash invested: $19,600 (down + closing). Projections, not guarantees.
Landlord ↔ Tenant lean methodology
- Overall (STATE)
- 18 Strongly Tenant-Friendly
- State California
- 18 Strongly Tenant-Friendly · D+13
- County
- — inherits STATE
- City
- — inherits STATE
ZIP-level market 95307
- Active inventory
- 87
- Price-to-rent
- 3.4×
Monthly cashflow live
- Estimated rent
- $1,712 high interval (Pro) →
- Mortgage (P&I)
- −$367
- Tax est. 1.5%
- −$88 /mo · $1,050/yr
- Insurance
- −$29
- HOA
- −$0
- Vacancy / Maint / Mgmt
- −$360
- Net cashflow
- $869
Break-even live
UW: 25.0% down · 7.5% · 30yr · 1.5% tax · 5.0% vac · 8.0% maint · 8.0% mgmt
Financing live
Cash to close
- Down payment
- $17,500
- Closing costs
- $2,100
- Reserves months
- —
- Total cash needed
- —
Loan-product check · same deal, 3 products live
Conventional
25% down · 7.5% · 30yr
- Down + closing
- —
- Monthly P&I
- —
- Monthly cashflow
- —
- DSCR
- —
- Eligible?
- —
Personal DTI + credit; lowest rate.
DSCR
20% down · 8.5% · 30yr
- Down + closing
- —
- Monthly P&I
- —
- Monthly cashflow
- —
- DSCR
- —
- Eligible?
- —
No personal income docs; deal must DSCR.
Hard money
10% down · 12.0% · 12mo
- Down + closing
- —
- Monthly P&I
- —
- Monthly cashflow
- —
- DSCR
- —
- Eligible?
- —
Short-term bridge; refi at stabilization.
Rent comps 11 comps
| Address | Beds | Baths | Sqft | Rent | $/sqft | DOM | Units | Dist |
|---|---|---|---|---|---|---|---|---|
| 2121 Moffett Rd Ceres, CA | 2.0 | 1.0 | 900 | $1,450 | $1.61 | 44d | 1 | 0.51mi |
| 2250 5th St Unit 11 Ceres, CA | 2.0 | 1.0 | 700 | $1,395 | $1.99 | 23d | 1 | 0.71mi |
| 2714 Pyramid Ave Unit 2714 Ceres, CA | 3.0 | 2.0 | 1008 | $1,895 | $1.88 | 23d | 1 | 1.04mi |
| 2717 Roeding Rd Apt 92 Ceres, CA | 2.0 | 1.0 | 850 | $1,750 | $2.06 | 44d | 1 | 1.10mi |
| 2717 Roeding Rd Unit 34 Ceres, CA | 2.0 | 1.0 | 850 | $1,650 | $1.94 | 14d | 1 | 1.10mi |
| 2717 Roeding Rd Unit 18 Ceres, CA | 2.0 | 1.0 | 850 | $1,600 | $1.88 | 14d | 1 | 1.10mi |
| 2717 Roeding Rd Apt 103 Ceres, CA | 2.0 | 1.0 | 850 | $1,800 | $2.12 | 21d | 1 | 1.10mi |
| 2717 Roeding Rd Unit 96 Ceres, CA | 2.0 | 1.0 | 850 | $1,650 | $1.94 | 44d | 1 | 1.10mi |
| 2717 Roeding Rd Apt 13 Ceres, CA | 2.0 | 1.0 | 850 | $1,850 | $2.18 | 21d | 1 | 1.10mi |
| 1749 Richland Ave Ceres, CA | 2.0 | 1.0 | 815 | $1,745 | $2.14 | 5d | 1 | 1.30mi |
| 2800 Don Pedro Rd Ceres, CA | 2.0 | 1.0 | 816 | $1,695 | $2.08 | 3d | 1 | 1.43mi |
Listing history 15 events
-
2026-06-16days on market $70,000 Active 36 DOM
-
2026-06-15days on market $70,000 Active 35 DOM
-
2026-06-14days on market $70,000 Active 33 DOM
-
2026-06-13days on market $70,000 Active 32 DOM
-
2026-06-10days on market $70,000 Active 30 DOM
-
2026-06-09days on market $70,000 Active 29 DOM
-
2026-06-08days on market $70,000 Active 28 DOM
-
2026-06-07days on market $70,000 Active 27 DOM
-
2026-06-05days on market $70,000 Active 24 DOM
-
2026-06-03days on market $70,000 Active 23 DOM
-
2026-06-02days on market $70,000 Active 22 DOM
-
2026-06-01days on market $70,000 Active 21 DOM
-
2026-05-31days on market $70,000 Active 20 DOM
-
2026-05-30days on market $70,000 Active 19 DOM
-
2026-05-11$70,000 Active 671-char remark
ⓘ Source: listings_history table (triggers on properties + properties_extension) + one-shot
backfill from property_details.listing_events for pre-trigger history.
Climate risk First Street
- Flood 1/10 Low FEMA zone X (unshaded) · 0% chance over 30 yrs
- Wildfire 3/10 Moderate
- Heat 6/10 Major 7 d/yr ≥102°F today · 13 d/yr by 30 yrs out
- Wind 1/10 Low
- Air quality 10/10 Extreme 34 unhealthy d/yr today · 37 by 30 yrs out
Nearby sold comps map
Loading sold comps map…
Walkable amenities ~0.75 mi
Loading nearby amenities…
Taxation est. · year 1
- Rental income
- $20,548
- − Mortgage interest
- −$3,921
- − Property taxes
- −$1,050
- − Insurance
- −$350
- − Repairs & maintenance
- −$1,644
- − Management
- −$1,644
- − Depreciation
- −$2,036
- Taxable income
- $9,903
- Est. tax owed @ 24.0%
- −$2,377
- After-tax cash flow
- $8,051/yr
For passive investors: Depreciation is non-cash, so a rental often shows a tax loss while cash-flowing — sheltering income. Rental losses are passive: they offset passive income freely, and up to $25,000/yr can offset ordinary (W-2) income if you actively participate and your MAGI is under $100k (phasing out to $0 by $150k); unused losses carry forward. On sale, claimed depreciation is recaptured at up to 25%, and gains may owe capital-gains tax (a 1031 exchange can defer both). Figures are a year-1 estimate at your 24.0% rate — not tax advice; consult a CPA.
Condition & rehab AI · 25 photos
This well-maintained mobile home is move-in ready and located in a desirable all-age park with easy access to shopping and freeways. It offers a good condition with minimal repairs needed.
Value-add opportunities
- Both Paint the exterior siding — Painting the exterior siding can improve the curb appeal and increase the home's value.
- Both Clean the gutters — Cleaning the gutters can improve the home's appearance and prevent water damage to the siding and foundation.
Renovation cost estimate screening
Value-add ROI direction
- Both Paint the exterior siding — Painting the exterior siding can improve the curb appeal and increase the home's value. ↑
- Both Clean the gutters — Cleaning the gutters can improve the home's appearance and prevent water damage to the siding and foundation. ↑
ⓘ Cost ranges are severity-bucket heuristics (US national rule-of-thumb). Get contractor quotes + a written scope before underwriting a rehab budget.
Schools (NCES district)
- District
- Ceres Unified
- NCES district ID
- 0608130
- Math proficiency
- 15% ▼ -9.00%
- Reading proficiency
- 50% ▲ 12.00%
- Median HH income
- $48,178
- Composite
- 27.96/100
- National rank
- #6858
- State rank
- #303 of 517 in CA
Livability — Ceres
- Score
- 54/100
- State rank
- #923
- US rank
- #24224
Category grades
Schools grade is shown separately in the Schools card above.
Census & demographics
- Census place
- Ceres, CA
- County
- Stanislaus County · 445,786 people
- City population
- 46,310
- Metro
- Modesto, CA
- Population (ZIP)
- 46,310
- Household income
- $80,627
- Rent vs Own
- Severe rent burden
- 1102.0
Population outlook (Stanislaus County) Hauer SSP2
- Today (2025)
- 579,493 people
- By 2030
- 598,000 · +3.2%
- By 2040
- 630,930 · +8.9%
- By 2050
- 658,300 · +13.6%
- By 2075
- 712,363 · +22.9%
- By 2100
- 719,805 · +24.2%
Race, ethnicity, and origin ACS 2023
- Neighborhood character
- Majority Hispanic (64%)
- Race & ethnicity
- Hispanic / Latino 64% Two or more races 34% White 23% Asian 8% Black 1%
- Hispanic origin (detail)
- Mexican 61%
- Common ancestry
- Russian 3% Lithuanian 1% Italian 1%
- Foreign-born
- 27% · Canada, China
- Languages at home
- 41% English-only · Spanish 49% Other Indo-European 7% Arabic 1%
Political lean MEDSL · Stanislaus
- 2024 margin
- R (+11.0) · D 43.2% · R 54.2% · Other 2.6%
- 2008→2024 swing
- -12.7pp toward R · 2008: 1.7pp · 2024: -11.0pp
- All cycles
- 2024: R+11.0 2020: D+0.8 2016: D+0.6 2012: D+0.7 2008: D+1.7
Not yet ingested
- Civics
- —
Market trends
- HPI YoY
- ▼ -362.75%
- Current HPI
- 307.5192
- Rent YoY
- —
- Metro
- Modesto, CA
- State GDP YoY
- ▲ 3.21%
- F500 in state
- 116
Industry mix (Fortune 500 HQ in CA)
| Industry | F500 HQs | Revenue |
|---|---|---|
| Technology | 27 | $1,492B |
|
||
| Financial Services | 3 | $174B |
|
||
| Retail | 3 | $44B |
|
||
| Insurance | 3 | $26B |
|
||
| Media / Entertainment | 2 | $115B |
|
||
| Pharmaceuticals / Biotech | 2 | $62B |
|
||
Price history
-2.9% since first listed2 events — show timeline
- 2026-06-16 Sold (MLS) $68,000 CRMLS
- 2026-05-11 Listed $70,000 CRMLS
Cash-flow waterfall
monthlySold comps — $/sqft
last 12 mo · ≤1 miLoading sold comps…