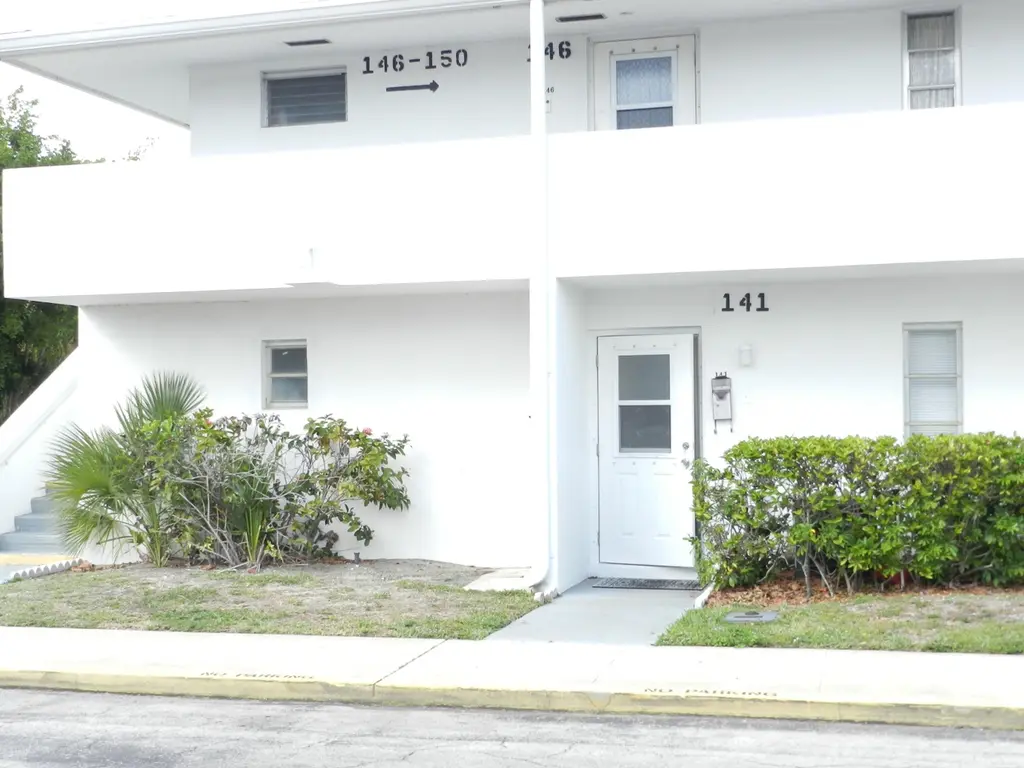
141 West Ct · Royal Palm Beach, FL
Flood risk 1/10 · Minimal
- FEMA flood zone
- X (unshaded)
- Chance of flooding over 30 yrs
- 0.0%
- Est. flood insurance / yr
- $507 – $1,088
Fire risk 1/10 · Minimal
- Est. fire insurance / yr
- $947 – $1,759
Heat risk 10/10 · Severe
- Hot days now (above 107°F)
- 7 days/yr
- Hot days in 30 yrs
- 27 days/yr
Wind risk 10/10 · Severe
- Chance of severe wind over 30 yrs
- 99.0%
Air-quality risk 2/10 · Minimal
- Unhealthy air days now
- 0 days/yr
- Unhealthy air days in 30 yrs
- 1 days/yr
Risk factors via First Street. Map © Google.
Why this score? — see what drove the D+ grade
The composite is a weighted blend of 9 inputs, each scored 0–100. Each bar is that input's sub-score; the figure is the points it added to the 100-point composite (weight × sub-score).
- Appreciation +10.0/10.0
- Cash flow +9.5/30.0
- ARV discount +7.5/15.0
- 1% rule +5.4/10.0
- Schools +4.3/10.0
- Livability +4.0/5.0
- DSCR +2.7/10.0
- Rent growth +2.7/5.0
- Condition / age +2.5/5.0
$163,900
🖨 Deal sheet (PDF) 📄 Offer letter ✓ Due diligence
Listing remarks
ALL AGE COMMUNITY NOT A 55 YEAR COMMUNITY FULLY REMODLED 1 BEDROOM 1 BATHROOM PLUS A DEN WITH A CARPORT A/C NEW BEAUTIFUL KITCHEN NEW KITCHEN APPLIANCE. . WASHER DRYER IN THE CONDO LARGE GREAT ROOM BACK OF CONDO HAS A AREA YOU CAN MAKE A PATIO CLOSE TO POOL AND COVERED PARKING STEPS AWAY AS IS CONTRACT PRE APPROVED LETTER CASH PROOF OF FUNDS
Key facts
- $334 HOA
- Parking
- Community pool
Property features AI
Finance
- Financial info: Land lease: none; Pets allowed with size limits
- HOA & community: Association (monthly fee) includes cable TV, structural maintenance, and pest control; Association amenities include clubhouse, parking, pool (heated), bocce ball, community room, courtesy bus, internet included, sidewalks, and street lights; Monthly HOA fee: $334
Exterior
- Parking: Assigned parking; Detached carport (1 covered carport space); Asphalt parking surface
- Utilities: Public water; Public sewer; Electricity connected; Cable available; Water and sewer available
- Home design: Condominium; Single-story (1 story total); Entry level: 1; Northeast-facing
- Construction: Concrete/Stucco/CBS construction; Flat roof; Slab foundation; Built as resale condition
- Exterior features: Corner lot with sidewalks; Private road frontage (private maintained road); Paved road surface; Not waterfront
Interior
- Kitchen: Dishwasher; Electric range; Microwave; Refrigerator
- Bedrooms: 1 bedroom on the main level
- Flooring: Ceramic tile; Tile; Wood
- Bathrooms: 1 full bathroom
- Heating & cooling: Central electric heating; Central air conditioning; Wall/window unit(s); 220 volts electrical service with circuit breakers and three-phase available
- Interior features: Walk-in closet(s); Blinds on windows; Central living area accessibility
- Laundry & utility: Laundry closet with washer hookup on the main level
Neighborhood map
What this means for you Summary
Snapshot
- This is a 1-bed/1.0-bath condo listed at $164k.
Deal economics
- At list price, monthly cash flow is $-115 ($-1k/yr) — negative.
- To cash-flow at today's rent, offer at most $147k (10.1% below list).
- Meets the 1% rule at list price ($2k rent vs $164k).
- Recommended offer: $147k (10.1% below list) — sets the bar for cash-flow.
Location & tenants
- Location reads 79/100 on livability (#135 in FL, #2,039 nationally) — a middle-class / working-renter tenant base. Strengths: employment A+, housing A+, health & safety A+; Watch: cost of living C-, amenities F, commute F.
- Palm Beach (suburban): math 46% / reading 53% proficiency, ranked #34 of 73 in FL (top 47%) — families likely to look elsewhere, expect single-tenant / working-renter base with shorter leases.
- Zoned schools: Cypress Trails Elementary School (math 52% / reading 62%, grade C+, #781 of 2,144 statewide, top 38%, 492 students, 53% FRL); Crestwood Community Middle (math 49% / reading 52%, grade C, #246 of 571 statewide, top 44%, 724 students, 50% FRL); Royal Palm Beach High School (math 22% / reading 38%, grade F, #441 of 667 statewide, top 67%, 2,343 students, 57% FRL) — zoned schools at 54% FRL track the district average.
- Market conditions: Rents flat; 583 active listings in the ZIP; 5 comparable units currently listed for rent nearby; rentals leasing fast (median 13d on market — plan ~1-2 weeks tenant-placement turnaround); solid renter incomes; 3,974 units permitted in Palm Beach County in 2024 (1,012 in 5+ unit buildings).
Forward outlook
- In year one you build about $18k of equity ($1k loan paydown + $16k appreciation (10.0% local appreciation)).
- Palm Beach County population projected at +30% by 2050 — long-run rental-demand tailwind backs the buy-and-hold thesis.
- By year 3, paydown + projected appreciation supports a ~$44k cash-out refi (75% LTV) — recoverable capital for the next deal without selling this one.
Negotiation context
- It's been on market 80 days — a 6% lower offer ($154k) is reasonable based on typical stale-listing flexibility.
- 4 sale attempts since 26y ago; this cycle's ask has dropped $11k (6%) from the opening price — seller is motivated, your offer sets the floor, not the list.
- Current owner paid $35k; list at $164k implies a 368% gain — meaningful room to come down on a strong offer.
Risks & watch-outs
- Climate carrying-cost: severe wind risk, 99% chance of damaging wind over 30y; extreme-heat days projected 7→27/yr by 2055 (HVAC capex compounding) — expect insurance premiums to compound above CPI over the hold.
Questions for the listing agent
- What do current leases actually rent for vs. the listed asking? Can we see a recent rent roll and the last 12 months of T-12 income?
- It's been on market 80 days. Have you received any prior offers? Is the seller open to a 10% concession, seller financing, or rate buy-down credit?
- Built in 1967 — when were the roof, HVAC, electrical panel, plumbing, and water heater last replaced?
- What does the HOA fee cover, when was the last increase, and are there any pending special assessments or reserve-fund shortfalls?
- Any open or pending special assessments — roof, HVAC, plumbing, elevator, façade? What's the per-unit balance and payoff schedule, and is the seller paying it off at close or rolling it to the buyer?
- Why hasn't it sold? Are there any deal-killer items the seller is aware of (foundation, flood, title, zoning, code violations)?
- Is there a deadline driving the sale (1031 exchange, divorce, estate, relocation)? That informs how much negotiation room exists.
- Schools are B-rated — typically a magnet for longer-tenancy family renters. What's the average tenant stay here, and is there a school-zone premium baked into asking?
- The area grade is low — what's the realistic commute time and amenity access for the typical tenant pool here? Any planned neighborhood developments (good or bad) we should know about?
- What's the average days-on-market for RENTAL listings here right now (not sales)? A rising rental-DOM trend means longer vacancies and softer asking-rent achievability than the comps imply.
- What's the recent tenant-quality profile in this submarket — average credit score on applications, eviction rate, late-payment / NSF rate, and stable-employment percentage? A property-management company in the area should have these aggregated.
- How much new apartment / multifamily construction is in the pipeline within 1–3 miles? Heavy new supply (>2% of stock underway) typically softens rents 12–24 months out; light construction supports rent growth.
Investment metrics
- 1% rule
- 1.04% ✓
- Cap rate
- 5.45%
- Cash-on-cash
- -3.00%
- DSCR
- 0.87
- GRM
- 8.0
CMA / ARV
No comps found within radius.
Projected returns pro-forma
10.0% appreciation · 0.85% rent growth · sell at horizon
- IRR
- 21.3%
- Equity multiple
- 2.71×
- Total profit
- $78,557
- Equity at exit
- $147,654
- IRR
- 18.7%
- Equity multiple
- 6.03×
- Total profit
- $230,821
- Equity at exit
- $318,422
Cash invested: $45,892 (down + closing). Projections, not guarantees.
Landlord ↔ Tenant lean methodology
- Overall (STATE)
- 87 Strongly Landlord-Friendly
- State Florida
- 87 Strongly Landlord-Friendly · R+3
- County
- — inherits STATE
- City
- — inherits STATE
ZIP-level market 33411
- Home prices YoY
- 1.9%
- Rents YoY
- 0.8%
- Active inventory
- 583
- Price-to-rent
- 8.0×
Monthly cashflow live
- Estimated rent
- $1,711 high interval (Pro) →
- Mortgage (P&I)
- −$860
- Tax est. 1.5%
- −$205 /mo · $2,458/yr
- Insurance
- −$68
- HOA
- −$334
- Vacancy / Maint / Mgmt
- −$359
- Net cashflow
- $-115
Break-even live
Sensitivity live
| Price | -10% $-2 | -5% $-58 | +0% $-115 | +5% $-171 | +10% $-228 |
|---|---|---|---|---|---|
| Rent | -10% $-250 | -5% $-182 | +0% $-115 | +5% $-47 | +10% $20 |
| Rate | -1.0pp $-32 | -0.5pp $-73 | base $-115 | +0.5pp $-157 | +1.0pp $-201 |
UW: 25.0% down · 7.5% · 30yr · 1.5% tax · 5.0% vac · 8.0% maint · 8.0% mgmt
Financing live
Cash to close
- Down payment
- $40,975
- Closing costs
- $4,917
- Reserves months
- —
- Total cash needed
- —
Loan-product check · same deal, 3 products live
Conventional
25% down · 7.5% · 30yr
- Down + closing
- —
- Monthly P&I
- —
- Monthly cashflow
- —
- DSCR
- —
- Eligible?
- —
Personal DTI + credit; lowest rate.
DSCR
20% down · 8.5% · 30yr
- Down + closing
- —
- Monthly P&I
- —
- Monthly cashflow
- —
- DSCR
- —
- Eligible?
- —
No personal income docs; deal must DSCR.
Hard money
10% down · 12.0% · 12mo
- Down + closing
- —
- Monthly P&I
- —
- Monthly cashflow
- —
- DSCR
- —
- Eligible?
- —
Short-term bridge; refi at stabilization.
Rent comps 5 comps
| Address | Beds | Baths | Sqft | Rent | $/sqft | DOM | Units | Dist |
|---|---|---|---|---|---|---|---|---|
| 149 West Ct Royal Palm Beach, FL | 1.0 | 1.0 | 648 | $1,800 | $2.78 | 1d | 1 | 0.02mi |
| 149 West Ct Royal Palm Beach, FL | 1.0 | 1.0 | 648 | $1,800 | $2.78 | 12d | 1 | 0.02mi |
| 12009 Poinciana Blvd #102 Royal Palm Beach, FL | 1.0 | 1.0 | 660 | $1,500 | $2.27 | 26d | 1 | 0.11mi |
| 12021 W Greenway Dr #101 Royal Palm Beach, FL | 1.0 | 1.5 | 660 | $1,400 | $2.12 | 26d | 1 | 0.18mi |
| 11020 Town Cir Wellington, FL | 1.0–3.0 | 1.0–2.0 | 1013 | $2,146 | $2.12 | 3d | 14 | 1.47mi |
HOA detail condo
- Monthly dues
- $334 · $4,008/yr
- Likely covers
- pool
- Assessments
- None detected in remarks — confirm with the listing agent.
Listing history 28 events
-
2026-06-21pricedays on market $163,900 Active 80 DOM
-
2026-06-18days on market $167,500 Active 77 DOM
-
2026-06-17days on market $167,500 Active 76 DOM
-
2026-06-16days on market $167,500 Active 75 DOM
-
2026-06-15days on market $167,500 Active 74 DOM
-
2026-06-13days on market $167,500 Active 72 DOM
-
2026-06-09days on market $167,500 Active 68 DOM
-
2026-06-08days on market $167,500 Active 67 DOM
-
2026-06-07days on market $167,500 Active 66 DOM
-
2026-06-04days on market $167,500 Active 63 DOM
-
2026-06-03days on market $167,500 Active 62 DOM
-
2026-06-02days on market $167,500 Active 61 DOM
-
2026-06-01days on market $167,500 Active 60 DOM
-
2026-05-31days on market $167,500 Active 59 DOM
-
2026-05-18price $167,500
-
2026-05-01price $170,000
-
2026-04-02$175,000 Active
-
2026-03-15historical
-
2025-10-16historical
-
2025-10-14$180,000 Active
-
2025-09-23$195,000 Active
-
2025-09-17historical
-
2000-12-05soldstatus $35,000
-
2000-11-30soldstatus $35,000
-
2000-10-26historical
-
2000-05-12$36,900
-
1994-01-18soldstatus $25,000
-
1993-08-16soldstatus $25,000
ⓘ Source: listings_history table (triggers on properties + properties_extension) + one-shot
backfill from property_details.listing_events for pre-trigger history.
Climate risk First Street
- Flood 1/10 Low FEMA zone X (unshaded) · 0% chance over 30 yrs
- Wildfire 1/10 Low
- Heat 10/10 Extreme 7 d/yr ≥107°F today · 27 d/yr by 30 yrs out
- Wind 10/10 Extreme 99% chance of damaging wind over 30 yrs
- Air quality 2/10 Low 0 unhealthy d/yr today · 1 by 30 yrs out
Nearby sold comps map
Loading sold comps map…
Walkable amenities ~0.75 mi
Loading nearby amenities…
Taxation est. · year 1
- Rental income
- $20,534
- − Mortgage interest
- −$9,181
- − Property taxes
- −$2,458
- − Insurance
- −$820
- − Repairs & maintenance
- −$1,643
- − Management
- −$1,643
- − HOA
- −$4,008
- − Depreciation
- −$4,768
- Taxable loss
- −$3,986
- Est. tax savings @ 24.0%
- +$957
- After-tax cash flow
- $-421/yr
For passive investors: Depreciation is non-cash, so a rental often shows a tax loss while cash-flowing — sheltering income. Rental losses are passive: they offset passive income freely, and up to $25,000/yr can offset ordinary (W-2) income if you actively participate and your MAGI is under $100k (phasing out to $0 by $150k); unused losses carry forward. On sale, claimed depreciation is recaptured at up to 25%, and gains may owe capital-gains tax (a 1031 exchange can defer both). Figures are a year-1 estimate at your 24.0% rate — not tax advice; consult a CPA.
Schools (NCES district)
- District
- Palm Beach
- NCES district ID
- 1201500
- Math proficiency
- 46% ▼ -16.00%
- Reading proficiency
- 53% ▼ -4.00%
- Median HH income
- $53,943
- Composite
- 42.72/100
- National rank
- #3160
- State rank
- #34 of 73 in FL
Livability — Royal Palm Beach
- Score
- 79/100
- State rank
- #135
- US rank
- #2039
Category grades
Schools grade is shown separately in the Schools card above.
Census & demographics
- Census place
- Royal Palm Beach, FL
- County
- Palm Beach County · 1,438,312 people
- City population
- 75,299
- Metro
- Miami-Fort Lauderdale-Pompano Beach, FL
- Population (ZIP)
- 76,863
- Household income
- $92,591
- Rent vs Own
- Severe rent burden
- 1870.0
Population outlook (Palm Beach County) Hauer SSP2
- Today (2025)
- 1,637,487 people
- By 2030
- 1,743,255 · +6.5%
- By 2040
- 1,948,712 · +19.0%
- By 2050
- 2,132,979 · +30.3%
- By 2075
- 2,530,027 · +54.5%
- By 2100
- 2,706,979 · +65.3%
Race, ethnicity, and origin ACS 2023
- Neighborhood character
- Diverse neighborhood (Simpson 0.70)
- Race & ethnicity
- White 44% Hispanic / Latino 24% Black 23% Two or more races 16% Asian 5%
- Hispanic origin (detail)
- Mexican 2% Puerto Rican 5% Cuban 4% Dominican 2%
- Common ancestry
- Hispanic 6% Romanian 2% Italian 1%
- Foreign-born
- 26% · Canada, Jamaica, China
- Languages at home
- 73% English-only · Spanish 17% French/Haitian/Cajun 4% Other Indo-European 2%
Political lean MEDSL · Palm Beach
- 2024 margin
- Toss-up / Even · D 50.0% · R 49.2%
- 2008→2024 swing
- -22.1pp toward R · 2008: 22.9pp · 2024: 0.8pp
- All cycles
- 2024: D+0.8 2020: D+12.8 2016: D+15.3 2012: D+17.0 2008: D+22.9
Not yet ingested
- Civics
- —
Market trends
- HPI YoY
- ▲ 17.04%
- Current HPI
- 903.78
- Rent YoY
- ▲ 0.85%
- Metro
- Miami-Fort Lauderdale-Pompano Beach, FL
- State GDP YoY
- ▲ 3.28%
- F500 in state
- 36
Industry mix (Fortune 500 HQ in FL)
| Industry | F500 HQs | Revenue |
|---|---|---|
| Industrial Technology | 2 | $29B |
|
||
| Insurance | 2 | $17B |
|
||
| Retail | 1 | $60B |
|
||
| Technology Distribution | 1 | $58B |
|
||
| Homebuilding | 1 | $35B |
|
||
| Technology Manufacturing | 1 | $35B |
|
||
Price history
+570.0% since first listed14 events — show timeline
- 2026-05-18 Price Changed $167,500 Beaches MLS
- 2026-05-01 Price Changed $170,000 Beaches MLS
- 2026-04-02 Listed $175,000 Beaches MLS
- 2026-03-15 Listing Removed — Beaches MLS
- 2025-10-16 Listing Removed — Beaches MLS
- 2025-10-14 Listed $180,000 Beaches MLS
- 2025-09-23 Listed $195,000 Beaches MLS
- 2025-09-17 Coming Soon — Beaches MLS
- 2000-12-05 Sold (Public Records) $35,000 Public Records
- 2000-11-30 Sold (MLS) $35,000 Beaches MLS
- 2000-10-26 Listing Removed — Beaches MLS
- 2000-05-12 Listed $36,900 Beaches MLS
- 1994-01-18 Sold (Public Records) $25,000 Public Records
- 1993-08-16 Sold (Public Records) $25,000 Public Records
Property tax history
-8.3%/yrLatest (2025): $186 · +13.3% YoY. Source: county tax records.
Cash-flow waterfall
monthlySold comps — $/sqft
last 12 mo · ≤1 miLoading sold comps…