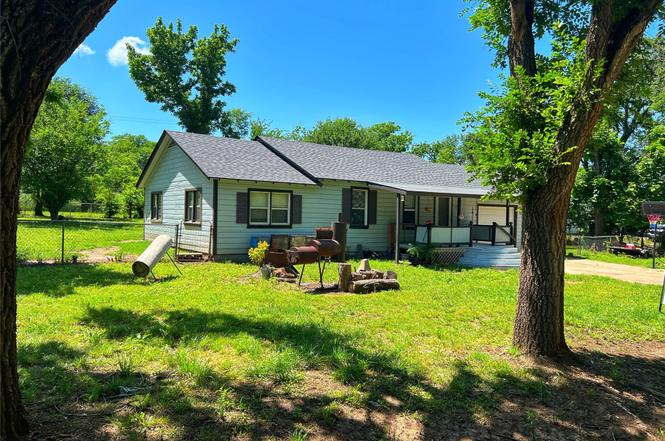
143 Columbus Ave · Pawhuska, OK
Flood risk 1/10 · Minimal
- FEMA flood zone
- X (unshaded)
- Chance of flooding over 30 yrs
- 0.0%
- Est. flood insurance / yr
- $507 – $1,088
Fire risk 10/10 · Severe
- Est. fire insurance / yr
- $2,463 – $4,575
Heat risk 5/10 · Moderate
- Hot days now (above 111°F)
- 7 days/yr
- Hot days in 30 yrs
- 19 days/yr
Wind risk 2/10 · Minimal
- Chance of severe wind over 30 yrs
- 2.0%
Air-quality risk 2/10 · Minimal
- Unhealthy air days now
- 1 days/yr
- Unhealthy air days in 30 yrs
- 3 days/yr
Risk factors via First Street. Map © Google.
Why this score? — see what drove the B grade
The composite is a weighted blend of 9 inputs, each scored 0–100. Each bar is that input's sub-score; the figure is the points it added to the 100-point composite (weight × sub-score).
- Cash flow +30.0/30.0
- DSCR +10.0/10.0
- 1% rule +7.9/10.0
- Appreciation +7.8/10.0
- ARV discount +7.5/15.0
- Livability +3.5/5.0
- Rent growth +2.5/5.0
- Condition / age +2.5/5.0
- Schools +0.9/10.0
$82,950
🖨 Deal sheet (PDF) 📄 Offer letter ✓ Due diligence
Listing remarks
New Roof! Move in Ready near everything Pawhuska has to offer! This 3-bedroom, 1-bath home is move-in ready, with plenty of room for updates to make it your own. Whether you’re a first-time buyer, investor, or someone looking for a home with character and potential, this property checks all the right boxes. Enjoy relaxing on the covered front porch, and take advantage of the extra-large, chain-link fenced backyard—perfect for pets, gardening, or outdoor gatherings. The home also features an oversized two-car garage, providing ample space for vehicles, storage, or a workshop. Additional highlights include central heat and air and a storm shelter for added peace of mind. Conven
Key facts
- 0.44 acre lot
- 2 garage spots
- Built 1970
Property features AI
Exterior
- Parking: Attached 2-car garage
- Security: Storm shelter
- Utilities: Public water; Public sewer; Electricity available; Natural gas available; Cable available; Phone available
- Home design: Single-story; Faces east; Crawlspace foundation
- Construction: HardiPlank and wood frame construction; Asphalt/fiberglass roof
- Exterior features: Covered porch; Concrete driveway; Chain link fencing; Storm shelter; Mature trees on lot
Interior
- Kitchen: Dishwasher; Disposal; Oven/Range/Stove; Gas water heater
- Flooring: Hardwood; Vinyl
- Bathrooms: 1 full bathroom
- Heating & cooling: Central heating (gas); Central air conditioning
- Interior features: Butcher block and laminate counters; Ceiling fan(s); Aluminum window frames; Gas range connection
- Laundry & utility: Washer hookup; Electric dryer hookup; Gas dryer hookup
Neighborhood map
What this means for you Summary
Snapshot
- This is a 3-bed/1.0-bath single-family listed at $83k.
Deal economics
- At list price, monthly cash flow is $318 ($4k/yr) — positive.
- The deal already cash-flows at list — no discount required.
- Meets the 1% rule at list price ($1k rent vs $83k).
- Recommended offer: $73k (12.0% below list) — sets the bar for market timing.
Location & tenants
- Location reads 70/100 on livability (#37 in OK) — a middle-class / working-renter tenant base. Strengths: cost of living A+, housing A+, health & safety A+; Watch: crime D+, amenities F, commute F.
- Pawhuska (town): math 9% / reading 13% proficiency, ranked #248 of 270 in OK (top 92%) — low school quality limits family demand, transient renter base, plan for 1-2y turnover; 61% free/reduced lunch — lower-income household profile, screen leases tightly.
- Zoned schools: Indian Camp Es (172 students, 0% FRL); Pawhuska Ms (math 2% / reading 12%, grade F, #311 of 345 statewide, top 92%, 152 students, 0% FRL); Pawhuska Hs (math 5% / reading 15%, grade F, #361 of 447 statewide, top 94%, 219 students, 0% FRL) — zoned schools average 0% FRL vs 61% district-wide (61 pts lower); this property's tenant base skews higher-income than the district average.
- Market conditions: 33 active listings in the ZIP; 89 units permitted in Osage County in 2024 (0 in 5+ unit buildings).
Forward outlook
- In year one you build about $5k of equity ($574 loan paydown + $5k appreciation (5.7% local appreciation)).
- Osage County population projected to shrink 6% by 2050 — rents likely to lag national; underwrite the cash flow, not the appreciation.
- At projected returns (5.7% appreciation + 3.0% rent growth), your $23k cash investment doubles in ~3 years — after that, you're playing with house money.
- By year 7, paydown + projected appreciation supports a ~$35k cash-out refi (75% LTV) — recoverable capital for the next deal without selling this one.
Negotiation context
- It's been on market 128 days — a 12% lower offer ($73k) is reasonable based on typical stale-listing flexibility.
- Current owner paid $30k; list at $83k implies a 181% gain — meaningful room to come down on a strong offer.
Risks & watch-outs
- Climate carrying-cost: severe wildfire risk; extreme-heat days projected 7→19/yr by 2055 (HVAC capex compounding) — expect insurance premiums to compound above CPI over the hold.
Questions for the listing agent
- It's been on market 128 days. Have you received any prior offers? Is the seller open to a 12% concession, seller financing, or rate buy-down credit?
- Built in 1970 — when were the roof, HVAC, electrical panel, plumbing, and water heater last replaced?
- Why hasn't it sold? Are there any deal-killer items the seller is aware of (foundation, flood, title, zoning, code violations)?
- Is there a deadline driving the sale (1031 exchange, divorce, estate, relocation)? That informs how much negotiation room exists.
- Schools are F-rated, which usually means shorter tenancies and higher turnover. Who's the typical renter profile here, and what's been the actual vacancy rate?
- Crime grade is D in this area — have there been break-ins, vandalism, or insurance claims at this property in the last 3 years? What carrier currently insures it and at what premium?
- What's the average days-on-market for RENTAL listings here right now (not sales)? A rising rental-DOM trend means longer vacancies and softer asking-rent achievability than the comps imply.
- What's the recent tenant-quality profile in this submarket — average credit score on applications, eviction rate, late-payment / NSF rate, and stable-employment percentage? A property-management company in the area should have these aggregated.
- How much new for-sale + rental construction is in the pipeline within 1–3 miles? Heavy new supply typically softens prices + rents 12–24 months out; constrained supply supports both.
Investment metrics
- 1% rule
- 1.29% ✓
- Cap rate
- 10.89%
- Cash-on-cash
- 16.42%
- DSCR
- 1.73
- GRM
- 6.5
CMA / ARV
No comps found within radius.
Projected returns pro-forma
5.7% appreciation · 3.0% rent growth · sell at horizon
- IRR
- 28.5%
- Equity multiple
- 2.84×
- Total profit
- $42,710
- Equity at exit
- $50,578
- IRR
- 26.8%
- Equity multiple
- 5.74×
- Total profit
- $110,166
- Equity at exit
- $90,397
Cash invested: $23,226 (down + closing). Projections, not guarantees.
Landlord ↔ Tenant lean methodology
- Overall (STATE)
- 83 Strongly Landlord-Friendly
- State Oklahoma
- 83 Strongly Landlord-Friendly · R+20
- County
- — inherits STATE
- City
- — inherits STATE
ZIP-level market 74056
- Home prices YoY
- 2.0%
- Active inventory
- 33
- Price-to-rent
- 6.5×
Monthly cashflow live
- Estimated rent
- $1,069 medium interval (Pro) →
- Mortgage (P&I)
- −$435
- Tax from tax record
- −$57 /mo · $680/yr
- Insurance
- −$35
- HOA
- −$0
- Vacancy / Maint / Mgmt
- −$224
- Net cashflow
- $318
Break-even live
Sensitivity live
| Price | -10% $365 | -5% $341 | +0% $318 | +5% $294 | +10% $271 |
|---|---|---|---|---|---|
| Rent | -10% $233 | -5% $276 | +0% $318 | +5% $360 | +10% $402 |
| Rate | -1.0pp $360 | -0.5pp $339 | base $318 | +0.5pp $296 | +1.0pp $275 |
UW: 25.0% down · 7.5% · 30yr · 1.5% tax · 5.0% vac · 8.0% maint · 8.0% mgmt
Financing live
Cash to close
- Down payment
- $20,738
- Closing costs
- $2,488
- Reserves months
- —
- Total cash needed
- —
Loan-product check · same deal, 3 products live
Conventional
25% down · 7.5% · 30yr
- Down + closing
- —
- Monthly P&I
- —
- Monthly cashflow
- —
- DSCR
- —
- Eligible?
- —
Personal DTI + credit; lowest rate.
DSCR
20% down · 8.5% · 30yr
- Down + closing
- —
- Monthly P&I
- —
- Monthly cashflow
- —
- DSCR
- —
- Eligible?
- —
No personal income docs; deal must DSCR.
Hard money
10% down · 12.0% · 12mo
- Down + closing
- —
- Monthly P&I
- —
- Monthly cashflow
- —
- DSCR
- —
- Eligible?
- —
Short-term bridge; refi at stabilization.
Listing history 21 events
-
2026-06-16status $82,950 Pending 128 DOM
-
2026-06-15days on market $82,950 Active 128 DOM
-
2026-06-14days on market $82,950 Active 126 DOM
-
2026-06-12days on market $82,950 Active 125 DOM
-
2026-06-09days on market $82,950 Active 122 DOM
-
2026-06-08days on market $82,950 Active 121 DOM
-
2026-06-07days on market $82,950 Active 120 DOM
-
2026-06-05days on market $82,950 Active 117 DOM
-
2026-06-03days on market $82,950 Active 116 DOM
-
2026-06-02days on market $82,950 Active 115 DOM
-
2026-06-01days on market $82,950 Active 114 DOM
-
2026-05-31days on market $82,950 Active 113 DOM
-
2026-05-30days on market $82,950 Active 112 DOM
-
2026-05-22status Pending
-
2026-03-17price $82,950
-
2026-01-31$90,000 Active
-
2004-06-29soldstatus $29,500
-
2002-01-17soldstatus $24,000
-
1998-09-10soldstatus $21,500
-
1995-10-29soldstatus $14,000
-
1995-10-29soldstatus $30,000
ⓘ Source: listings_history table (triggers on properties + properties_extension) + one-shot
backfill from property_details.listing_events for pre-trigger history.
Tax reassessment forecast OK · Resets to sale price
- Current annual tax
- $680 · $57/mo
- Projected year-2 tax
- $747 · $62/mo
- Expected delta
- +$67/yr (+$6/mo · 9.8%)
ⓘ Screening estimate from a state-policy table — verify with the county assessor before closing.
Climate risk First Street
- Flood 1/10 Low FEMA zone X (unshaded) · 0% chance over 30 yrs
- Wildfire 10/10 Extreme
- Heat 5/10 Major 7 d/yr ≥111°F today · 19 d/yr by 30 yrs out
- Wind 2/10 Low 2% chance of damaging wind over 30 yrs
- Air quality 2/10 Low 1 unhealthy d/yr today · 3 by 30 yrs out
Nearby sold comps map
Loading sold comps map…
Walkable amenities ~0.75 mi
Loading nearby amenities…
Taxation est. · year 1
- Rental income
- $12,822
- − Mortgage interest
- −$4,646
- − Property taxes
- −$680
- − Insurance
- −$415
- − Repairs & maintenance
- −$1,026
- − Management
- −$1,026
- − Depreciation
- −$2,413
- Taxable income
- $2,616
- Est. tax owed @ 24.0%
- −$628
- After-tax cash flow
- $3,187/yr
For passive investors: Depreciation is non-cash, so a rental often shows a tax loss while cash-flowing — sheltering income. Rental losses are passive: they offset passive income freely, and up to $25,000/yr can offset ordinary (W-2) income if you actively participate and your MAGI is under $100k (phasing out to $0 by $150k); unused losses carry forward. On sale, claimed depreciation is recaptured at up to 25%, and gains may owe capital-gains tax (a 1031 exchange can defer both). Figures are a year-1 estimate at your 24.0% rate — not tax advice; consult a CPA.
Schools (NCES district)
- District
- Pawhuska
- NCES district ID
- 4023580
- Math proficiency
- 9% ▼ -6.00%
- Reading proficiency
- 13% ▼ -8.00%
- Median HH income
- $34,773
- Composite
- 8.98/100
- National rank
- #9883
- State rank
- #248 of 270 in OK
Livability — Pawhuska
- Score
- 70/100
- State rank
- #37
- US rank
- #7514
Category grades
Schools grade is shown separately in the Schools card above.
Census & demographics
- Census place
- Pawhuska, OK
- Population (ZIP)
- 4,874
Population outlook (Osage County) Hauer SSP2
- Today (2025)
- 48,950 people
- By 2030
- 48,936 · +-0.0%
- By 2040
- 47,826 · -2.3%
- By 2050
- 45,781 · -6.5%
- By 2075
- 41,140 · -16.0%
- By 2100
- 32,796 · -33.0%
Race, ethnicity, and origin ACS 2023
- Neighborhood character
- Diverse neighborhood (Simpson 0.64)
- Race & ethnicity
- White 59% Native American 27% Two or more races 11% Hispanic / Latino 4%
- Common ancestry
- Italian 3% Lithuanian 2% Iranian 2%
- Foreign-born
- 1% · Canada, Vietnam
- Languages at home
- 95% English-only · Spanish 3%
Political lean MEDSL · Osage
- 2024 margin
- Solid R (+41.4) · D 28.4% · R 69.8% · Other 1.7%
- 2008→2024 swing
- -17.7pp toward R · 2008: -23.7pp · 2024: -41.4pp
- All cycles
- 2024: R+41.4 2020: R+39.5 2016: R+36.8 2012: R+25.2 2008: R+23.7
Not yet ingested
- Civics
- —
Market trends
- HPI YoY
- ▲ 5.70%
- Current HPI
- 296.6482
- Rent YoY
- —
- Metro
- —
- State GDP YoY
- ▲ 1.55%
- F500 in state
- 6
Industry mix (Fortune 500 HQ in OK)
| Industry | F500 HQs | Revenue |
|---|---|---|
| Energy | 3 | $48B |
|
||
Price history
+492.5% since first listed8 events — show timeline
- 2026-05-22 Pending — MLS Technology, Inc.
- 2026-03-17 Price Changed $82,950 MLS Technology, Inc.
- 2026-01-31 Listed $90,000 MLS Technology, Inc.
- 2004-06-29 Sold (Public Records) $29,500 Public Records
- 2002-01-17 Sold (Public Records) $24,000 Public Records
- 1998-09-10 Sold (Public Records) $21,500 Public Records
- 1995-10-29 Sold (Public Records) $30,000 Public Records
- 1995-10-29 Sold (Public Records) $14,000 Public Records
Property tax history
+4.5%/yrLatest (2025): $680 · +5.1% YoY. Source: county tax records.
Cash-flow waterfall
monthlySold comps — $/sqft
last 12 mo · ≤1 miLoading sold comps…