16 Jackson Rd · Gurdon, AR
Flood risk No data
- FEMA flood zone
- —
- Chance of flooding over 30 yrs
- —
- Est. flood insurance / yr
- —
Fire risk No data
- Est. fire insurance / yr
- —
Heat risk No data
- Hot days now (above threshold)
- —
- Hot days in 30 yrs
- —
Wind risk No data
- Chance of severe wind over 30 yrs
- —
Air-quality risk No data
- Unhealthy air days now
- —
- Unhealthy air days in 30 yrs
- —
Risk factors via First Street. Map © Google.
Why this score? — see what drove the D+ grade
The composite is a weighted blend of 9 inputs, each scored 0–100. Each bar is that input's sub-score; the figure is the points it added to the 100-point composite (weight × sub-score).
- Cash flow +15.0/30.0
- ARV discount +7.5/15.0
- Appreciation +6.9/10.0
- 1% rule +5.0/10.0
- DSCR +5.0/10.0
- Livability +3.5/5.0
- Rent growth +2.5/5.0
- Schools +2.3/10.0
- Condition / age +1.0/5.0
$20,000
🖨 Deal sheet (PDF) 📄 Offer letter ✓ Due diligence
Listing remarks MLS
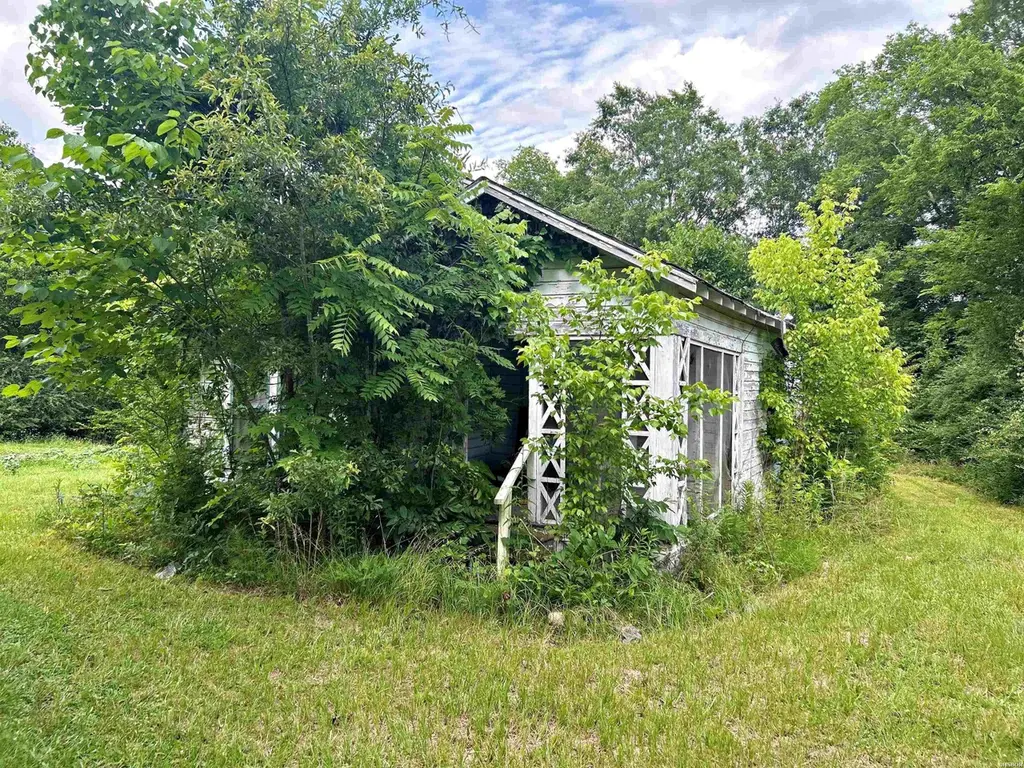
Fixer Upper. Great Lot!
Key facts
- 0.75 acre lot
- Built 1940
- Listed 36 days
Property features AI
Finance
- Financial info: Annual taxes around $158
Exterior
- Utilities: Public water; Septic system; Electric service from a co-op
- Home design: Single-story frame construction; Approximately 864 square feet
- Construction: Frame exterior; Crawl space foundation; 3-tab shingle roof; Built on tax-records acreage of about 0.75 acres (225' x 450')
- Exterior features: Level lot; Paved road access
Interior
- Flooring: Carpet; Tile
- Bathrooms: 1 full bathroom
- Heating & cooling: No heating; No cooling
- Interior features: Carpet and tile flooring
Neighborhood map
What this means for you Summary
Snapshot
- This is a 2-bed/1.0-bath single-family listed at $20k. Condition is rated poor.
Deal economics
- At list price, monthly cash flow is $532 ($6k/yr) — positive.
- The deal already cash-flows at list — no discount required.
- Meets the 1% rule at list price ($848 rent vs $20k).
- Recommended offer: $19k (3.0% below list) — sets the bar for market timing.
Location & tenants
- Location reads 69/100 on livability (#74 in AR) — a middle-class / working-renter tenant base. Strengths: cost of living A+, housing A+, health & safety A+; Watch: crime C-, employment D, amenities F.
- Arkadelphia School District (town): math 28% / reading 28% proficiency, ranked #167 of 238 in AR (top 70%) — low school quality limits family demand, transient renter base, plan for 1-2y turnover.
- Zoned schools: Louisa Perritt Primary (502 students, 65% FRL); Goza Middle School (math 30% / reading 30%, grade F, #139 of 201 statewide, top 71%, 418 students, 57% FRL); Arkadelphia High School (math 14% / reading 28%, grade F, #228 of 292 statewide, top 79%, 586 students, 46% FRL).
- Market conditions: 22 active listings in the ZIP; 12 units permitted in Clark County in 2024 (0 in 5+ unit buildings).
Forward outlook
- In year one you build about $889 of equity ($138 loan paydown + $751 appreciation (3.8% local appreciation)).
- At projected returns (3.8% appreciation + 3.0% rent growth), your $6k cash investment doubles in ~1 year — after that, you're playing with house money.
Negotiation context
- It's been on market 37 days — a 3% lower offer ($19k) is reasonable based on typical stale-listing flexibility.
- 2 sale attempts with the ask held roughly flat each time — persistent listings suggest the price (not the market) is what's stuck; bring a comps-based counter.
Risks & watch-outs
- Watch-outs: built in 1940 — expect roof / HVAC / electrical / plumbing capex.
Questions for the listing agent
- It's been on market 37 days. Have you received any prior offers? Is the seller open to a 3% concession, seller financing, or rate buy-down credit?
- Have any recent inspections been done? Can we get a copy of the seller's disclosures and any deferred-maintenance estimates?
- Built in 1940 — when were the roof, HVAC, electrical panel, plumbing, and water heater last replaced?
- Is there a deadline driving the sale (1031 exchange, divorce, estate, relocation)? That informs how much negotiation room exists.
- Schools are F-rated, which usually means shorter tenancies and higher turnover. Who's the typical renter profile here, and what's been the actual vacancy rate?
- The area grade is low — what's the realistic commute time and amenity access for the typical tenant pool here? Any planned neighborhood developments (good or bad) we should know about?
- What's the average days-on-market for RENTAL listings here right now (not sales)? A rising rental-DOM trend means longer vacancies and softer asking-rent achievability than the comps imply.
- What's the recent tenant-quality profile in this submarket — average credit score on applications, eviction rate, late-payment / NSF rate, and stable-employment percentage? A property-management company in the area should have these aggregated.
- How much new for-sale + rental construction is in the pipeline within 1–3 miles? Heavy new supply typically softens prices + rents 12–24 months out; constrained supply supports both.
Investment metrics
- 1% rule
- 4.24% ✓
- Cap rate
- 38.20%
- Cash-on-cash
- 113.95%
- DSCR
- 6.07
- GRM
- 2.0
CMA / ARV
- ARV (median comp)
- $44,501
- List price
- $20,000
- Delta
- -55.06%
- Verdict
- UNDERPRICED
- Comps
- 2 within 1.0 mi
Show comp detail 1 sale within ~0.75 mi
| Address | Dist | Beds/Ba | Sqft | Sold | Price | $/sf | Match |
|---|---|---|---|---|---|---|---|
| 108 Curtis Rd | 0.70mi | 2/1.0 | 800 (-7%) | 1mo | $32,500 | $41 | 54 |
Match score weights: distance 35% · size 25% · config 20% · recency 20%. Top-matched comps best support the ARV.
Projected returns pro-forma
3.76% appreciation · 3.0% rent growth · sell at horizon
- IRR
- —
- Equity multiple
- 7.63×
- Total profit
- $37,102
- Equity at exit
- $9,856
- IRR
- —
- Equity multiple
- 15.94×
- Total profit
- $83,662
- Equity at exit
- $15,897
Cash invested: $5,600 (down + closing). Projections, not guarantees.
Landlord ↔ Tenant lean methodology
- Overall (STATE)
- 92 Strongly Landlord-Friendly
- State Arkansas
- 92 Strongly Landlord-Friendly · R+14
- County
- — inherits STATE
- City
- — inherits STATE
ZIP-level market 71743
- Home prices YoY
- 2.6%
- Active inventory
- 22
- Price-to-rent
- 2.0×
Monthly cashflow live
- Estimated rent
- $848 medium interval (Pro) →
- Mortgage (P&I)
- −$105
- Tax est. 1.5%
- −$25 /mo · $300/yr
- Insurance
- −$8
- HOA
- −$0
- Vacancy / Maint / Mgmt
- −$178
- Net cashflow
- $532
Break-even live
Sensitivity live
| Price | -10% $546 | -5% $539 | +0% $532 | +5% $525 | +10% $518 |
|---|---|---|---|---|---|
| Rent | -10% $465 | -5% $498 | +0% $532 | +5% $565 | +10% $599 |
| Rate | -1.0pp $542 | -0.5pp $537 | base $532 | +0.5pp $527 | +1.0pp $521 |
UW: 25.0% down · 7.5% · 30yr · 1.5% tax · 5.0% vac · 8.0% maint · 8.0% mgmt
Financing live
Cash to close
- Down payment
- $5,000
- Closing costs
- $600
- Reserves months
- —
- Total cash needed
- —
Loan-product check · same deal, 3 products live
Conventional
25% down · 7.5% · 30yr
- Down + closing
- —
- Monthly P&I
- —
- Monthly cashflow
- —
- DSCR
- —
- Eligible?
- —
Personal DTI + credit; lowest rate.
DSCR
20% down · 8.5% · 30yr
- Down + closing
- —
- Monthly P&I
- —
- Monthly cashflow
- —
- DSCR
- —
- Eligible?
- —
No personal income docs; deal must DSCR.
Hard money
10% down · 12.0% · 12mo
- Down + closing
- —
- Monthly P&I
- —
- Monthly cashflow
- —
- DSCR
- —
- Eligible?
- —
Short-term bridge; refi at stabilization.
Listing history 19 events
-
2026-06-21days on market $20,000 Active 37 DOM
-
2026-06-19days on market $20,000 Active 35 DOM
-
2026-06-18days on market $20,000 Active 34 DOM
-
2026-06-17days on market $20,000 Active 33 DOM
-
2026-06-16days on market $20,000 Active 32 DOM
-
2026-06-15days on market $20,000 Active 31 DOM
-
2026-06-14days on market $20,000 Active 29 DOM
-
2026-06-12days on market $20,000 Active 28 DOM
-
2026-06-09days on market $20,000 Active 25 DOM
-
2026-06-08days on market $20,000 Active 24 DOM
-
2026-06-07days on market $20,000 Active 23 DOM
-
2026-06-07days on market $20,000 Active 22 DOM
-
2026-06-04days on market $20,000 Active 19 DOM
-
2026-06-02days on market $20,000 Active 18 DOM
-
2026-06-01days on market $20,000 Active 17 DOM
-
2026-05-31days on market $20,000 Active 16 DOM
-
2026-05-31days on market $20,000 Active 15 DOM
-
2026-05-15$20,000 New Listing 23-char remark
Show marketing remark (23 chars)
Fixer Upper. Great Lot!
-
2026-05-15$20,000 Active 23-char remark
Show marketing remark (23 chars)
Fixer Upper. Great Lot!
ⓘ Source: listings_history table (triggers on properties + properties_extension) + one-shot
backfill from property_details.listing_events for pre-trigger history.
Nearby sold comps map
Loading sold comps map…
Walkable amenities ~0.75 mi
Loading nearby amenities…
Taxation est. · year 1
- Rental income
- $10,177
- − Mortgage interest
- −$1,120
- − Property taxes
- −$300
- − Insurance
- −$100
- − Repairs & maintenance
- −$814
- − Management
- −$814
- − Depreciation
- −$582
- Taxable income
- $6,447
- Est. tax owed @ 24.0%
- −$1,547
- After-tax cash flow
- $4,834/yr
For passive investors: Depreciation is non-cash, so a rental often shows a tax loss while cash-flowing — sheltering income. Rental losses are passive: they offset passive income freely, and up to $25,000/yr can offset ordinary (W-2) income if you actively participate and your MAGI is under $100k (phasing out to $0 by $150k); unused losses carry forward. On sale, claimed depreciation is recaptured at up to 25%, and gains may owe capital-gains tax (a 1031 exchange can defer both). Figures are a year-1 estimate at your 24.0% rate — not tax advice; consult a CPA.
Condition & rehab AI · 2 photos
This property requires extensive repairs and maintenance, including roof and siding work, to become move-in ready. Landscaping and curb appeal improvements are also needed to increase its value.
Repairs flagged
- Major roof — Signs of significant damage
- Major exterior siding — Severe peeling and weathering
- Major landscaping — Overgrown vegetation needs trimming
Value-add opportunities
- Both landscaping and trimming — Improves curb appeal and property value
- Both roof repair — Essential for structural integrity and safety
- Both exterior siding repair — Enhances property appearance and value
Renovation cost estimate screening
| Repair item | Severity | Est. cost |
|---|---|---|
| roof · Signs of significant damage | Major | $15,000–50,000 |
| exterior siding · Severe peeling and weathering | Major | $15,000–50,000 |
| landscaping · Overgrown vegetation needs trimming | Major | $15,000–50,000 |
| Total estimated repair cost · 3 items | $45,000–150,000 |
Value-add ROI direction
- Both landscaping and trimming — Improves curb appeal and property value ↑
- Both roof repair — Essential for structural integrity and safety ↑
- Both exterior siding repair — Enhances property appearance and value ↑
ⓘ Cost ranges are severity-bucket heuristics (US national rule-of-thumb). Get contractor quotes + a written scope before underwriting a rehab budget.
Schools (NCES district)
- District
- Arkadelphia School District
- NCES district ID
- 0502430
- Math proficiency
- 28% ▼ -13.00%
- Reading proficiency
- 28% ▼ -12.00%
- Median HH income
- $35,116
- Composite
- 23.13/100
- National rank
- #7954
- State rank
- #167 of 238 in AR
Livability — Gurdon
- Score
- 69/100
- State rank
- #74
- US rank
- #8878
Category grades
Schools grade is shown separately in the Schools card above.
Census & demographics
- Population (ZIP)
- 3,252
Population outlook (Clark County) Hauer SSP2
- Today (2025)
- 22,335 people
- By 2030
- 22,306 · -0.1%
- By 2040
- 21,839 · -2.2%
- By 2050
- 21,961 · -1.7%
- By 2075
- 24,186 · +8.3%
- By 2100
- 25,897 · +15.9%
Race, ethnicity, and origin ACS 2023
- Neighborhood character
- Majority White (65%)
- Race & ethnicity
- White 65% Black 23% Hispanic / Latino 11% Two or more races 2%
- Hispanic origin (detail)
- Mexican 10%
- Common ancestry
- Lithuanian 7% Slovak 3% Scotch-Irish 2%
- Foreign-born
- 3% · Canada
- Languages at home
- 89% English-only · Spanish 9% Russian/Polish/Slavic 2%
Political lean MEDSL · Clark
- 2024 margin
- Strong R (+20.5) · D 38.6% · R 59.1% · Other 2.2%
- 2008→2024 swing
- -16.7pp toward R · 2008: -3.8pp · 2024: -20.5pp
- All cycles
- 2024: R+20.5 2020: R+14.0 2016: R+9.5 2012: R+6.4 2008: R+3.8
Not yet ingested
- Civics
- —
Market trends
- HPI YoY
- ▲ 3.76%
- Current HPI
- 149.1405
- Rent YoY
- —
- Metro
- —
- State GDP YoY
- ▲ 3.80%
- F500 in state
- 10
Industry mix (Fortune 500 HQ in AR)
| Industry | F500 HQs | Revenue |
|---|---|---|
| Retail | 1 | $681B |
|
||
| Food / Agriculture | 1 | $53B |
|
||
| Retail / Energy | 1 | $22B |
|
||
| Transportation / Logistics | 1 | $12B |
|
||
| Energy | 1 | $4B |
|
||
Price history
+0.0% since first listed2 events — show timeline
- 2026-05-15 Listed $20,000 HSBOR
- 2026-05-15 Listed $20,000 CARMLS
Cash-flow waterfall
monthlySold comps — $/sqft
last 12 mo · ≤1 miLoading sold comps…