 Triplex
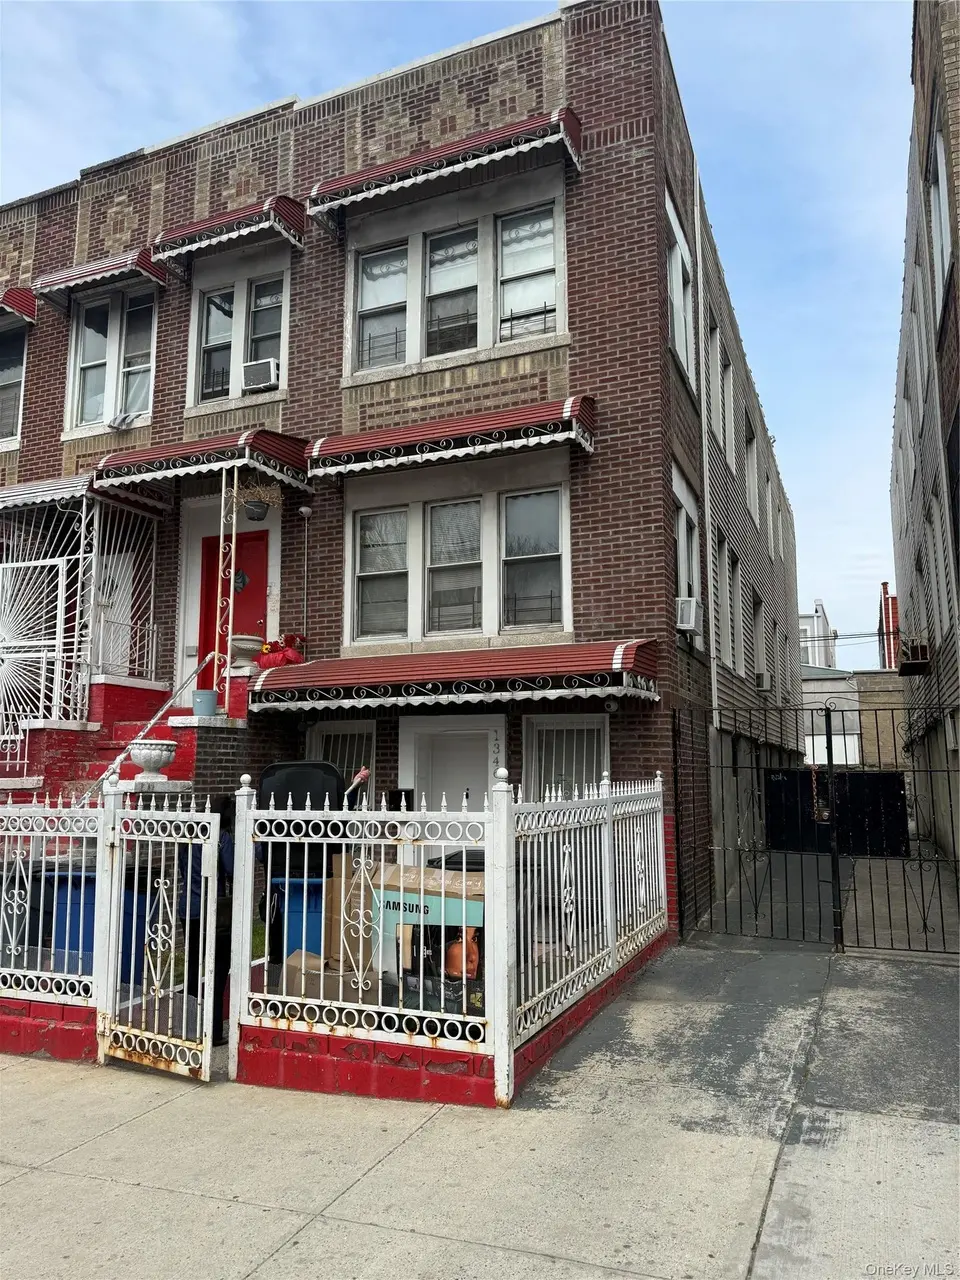
1346 Elder Ave · New York, NY
Flood risk 1/10 · Minimal
- FEMA flood zone
- X (unshaded)
- Chance of flooding over 30 yrs
- 0.0%
- Est. flood insurance / yr
- $507 – $1,088
Fire risk 1/10 · Minimal
- Est. fire insurance / yr
- $691 – $1,283
Heat risk 6/10 · Moderate
- Hot days now (above 99°F)
- 7 days/yr
- Hot days in 30 yrs
- 15 days/yr
Wind risk 6/10 · Moderate
- Chance of severe wind over 30 yrs
- 27.0%
Air-quality risk 4/10 · Minor
- Unhealthy air days now
- 5 days/yr
- Unhealthy air days in 30 yrs
- 6 days/yr
Risk factors via First Street. Map © Google.
Why this score? — see what drove the B- grade
The composite is a weighted blend of 9 inputs, each scored 0–100. Each bar is that input's sub-score; the figure is the points it added to the 100-point composite (weight × sub-score).
- Cash flow +24.2/30.0
- ARV discount +10.5/15.0
- DSCR +7.8/10.0
- Appreciation +7.0/10.0
- 1% rule +5.4/10.0
- Schools +5.0/10.0
- Livability +3.8/5.0
- Rent growth +2.5/5.0
- Condition / age +2.5/5.0
$999,000
🖨 Deal sheet 📄 Offer letter ✓ Due diligence
Multi-family units
County records classify this as Multi-Family (2-4 Unit). Listing-text estimate: 3 units. confirmed
Listing remarks
Excellent income generating opportunity with tremendous potential! This well-sized residential three-family property features two spacious 3-bedroom units and one 1-bedroom unit, offering strong rental income possibilities for investors or owner-occupants alike. Additional highlights include a attached 2-car garage and generous living space throughout. Conveniently located and full of upside potential, this property is being sold strictly as-is.
Key facts
- 2,500 sq ft lot
- 2 garage spots
- Built 1920
Property features AI
Exterior
- Parking: Attached parking; Driveway; 2-car garage
- Utilities: Electric service by Con-Edison; Public sewer; Natural gas connected
- Home design: Triplex; Total building area approximately 3100
- Construction: Block and vinyl siding construction
- Exterior features: Not waterfront; No additional parcels
Interior
- Bedrooms: One 1-bedroom unit; Two 3-bedroom units
- Bathrooms: Three full bathrooms
- Heating & cooling: Baseboard heating; Natural gas heating; Wall/window air conditioning units
- Interior features: Original details
Neighborhood map
What this means for you Summary
Snapshot
- This is a 3 × 2-bed/1.0-bath units multifamily listed at $999k.
Deal economics
- At list price, monthly cash flow is $2k ($24k/yr) — positive. Per door: $662/mo.
- The deal already cash-flows at list — no discount required.
- Meets the 1% rule at list price ($10k rent vs $999k).
- Recommended offer: $969k (3.0% below list) — sets the bar for market timing.
- Cap rate 8.7% vs local median 2.6% in New York — top-decile yield for the area; either an underpriced asset or a hidden risk that comps aren't pricing in. Stress-test before assuming the spread holds.
Location & tenants
- Location reads 75/100 on livability (#268 in NY, #4,188 nationally) — a middle-class / working-renter tenant base. Strengths: amenities A+, commute A+, health & safety A; Watch: crime F, cost of living F.
- Market conditions: 53 active listings in the ZIP; 6,929 units permitted in Bronx County in 2024 (6,829 in 5+ unit buildings).
Forward outlook
- In year one you build about $48k of equity ($7k loan paydown + $41k appreciation (4.1% local appreciation)).
- Bronx County population projected at +21% by 2050 — long-run rental-demand tailwind backs the buy-and-hold thesis.
- At projected returns (4.1% appreciation + 3.0% rent growth), your $280k cash investment doubles in ~4 years — after that, you're playing with house money.
- By year 2, paydown + projected appreciation supports a ~$77k cash-out refi (75% LTV) — recoverable capital for the next deal without selling this one.
Negotiation context
- It's been on market 34 days — a 3% lower offer ($969k) is reasonable based on typical stale-listing flexibility.
Risks & watch-outs
- Watch-outs: built in 1920 — expect roof / HVAC / electrical / plumbing capex.
- Climate carrying-cost: major wind risk, 27% chance of damaging wind over 30y; extreme-heat days projected 7→15/yr by 2055 (HVAC capex compounding) — expect insurance premiums to compound above CPI over the hold.
Questions for the listing agent
- It's been on market 34 days. Have you received any prior offers? Is the seller open to a 3% concession, seller financing, or rate buy-down credit?
- Can we see the unit-by-unit rent roll, current vacancy, and any below-market leases? What's the average tenancy length?
- What capital expenditures (roof, boiler, parking lot, exteriors) have been made in the last 5 years, and what's planned in the next 2?
- Built in 1920 — when were the roof, HVAC, electrical panel, plumbing, and water heater last replaced?
- Is there a deadline driving the sale (1031 exchange, divorce, estate, relocation)? That informs how much negotiation room exists.
- Schools are B-rated — typically a magnet for longer-tenancy family renters. What's the average tenant stay here, and is there a school-zone premium baked into asking?
- Crime grade is F in this area — have there been break-ins, vandalism, or insurance claims at this property in the last 3 years? What carrier currently insures it and at what premium?
- What's the average days-on-market for RENTAL listings here right now (not sales)? A rising rental-DOM trend means longer vacancies and softer asking-rent achievability than the comps imply.
- What's the recent tenant-quality profile in this submarket — average credit score on applications, eviction rate, late-payment / NSF rate, and stable-employment percentage? A property-management company in the area should have these aggregated.
- How much new apartment / multifamily construction is in the pipeline within 1–3 miles? Heavy new supply (>2% of stock underway) typically softens rents 12–24 months out; light construction supports rent growth.
Investment metrics
- 1% rule
- 1.04% ✓
- Cap rate
- 8.68%
- Cash-on-cash
- 8.52%
- DSCR
- 1.38
- GRM
- 8.0
CMA / ARV
- ARV (on-the-fly)
- $1,069,500
- Comps found
- 12
Show comp detail 12 sales within ~0.75 mi
| Address | Dist | Beds/Ba | Sqft | Sold | Price | $/sf | Match |
|---|---|---|---|---|---|---|---|
| 1506 E 172nd St | 0.14mi | 6/4.0 | 3,198 (+3%) | 2mo | $950,000 | $297 | 83 |
| 1238 Colgate Ave | 0.25mi | 5/2.0 (-1) | 2,802 (-10%) | 2mo | $835,000 | $298 | 62 |
| 1056 Longfellow Ave | 0.67mi | 7/4.0 (+1) | 3,200 (+3%) | 1mo | $1,175,000 | $367 | 53 |
| 1030 Elder Ave | 0.56mi | 6/3.0 | 2,970 (-4%) | 20mo | $950,000 | $320 | 50 |
| 1032 Longfellow Ave | 0.71mi | 7/4.0 (+1) | 3,200 (+3%) | 3mo | $1,200,000 | $375 | 50 |
| 990 Jennings St | 0.42mi | 7/5.0 (+1) | 3,300 (+6%) | 10mo | $990,000 | $300 | 48 |
| 1002 Boynton Ave | 0.62mi | 6/3.0 | 2,717 (-12%) | 4mo | $985,000 | $363 | 47 |
| 1439 Vyse Ave | 0.52mi | 6/4.0 | 3,375 (+9%) | 18mo | $1,000,000 | $296 | 42 |
| 1004 Boynton Ave | 0.61mi | 7/3.0 (+1) | 2,717 (-12%) | 5mo | $885,000 | $326 | 41 |
| 1337 Commonwealth Ave | 0.58mi | 6/2.0 | 2,680 (-14%) | 11mo | $1,075,000 | $401 | 37 |
| 1438 Saint Lawrence Ave | 0.67mi | 7/3.0 (+1) | 2,880 (-7%) | 22mo | $995,000 | $345 | 34 |
| 879 Elsmere Pl | 0.74mi | 7/4.0 (+1) | 2,700 (-13%) | 8mo | $1,020,000 | $378 | 29 |
Match score weights: distance 35% · size 25% · config 20% · recency 20%. Top-matched comps best support the ARV.
Projected returns pro-forma
4.08% appreciation · 3.0% rent growth · sell at horizon
- IRR
- 18.1%
- Equity multiple
- 2.09×
- Total profit
- $305,045
- Equity at exit
- $511,367
- IRR
- 18.7%
- Equity multiple
- 4.00×
- Total profit
- $839,464
- Equity at exit
- $840,282
Cash invested: $279,720 (down + closing). Projections, not guarantees.
Landlord ↔ Tenant lean methodology
- Overall (CITY)
- 0 Strongly Tenant-Friendly
- State New York
- 15 Strongly Tenant-Friendly · D+10
- County
- — inherits STATE
- City New York
- 0 Strongly Tenant-Friendly · D+34
ZIP-level market 10472
- Home prices YoY
- 1.8%
- Active inventory
- 53
- Price-to-rent
- 24.1×
Monthly cashflow live
- Estimated rent
- $10,363 medium interval (Pro) →
- Mortgage (P&I)
- −$5,239
- Tax from tax record
- −$545 /mo · $6,539/yr
- Insurance
- −$416
- HOA
- −$0
- Vacancy / Maint / Mgmt
- −$2,176
- Net cashflow
- $1,987
Break-even live
3-unit breakdown (identical units grouped — click to expand)
| Units | Beds | Baths | Est. rent |
|---|---|---|---|
| 3× units | 2 | 1 | $10,362 |
| #1 | 2 | 1 | $3,454 |
| #2 | 2 | 1 | $3,454 |
| #3 | 2 | 1 | $3,454 |
| Total (3 units) | $10,363 | ||
UW: 25.0% down · 7.5% · 30yr · 1.5% tax · 5.0% vac · 8.0% maint · 8.0% mgmt
Financing live
Cash to close
- Down payment
- $249,750
- Closing costs
- $29,970
- Reserves months
- —
- Total cash needed
- —
Loan-product check · same deal, 3 products live
Conventional
25% down · 7.5% · 30yr
- Down + closing
- —
- Monthly P&I
- —
- Monthly cashflow
- —
- DSCR
- —
- Eligible?
- —
Personal DTI + credit; lowest rate.
DSCR
20% down · 8.5% · 30yr
- Down + closing
- —
- Monthly P&I
- —
- Monthly cashflow
- —
- DSCR
- —
- Eligible?
- —
No personal income docs; deal must DSCR.
Hard money
10% down · 12.0% · 12mo
- Down + closing
- —
- Monthly P&I
- —
- Monthly cashflow
- —
- DSCR
- —
- Eligible?
- —
Short-term bridge; refi at stabilization.
Listing history 9 events
-
2026-06-10statusdays on market $999,000 Pending 34 DOM
-
2026-06-08days on market $999,000 Active 33 DOM
-
2026-06-08days on market $999,000 Active 32 DOM
-
2026-06-04days on market $999,000 Active 29 DOM
-
2026-06-03days on market $999,000 Active 28 DOM
-
2026-06-01days on market $999,000 Active 26 DOM
-
2026-05-31days on market $999,000 Active 25 DOM
-
2026-05-07$999,000 Active
-
2026-05-01historical $999,000
ⓘ Source: listings_history table (triggers on properties + properties_extension) + one-shot
backfill from property_details.listing_events for pre-trigger history.
Tax reassessment forecast NY · Partial reset (capped growth)
- Current annual tax
- $6,539 · $545/mo
- Projected year-2 tax
- $11,711 · $976/mo
- Expected delta
- +$5,172/yr (+$431/mo · 79.1%)
ⓘ Screening estimate from a state-policy table — verify with the county assessor before closing.
Climate risk First Street
- Flood 1/10 Low FEMA zone X (unshaded) · 0% chance over 30 yrs
- Wildfire 1/10 Low
- Heat 6/10 Major 7 d/yr ≥99°F today · 15 d/yr by 30 yrs out
- Wind 6/10 Major 27% chance of damaging wind over 30 yrs
- Air quality 4/10 Moderate 5 unhealthy d/yr today · 6 by 30 yrs out
Nearby sold comps map
Loading sold comps map…
Walkable amenities ~0.75 mi
Loading nearby amenities…
Taxation est. · year 1
- Rental income
- $124,356
- − Mortgage interest
- −$55,960
- − Property taxes
- −$6,539
- − Insurance
- −$4,995
- − Repairs & maintenance
- −$9,948
- − Management
- −$9,948
- − Depreciation
- −$29,062
- Taxable income
- $7,903
- Est. tax owed @ 24.0%
- −$1,897
- After-tax cash flow
- $21,944/yr
For passive investors: Depreciation is non-cash, so a rental often shows a tax loss while cash-flowing — sheltering income. Rental losses are passive: they offset passive income freely, and up to $25,000/yr can offset ordinary (W-2) income if you actively participate and your MAGI is under $100k (phasing out to $0 by $150k); unused losses carry forward. On sale, claimed depreciation is recaptured at up to 25%, and gains may owe capital-gains tax (a 1031 exchange can defer both). Figures are a year-1 estimate at your 24.0% rate — not tax advice; consult a CPA.
Schools (NCES district)
No district data.
Livability — New York
- Score
- 75/100
- State rank
- #268
- US rank
- #4188
Category grades
Schools grade is shown separately in the Schools card above.
Census & demographics
- Census place
- New York, NY
- City population
- 7,731,280
- Population (ZIP)
- 63,820
Population outlook (Bronx County) Hauer SSP2
- Today (2025)
- 1,607,353 people
- By 2030
- 1,681,852 · +4.6%
- By 2040
- 1,824,421 · +13.5%
- By 2050
- 1,945,470 · +21.0%
- By 2075
- 2,187,887 · +36.1%
- By 2100
- 2,244,136 · +39.6%
Race, ethnicity, and origin ACS 2023
- Neighborhood character
- Diverse neighborhood (Simpson 0.56)
- Race & ethnicity
- Hispanic / Latino 62% Black 23% Two or more races 9% Asian 8% White 2% Native American 1%
- Hispanic origin (detail)
- Mexican 8% Puerto Rican 20% Cuban 1% Dominican 20%
- Foreign-born
- 40% · Canada, Jamaica
- Languages at home
- 36% English-only · Spanish 52% Other Indo-European 7% French/Haitian/Cajun 2%
Political lean MEDSL · Bronx
- 2024 margin
- Solid D (+45.4) · D 72.7% · R 27.3%
- 2008→2024 swing
- -32.3pp toward R · 2008: 77.8pp · 2024: 45.4pp
- All cycles
- 2024: D+45.4 2020: D+67.6 2016: D+79.1 2012: D+82.9 2008: D+77.8
Not yet ingested
- Civics
- —
Market trends
- HPI YoY
- ▲ 4.08%
- Current HPI
- 236.8002
- Rent YoY
- —
- Metro
- —
- State GDP YoY
- ▲ 2.60%
- F500 in state
- 92
Industry mix (Fortune 500 HQ in NY)
| Industry | F500 HQs | Revenue |
|---|---|---|
| Financial Services | 10 | $950B |
|
||
| Consumer Goods | 9 | $162B |
|
||
| Insurance | 4 | $225B |
|
||
| Telecommunications | 2 | $144B |
|
||
| Pharmaceuticals | 2 | $112B |
|
||
| Media / Entertainment | 2 | $69B |
|
||
Price history
+0.0% since first listed2 events — show timeline
- 2026-05-07 Listed $999,000 OneKey® MLS as Distributed by MLS Grid
- 2026-05-01 Coming Soon $999,000 OneKey® MLS as Distributed by MLS Grid
Property tax history
+5.5%/yrLatest (2025): $6,539 · +6.3% YoY. Source: county tax records.
Cash-flow waterfall
monthlySold comps — $/sqft
last 12 mo · ≤1 miLoading sold comps…