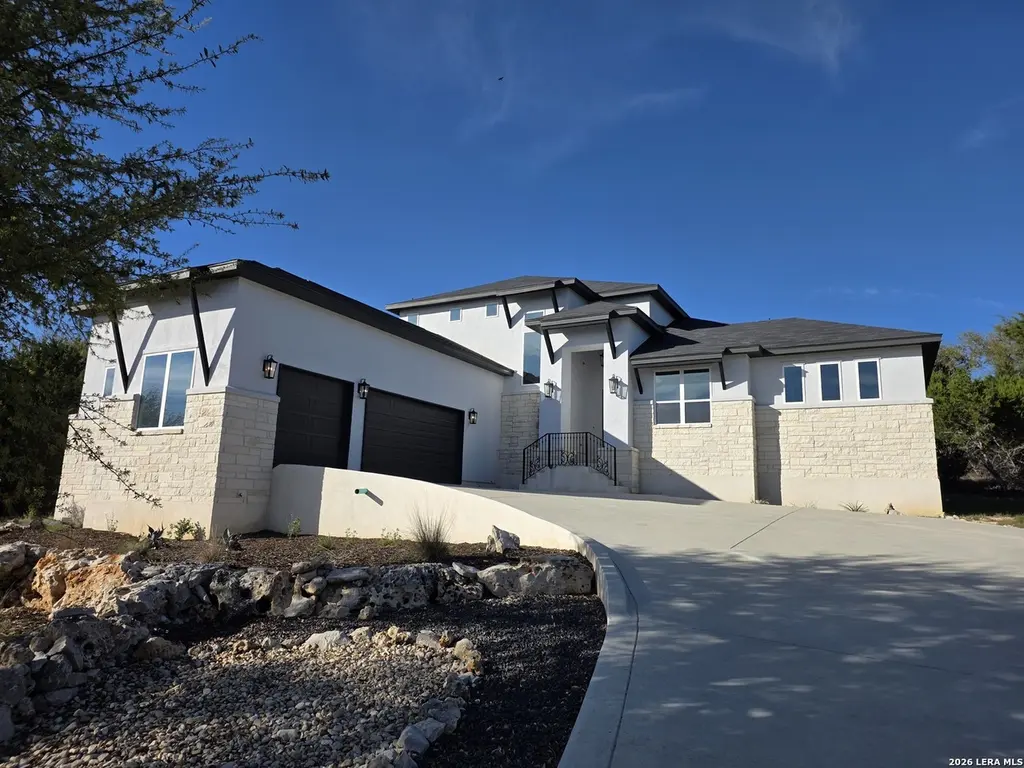
1103 Diretto Dr · Canyon Lake, TX
Flood risk 1/10 · Minimal
- FEMA flood zone
- X (unshaded)
- Chance of flooding over 30 yrs
- 0.0%
- Est. flood insurance / yr
- $507 – $1,088
Fire risk 5/10 · Moderate
- Est. fire insurance / yr
- $1,222 – $2,270
Heat risk 7/10 · Major
- Hot days now (above 106°F)
- 7 days/yr
- Hot days in 30 yrs
- 22 days/yr
Wind risk 8/10 · Major
- Chance of severe wind over 30 yrs
- 80.0%
Air-quality risk 2/10 · Minimal
- Unhealthy air days now
- 1 days/yr
- Unhealthy air days in 30 yrs
- 1 days/yr
Risk factors via First Street. Map © Google.
Why this score? — see what drove the D- grade
The composite is a weighted blend of 9 inputs, each scored 0–100. Each bar is that input's sub-score; the figure is the points it added to the 100-point composite (weight × sub-score).
- ARV discount +12.7/15.0
- Cash flow +6.0/30.0
- Schools +5.2/10.0
- Appreciation +5.0/10.0
- Livability +3.4/5.0
- Rent growth +2.5/5.0
- Condition / age +2.5/5.0
- 1% rule +1.4/10.0
- DSCR +0.4/10.0
$849,000
🖨 Deal sheet 📄 Offer letter ✓ Due diligence
Listing remarks MLS
This 3,313 sq. ft. home in Vintage Oaks offers outstanding value on a spacious 1.01-acre lot. Designed with an open layout and upscale finishes, the home features high ceilings, large windows, and a stone fireplace in the main living area. The kitchen includes quartz countertops, custom cabinetry, stainless steel appliances, a large island, and a walk-in pantry. The private primary suite offers a spa-style bath with soaking tub, walk-in shower, dual vanities, and an oversized closet. Additional highlights include a dedicated study, generous secondary bedrooms, covered patio, and a three-car garage. Vintage Oaks residents enjoy resort-style pools, lazy river, clubhouse, fitness center, and scenic trails.
Key facts
- Custom cabinetry
- Quartz countertops
- Spacious lot
Tags
Neighborhood map
What this means for you Summary
Snapshot
- This is a 4-bed/3.0-bath single-family listed at $849k.
Deal economics
- At list price, monthly cash flow is $-2k ($-19k/yr) — negative.
- To cash-flow at today's rent, offer at most $564k (33.5% below list).
- To meet the 1% rule (rent ≥ 1% of price), the offer needs to be $546k (35.6% below list).
- Recommended offer: $546k (35.6% below list) — sets the bar for 1% rule.
- Cap rate 4.0% vs local median 2.3% in Canyon Lake — top-decile yield for the area; either an underpriced asset or a hidden risk that comps aren't pricing in. Stress-test before assuming the spread holds.
Location & tenants
- Location reads 67/100 on livability (#534 in TX) — a middle-class / working-renter tenant base. Strengths: employment A+, housing A+, cost of living A; Watch: schools C-, amenities F, commute F.
- Comal ISD (rural): math 57% / reading 59% proficiency, ranked #58 of 826 in TX (top 7%) — acceptable for families but not a draw, mixed tenant base, ~2y average lease.
- Market conditions: 1 active listings in the ZIP; 5 comparable units currently listed for rent nearby; rentals lingering (median 44d on market — plan ~5-8 weeks vacancy on turnover, expect pricing pressure); 60% of comp listings sitting > 30 days — soft ceiling on asking rent; 3,420 units permitted in Comal County in 2024 (1,164 in 5+ unit buildings).
Forward outlook
- In year one you build about $31k of equity ($6k loan paydown + $25k appreciation (3.0% local appreciation)).
- Comal County population projected at +70% by 2050 — long-run rental-demand tailwind backs the buy-and-hold thesis.
- By year 2, paydown + projected appreciation supports a ~$51k cash-out refi (75% LTV) — recoverable capital for the next deal without selling this one.
Negotiation context
- It's been on market 70 days — a 6% lower offer ($798k) is reasonable based on typical stale-listing flexibility.
- 6 sale attempts since 3y ago with the ask held roughly flat each time — persistent listings suggest the price (not the market) is what's stuck; bring a comps-based counter.
Risks & watch-outs
- Climate carrying-cost: severe wind risk, 80% chance of damaging wind over 30y; moderate wildfire risk; extreme-heat days projected 7→22/yr by 2055 (HVAC capex compounding) — expect insurance premiums to compound above CPI over the hold.
Questions for the listing agent
- What do current leases actually rent for vs. the listed asking? Can we see a recent rent roll and the last 12 months of T-12 income?
- It's been on market 70 days. Have you received any prior offers? Is the seller open to a 36% concession, seller financing, or rate buy-down credit?
- What does the HOA fee cover, when was the last increase, and are there any pending special assessments or reserve-fund shortfalls?
- Why hasn't it sold? Are there any deal-killer items the seller is aware of (foundation, flood, title, zoning, code violations)?
- Is there a deadline driving the sale (1031 exchange, divorce, estate, relocation)? That informs how much negotiation room exists.
- The area grade is low — what's the realistic commute time and amenity access for the typical tenant pool here? Any planned neighborhood developments (good or bad) we should know about?
- What's the average days-on-market for RENTAL listings here right now (not sales)? A rising rental-DOM trend means longer vacancies and softer asking-rent achievability than the comps imply.
- What's the recent tenant-quality profile in this submarket — average credit score on applications, eviction rate, late-payment / NSF rate, and stable-employment percentage? A property-management company in the area should have these aggregated.
- How much new for-sale + rental construction is in the pipeline within 1–3 miles? Heavy new supply typically softens prices + rents 12–24 months out; constrained supply supports both.
Investment metrics
- 1% rule
- 0.64% ✗
- Cap rate
- 4.01%
- Cash-on-cash
- -8.14%
- DSCR
- 0.64
- GRM
- 12.9
CMA / ARV
- ARV (median comp)
- $961,029
- List price
- $849,000
- Delta
- -11.66%
- Verdict
- UNDERPRICED
- Comps
- 20 within 1.0 mi
Show comp detail 12 sales within ~0.75 mi
| Address | Dist | Beds/Ba | Sqft | Sold | Price | $/sf | Match |
|---|---|---|---|---|---|---|---|
| 1608 Vintage Way | 0.23mi | 4/4.0 | 3,431 (+2%) | 6mo | $925,000 | $270 | 77 |
| 1416 Stahlman | 0.47mi | 4/3.0 | 3,356 (-0%) | 0mo | $1,250,000 | $372 | 77 |
| 1607 Bordeaux Blanc | 0.44mi | 4/3.0 | 3,343 (-1%) | 3mo | $1,295,000 | $387 | 75 |
| 1540 Connettere | 0.34mi | 4/3.5 | 3,133 (-7%) | 3mo | $1,195,000 | $381 | 68 |
| 1113 Provence Pl | 0.57mi | 4/3.5 | 3,205 (-5%) | 2mo | $1,175,000 | $367 | 61 |
| 1552 Vintage Way | 0.37mi | 4/3.5 | 2,983 (-12%) | 1mo | $969,900 | $325 | 61 |
| 2328 Appellation | 0.23mi | 3/3.0 (-1) | 3,873 (+15%) | 2mo | $1,020,000 | $263 | 58 |
| 1419 Trailhead | 0.54mi | 4/3.5 | 3,593 (+6%) | 6mo | $1,399,000 | $389 | 57 |
| 1207 Acquedotto | 0.53mi | 4/3.5 | 3,796 (+12%) | 0mo | $973,900 | $257 | 52 |
| 956 Petite Verdot | 0.57mi | 4/4.5 | 3,702 (+10%) | 5mo | $1,250,000 | $338 | 47 |
| 1609 Angolo | 0.66mi | 3/2.5 (-1) | 3,053 (-10%) | 5mo | $780,000 | $255 | 42 |
| 440 Chinook | 0.72mi | 4/3.5 | 3,002 (-11%) | 5mo | $799,000 | $266 | 42 |
Match score weights: distance 35% · size 25% · config 20% · recency 20%. Top-matched comps best support the ARV.
Projected returns pro-forma
3.0% appreciation · 3.0% rent growth · sell at horizon
- IRR
- -0.0%
- Equity multiple
- 1.00×
- Total profit
- $-283
- Equity at exit
- $381,747
- IRR
- 3.9%
- Equity multiple
- 1.60×
- Total profit
- $143,189
- Equity at exit
- $588,318
Cash invested: $237,720 (down + closing). Projections, not guarantees.
Landlord ↔ Tenant lean methodology
- Overall (STATE)
- 87 Strongly Landlord-Friendly
- State Texas
- 87 Strongly Landlord-Friendly · R+5
- County
- — inherits STATE
- City
- — inherits STATE
ZIP-level market 78132-2739
- Active inventory
- 1
- Price-to-rent
- 12.9×
Monthly cashflow live
- Estimated rent
- $5,464 high interval (Pro) →
- Mortgage (P&I)
- −$4,452
- Tax from tax record
- −$1,059 /mo · $12,713/yr
- Insurance
- −$354
- HOA
- −$63
- Vacancy / Maint / Mgmt
- −$1,147
- Net cashflow
- $-1,612
Break-even live
UW: 25.0% down · 7.5% · 30yr · 1.5% tax · 5.0% vac · 8.0% maint · 8.0% mgmt
Financing live
Cash to close
- Down payment
- $212,250
- Closing costs
- $25,470
- Reserves months
- —
- Total cash needed
- —
Loan-product check · same deal, 3 products live
Conventional
25% down · 7.5% · 30yr
- Down + closing
- —
- Monthly P&I
- —
- Monthly cashflow
- —
- DSCR
- —
- Eligible?
- —
Personal DTI + credit; lowest rate.
DSCR
20% down · 8.5% · 30yr
- Down + closing
- —
- Monthly P&I
- —
- Monthly cashflow
- —
- DSCR
- —
- Eligible?
- —
No personal income docs; deal must DSCR.
Hard money
10% down · 12.0% · 12mo
- Down + closing
- —
- Monthly P&I
- —
- Monthly cashflow
- —
- DSCR
- —
- Eligible?
- —
Short-term bridge; refi at stabilization.
Rent comps 5 comps
| Address | Beds | Baths | Sqft | Rent | $/sqft | DOM | Units | Dist |
|---|---|---|---|---|---|---|---|---|
| 1265 Tenderfoot New Braunfels, TX | 4.0 | 4.5 | 4613 | $9,500 | $2.06 | 43d | 1 | 0.59mi |
| 1239 Yaupon Loop New Braunfels, TX | 4.0 | 3.0 | 2920 | $3,750 | $1.28 | 23d | 1 | 1.06mi |
| 588 Vale Ct New Braunfels, TX | 4.0 | 3.0 | 2987 | $3,750 | $1.26 | 43d | 1 | 1.31mi |
| 535 Orchard Way New Braunfels, TX | 4.0 | 3.0 | 2508 | $3,195 | $1.27 | 43d | 1 | 1.35mi |
| 476 Tobacco Pass New Braunfels, TX | 4.0 | 3.0 | 2534 | $3,300 | $1.30 | 14d | 1 | 1.37mi |
HOA detail
- Monthly dues
- $63 · $756/yr
- Likely covers
- poolgym
Listing history 17 events
-
2026-03-17$849,000 New 712-char remark
Show marketing remark (712 chars)
This 3,313 sq. ft. home in Vintage Oaks offers outstanding value on a spacious 1.01-acre lot. Designed with an open layout and upscale finishes, the home features high ceilings, large windows, and a stone fireplace in the main living area. The kitchen includes quartz countertops, custom cabinetry, stainless steel appliances, a large island, and a walk-in pantry. The private primary suite offers a spa-style bath with soaking tub, walk-in shower, dual vanities, and an oversized closet. Additional highlights include a dedicated study, generous secondary bedrooms, covered patio, and a three-car garage. Vintage Oaks residents enjoy resort-style pools, lazy river, clubhouse, fitness center, and scenic trails.
-
2026-02-28historical
-
2026-01-21price $875,000
-
2025-11-16price $899,000
-
2025-08-05$1,099,000 New
-
2025-07-31historical
-
2025-07-21price $1,099,000
-
2025-02-27price $1,175,000
-
2025-02-06$1,275,000 New
-
2024-10-07historical
-
2024-06-17$1,255,000 New
-
2024-05-31historical
-
2024-03-08$1,255,000 New
-
2024-02-28historical
-
2023-09-19price $1,255,000
-
2023-03-11$1,390,000 New
-
2021-11-22soldstatus
ⓘ Source: listings_history table (triggers on properties + properties_extension) + one-shot
backfill from property_details.listing_events for pre-trigger history.
Tax reassessment forecast TX · Resets to sale price
- Current annual tax
- $12,713 · $1,059/mo
- Projected year-2 tax
- $15,537 · $1,295/mo
- Expected delta
- +$2,824/yr (+$235/mo · 22.2%)
ⓘ Screening estimate from a state-policy table — verify with the county assessor before closing.
Climate risk First Street
- Flood 1/10 Low FEMA zone X (unshaded) · 0% chance over 30 yrs
- Wildfire 5/10 Major
- Heat 7/10 Severe 7 d/yr ≥106°F today · 22 d/yr by 30 yrs out
- Wind 8/10 Severe 80% chance of damaging wind over 30 yrs
- Air quality 2/10 Low 1 unhealthy d/yr today · 1 by 30 yrs out
Nearby sold comps map
Loading sold comps map…
Walkable amenities ~0.75 mi
Loading nearby amenities…
Taxation est. · year 1
- Rental income
- $65,564
- − Mortgage interest
- −$47,557
- − Property taxes
- −$12,713
- − Insurance
- −$4,245
- − Repairs & maintenance
- −$5,245
- − Management
- −$5,245
- − HOA
- −$756
- − Depreciation
- −$24,698
- Taxable loss
- −$34,896
- Est. tax savings @ 24.0%
- +$8,375
- After-tax cash flow
- $-10,971/yr
For passive investors: Depreciation is non-cash, so a rental often shows a tax loss while cash-flowing — sheltering income. Rental losses are passive: they offset passive income freely, and up to $25,000/yr can offset ordinary (W-2) income if you actively participate and your MAGI is under $100k (phasing out to $0 by $150k); unused losses carry forward. On sale, claimed depreciation is recaptured at up to 25%, and gains may owe capital-gains tax (a 1031 exchange can defer both). Figures are a year-1 estimate at your 24.0% rate — not tax advice; consult a CPA.
Schools (NCES district)
- District
- Comal ISD
- NCES district ID
- 4814730
- Math proficiency
- 57% ▼ -9.00%
- Reading proficiency
- 59% ▼ -2.00%
- Median HH income
- $74,792
- Composite
- 51.79/100
- National rank
- #1671
- State rank
- #58 of 826 in TX
Livability — Canyon Lake
- Score
- 67/100
- State rank
- #534
- US rank
- #10441
Category grades
Schools grade is shown separately in the Schools card above.
Census & demographics
- Census place
- Canyon Lake, TX
Population outlook (Comal County) Hauer SSP2
- Today (2025)
- 175,637 people
- By 2030
- 199,911 · +13.8%
- By 2040
- 249,436 · +42.0%
- By 2050
- 299,430 · +70.5%
- By 2075
- 423,857 · +141.3%
- By 2100
- 512,048 · +191.5%
Not yet ingested
- Political lean
- —
- Race & ethnicity
- —
- Common origin
- —
- Civics
- —
Market trends
- HPI YoY
- —
- Current HPI
- —
- Rent YoY
- —
- Metro
- —
- State GDP YoY
- ▲ 3.95%
- F500 in state
- 110
Industry mix (Fortune 500 HQ in TX)
| Industry | F500 HQs | Revenue |
|---|---|---|
| Energy | 16 | $1,198B |
|
||
| Technology | 5 | $198B |
|
||
| Engineering / Construction | 4 | $72B |
|
||
| Energy Services | 3 | $60B |
|
||
| Utilities | 3 | $41B |
|
||
| Healthcare | 2 | $330B |
|
||
Price history
-38.9% since first listed17 events — show timeline
- 2026-03-17 Listed $849,000 LERA
- 2026-02-28 Listing Removed — LERA
- 2026-01-21 Price Changed $875,000 LERA
- 2025-11-16 Price Changed $899,000 LERA
- 2025-08-05 Listed $1,099,000 LERA
- 2025-07-31 Listing Removed — LERA
- 2025-07-21 Price Changed $1,099,000 LERA
- 2025-02-27 Price Changed $1,175,000 LERA
- 2025-02-06 Listed $1,275,000 LERA
- 2024-10-07 Listing Removed — LERA
- 2024-06-17 Listed $1,255,000 LERA
- 2024-05-31 Listing Removed — LERA
- 2024-03-08 Listed $1,255,000 LERA
- 2024-02-28 Listing Removed — LERA
- 2023-09-19 Price Changed $1,255,000 LERA
- 2023-03-11 Listed $1,390,000 LERA
- 2021-11-22 Sold (Public Records) — Public Records
Property tax history
+29.3%/yrLatest (2026): $12,713 · -2.8% YoY. Source: county tax records.
Cash-flow waterfall
monthlySold comps — $/sqft
last 12 mo · ≤1 miLoading sold comps…