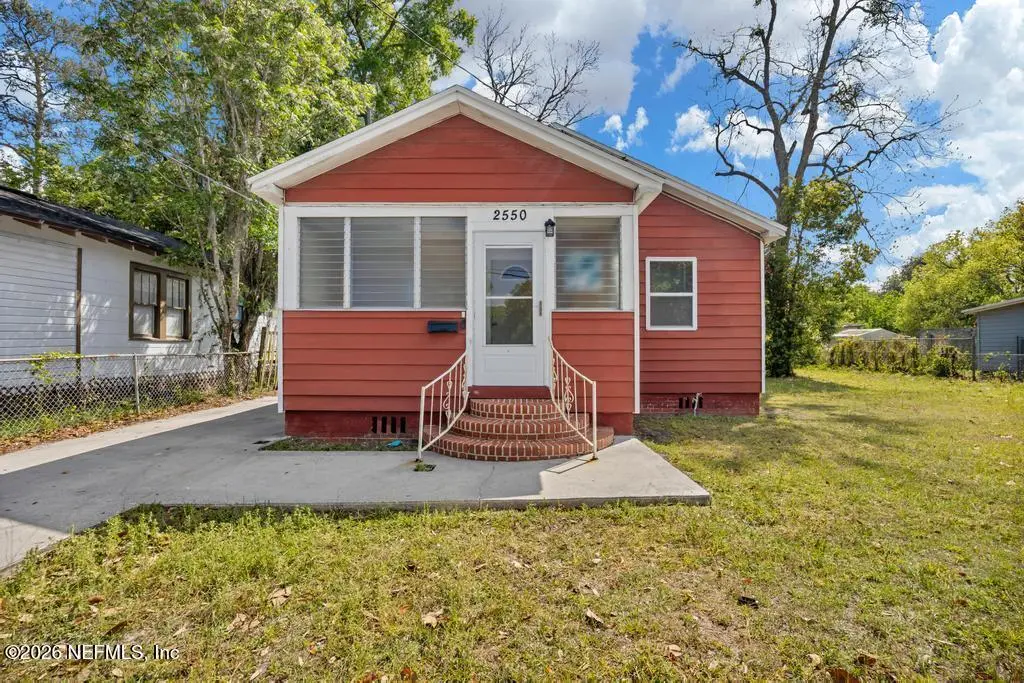
2550 Summit St · Jacksonville, FL
Flood risk 1/10 · Minimal
- FEMA flood zone
- X (unshaded)
- Chance of flooding over 30 yrs
- 0.0%
- Est. flood insurance / yr
- $507 – $1,088
Fire risk 1/10 · Minimal
- Est. fire insurance / yr
- $947 – $1,759
Heat risk 9/10 · Severe
- Hot days now (above 107°F)
- 7 days/yr
- Hot days in 30 yrs
- 20 days/yr
Wind risk 9/10 · Severe
- Chance of severe wind over 30 yrs
- 99.0%
Air-quality risk 5/10 · Moderate
- Unhealthy air days now
- 7 days/yr
- Unhealthy air days in 30 yrs
- 7 days/yr
Risk factors via First Street. Map © Google.
Why this score? — see what drove the D- grade
The composite is a weighted blend of 9 inputs, each scored 0–100. Each bar is that input's sub-score; the figure is the points it added to the 100-point composite (weight × sub-score).
- Cash flow +15.1/30.0
- DSCR +4.6/10.0
- Livability +4.2/5.0
- Schools +3.9/10.0
- 1% rule +3.8/10.0
- Rent growth +3.7/5.0
- Condition / age +2.5/5.0
- ARV discount +0.0/15.0
- Appreciation +0.0/10.0
$137,500
🖨 Deal sheet (PDF) 📄 Offer letter ✓ Due diligence
Listing remarks MLS
This house is in need of a full rehab to be bring it to rental potential. Diamond in the rough though, has huge opportunity for cash flow and great ROI! Check it out. Sold As-Is.
Key facts
- Newer windows
- Prime city location
- New roof
Tags
Property features AI
Finance
- HOA & community: Not a senior community
Exterior
- Parking: Other parking
- Utilities: Sewer connected; Water connected
- Home design: Single-family residence; One level; Residential use
Interior
- Kitchen: Electric oven; Electric range; Microwave; Refrigerator
- Bedrooms: 2 bedrooms
- Flooring: Vinyl flooring; Wood flooring
- Bathrooms: 2 full bathrooms
- Heating & cooling: Central heating; Central air conditioning
- Interior features: In-unit laundry; Electric oven; Electric range; Microwave; Refrigerator
- Laundry & utility: In-unit laundry
Neighborhood map
What this means for you Summary
Snapshot
- This is a 2-bed/1.0-bath single-family listed at $138k.
Deal economics
- At list price, monthly cash flow is $45 ($542/yr) — positive.
- The deal already cash-flows at list — no discount required.
- To meet the 1% rule (rent ≥ 1% of price), the offer needs to be $121k (12.0% below list).
- Recommended offer: $121k (12.0% below list) — sets the bar for 1% rule.
- Cap rate 6.7% vs local median 3.9% in Jacksonville — top-decile yield for the area; either an underpriced asset or a hidden risk that comps aren't pricing in. Stress-test before assuming the spread holds.
Location & tenants
- Location reads 83/100 on livability (#50 in FL, #911 nationally) — a professional / high-income tenant draw. Strengths: amenities A+, commute A+, housing A+.
- Duval (urban): math 46% / reading 45% proficiency, ranked #48 of 73 in FL (top 66%) — families likely to look elsewhere, expect single-tenant / working-renter base with shorter leases.
- Zoned schools: Grasp Academy (math 18% / reading 14%, grade F, #2,130 of 2,144 statewide, top 99%, 271 students, 52% FRL); Joseph Stilwell Middle School (math 31% / reading 33%, grade F, #448 of 571 statewide, top 79%, 612 students, 68% FRL); Riverside High School (math 24% / reading 39%, grade F, #424 of 667 statewide, top 64%, 1,567 students, 60% FRL).
- Zoned-school proficiency averages 26% at this address vs 46% district-wide (-19 pts) — the specific schools serving this property underperform the Duval average; the district grade overstates school quality for this exact location.
- Market conditions: Rents rising fast (+4.7%/yr); 78 active listings in the ZIP; 40 comparable units currently listed for rent nearby; rentals at typical pace (median 22d on market — plan ~3-4 weeks tenant-placement turnaround); 6,503 units permitted in Duval County in 2024 (1,131 in 5+ unit buildings).
Forward outlook
- Local home prices are declining (-3.0%/yr); year-one equity from $951 of loan paydown is wiped out by about $4k of value loss. Plan a longer hold.
- Duval County population projected at +19% by 2050 — long-run rental-demand tailwind backs the buy-and-hold thesis.
Negotiation context
- It's been on market 64 days — a 6% lower offer ($129k) is reasonable based on typical stale-listing flexibility.
- 2 sale attempts since 10y ago with the ask held roughly flat each time — persistent listings suggest the price (not the market) is what's stuck; bring a comps-based counter.
- Current owner paid $80k; list at $138k implies a 72% gain — meaningful room to come down on a strong offer.
Risks & watch-outs
- Watch-outs: built in 1939 — expect roof / HVAC / electrical / plumbing capex.
- Climate carrying-cost: severe wind risk, 99% chance of damaging wind over 30y; extreme-heat days projected 7→20/yr by 2055 (HVAC capex compounding) — expect insurance premiums to compound above CPI over the hold.
Questions for the listing agent
- It's been on market 64 days. Have you received any prior offers? Is the seller open to a 12% concession, seller financing, or rate buy-down credit?
- Built in 1939 — when were the roof, HVAC, electrical panel, plumbing, and water heater last replaced?
- Why hasn't it sold? Are there any deal-killer items the seller is aware of (foundation, flood, title, zoning, code violations)?
- Is there a deadline driving the sale (1031 exchange, divorce, estate, relocation)? That informs how much negotiation room exists.
- Schools are B-rated — typically a magnet for longer-tenancy family renters. What's the average tenant stay here, and is there a school-zone premium baked into asking?
- The area grade is low — what's the realistic commute time and amenity access for the typical tenant pool here? Any planned neighborhood developments (good or bad) we should know about?
- What's the average days-on-market for RENTAL listings here right now (not sales)? A rising rental-DOM trend means longer vacancies and softer asking-rent achievability than the comps imply.
- What's the recent tenant-quality profile in this submarket — average credit score on applications, eviction rate, late-payment / NSF rate, and stable-employment percentage? A property-management company in the area should have these aggregated.
- How much new for-sale + rental construction is in the pipeline within 1–3 miles? Heavy new supply typically softens prices + rents 12–24 months out; constrained supply supports both.
Investment metrics
- 1% rule
- 0.88% ✗
- Cap rate
- 6.69%
- Cash-on-cash
- 1.41%
- DSCR
- 1.06
- GRM
- 9.5
CMA / ARV
- ARV (on-the-fly)
- $95,700
- Comps found
- 12
Show comp detail 12 sales within ~0.75 mi
| Address | Dist | Beds/Ba | Sqft | Sold | Price | $/sf | Match |
|---|---|---|---|---|---|---|---|
| 2565 Orion St | 0.15mi | 2/1.0 | 948 (+15%) | 10mo | $160,000 | $169 | 60 |
| 2965 Dignan St | 0.70mi | 2/2.0 | 820 (-1%) | 5mo | $60,000 | $73 | 58 |
| 2002 Baldwin St | 0.63mi | 2/1.0 | 780 (-6%) | 6mo | $87,500 | $112 | 57 |
| 2070 Woodside St | 0.66mi | 3/1.0 (+1) | 800 (-3%) | 4mo | $116,500 | $146 | 56 |
| 238 Shortreed St | 0.57mi | 2/1.0 | 900 (+9%) | 4mo | $62,000 | $69 | 55 |
| 2034 Commonwealth Ave | 0.74mi | 2/2.0 | 818 (-1%) | 8mo | $199,017 | $243 | 53 |
| 2108 Yulee St | 0.71mi | 3/1.0 (+1) | 873 (+6%) | 0mo | $117,000 | $134 | 52 |
| 2845 Edison Ave | 0.49mi | 2/1.0 | 740 (-10%) | 9mo | $63,000 | $85 | 52 |
| 760 Westbrook Rd | 0.75mi | 2/1.0 | 898 (+9%) | 2mo | $101,150 | $113 | 48 |
| 2081 Baldwin St | 0.65mi | 3/1.0 (+1) | 915 (+11%) | 2mo | $47,000 | $51 | 45 |
| 2926 Hunt St | 0.64mi | 3/1.0 (+1) | 900 (+9%) | 10mo | $145,000 | $161 | 42 |
| 2124 Yulee St | 0.71mi | 2/1.0 | 708 (-14%) | 9mo | $82,310 | $116 | 36 |
Match score weights: distance 35% · size 25% · config 20% · recency 20%. Top-matched comps best support the ARV.
Projected returns pro-forma
-3.0% appreciation · 4.69% rent growth · sell at horizon
- IRR
- -12.3%
- Equity multiple
- 0.55×
- Total profit
- $-17,318
- Equity at exit
- $20,502
- IRR
- -0.9%
- Equity multiple
- 0.93×
- Total profit
- $-2,509
- Equity at exit
- $11,888
Cash invested: $38,500 (down + closing). Projections, not guarantees.
Landlord ↔ Tenant lean methodology
- Overall (STATE)
- 87 Strongly Landlord-Friendly
- State Florida
- 87 Strongly Landlord-Friendly · R+3
- County
- — inherits STATE
- City
- — inherits STATE
ZIP-level market 32204
- Home prices YoY
- -28.2%
- Rents YoY
- 4.7%
- Active inventory
- 78
- Price-to-rent
- 9.5×
Monthly cashflow live
- Estimated rent
- $1,211 high interval (Pro) →
- Mortgage (P&I)
- −$721
- Tax from tax record
- −$133 /mo · $1,595/yr
- Insurance
- −$57
- HOA
- −$0
- Vacancy / Maint / Mgmt
- −$254
- Net cashflow
- $45
Break-even live
Sensitivity live
| Price | -10% $123 | -5% $84 | +0% $45 | +5% $6 | +10% $-33 |
|---|---|---|---|---|---|
| Rent | -10% $-50 | -5% $-3 | +0% $45 | +5% $93 | +10% $141 |
| Rate | -1.0pp $114 | -0.5pp $80 | base $45 | +0.5pp $10 | +1.0pp $-27 |
UW: 25.0% down · 7.5% · 30yr · 1.5% tax · 5.0% vac · 8.0% maint · 8.0% mgmt
Financing live
Cash to close
- Down payment
- $34,375
- Closing costs
- $4,125
- Reserves months
- —
- Total cash needed
- —
Loan-product check · same deal, 3 products live
Conventional
25% down · 7.5% · 30yr
- Down + closing
- —
- Monthly P&I
- —
- Monthly cashflow
- —
- DSCR
- —
- Eligible?
- —
Personal DTI + credit; lowest rate.
DSCR
20% down · 8.5% · 30yr
- Down + closing
- —
- Monthly P&I
- —
- Monthly cashflow
- —
- DSCR
- —
- Eligible?
- —
No personal income docs; deal must DSCR.
Hard money
10% down · 12.0% · 12mo
- Down + closing
- —
- Monthly P&I
- —
- Monthly cashflow
- —
- DSCR
- —
- Eligible?
- —
Short-term bridge; refi at stabilization.
Rent comps 40 comps
| Address | Beds | Baths | Sqft | Rent | $/sqft | DOM | Units | Dist |
|---|---|---|---|---|---|---|---|---|
| 2551 Calvin St Jacksonville, FL | 2.0 | 1.0 | 658 | $600 | $0.91 | 19d | 1 | 0.01mi |
| 2549 Calvin St Jacksonville, FL | 2.0 | 1.0 | 658 | $600 | $0.91 | 19d | 1 | 0.01mi |
| 371 Smith St Jacksonville, FL | 3.0 | 2.0 | 1050 | $1,325 | $1.26 | 6d | 1 | 0.17mi |
| 420 Sunshine St Jacksonville, FL | 3.0 | 2.0 | 1050 | $1,350 | $1.29 | 3d | 1 | 0.44mi |
| 2614 Dellwood Ave Jacksonville, FL | 3.0 | 1.0 | 1122 | $2,325 | $2.07 | 6d | 1 | 0.66mi |
| 2128 Woodside St Jacksonville, FL | 2.0 | 1.0 | 776 | $895 | $1.15 | 25d | 1 | 0.69mi |
| 2759 Dellwood Ave Jacksonville, FL | 3.0 | 2.0 | 1080 | $2,100 | $1.94 | 21d | 1 | 0.70mi |
| 2701 Myra St Jacksonville, FL | 3.0 | 1.0 | 1065 | $1,595 | $1.50 | 23d | 1 | 0.71mi |
| 2613 Green St Jacksonville, FL | 2.0 | 1.0 | 665 | $1,150 | $1.73 | 22d | 1 | 0.74mi |
| 2611 Green St Jacksonville, FL | 2.0 | 1.0 | 728 | $1,195 | $1.64 | 16d | 1 | 0.74mi |
| 2611 Green St Jacksonville, FL | 2.0 | 1.0 | 728 | $1,195 | $1.64 | 25d | 1 | 0.74mi |
| 2525 College St #1214 Jacksonville, FL | 1.0 | 1.0 | 1019 | $1,900 | $1.86 | 25d | 1 | 0.75mi |
| 2577 Haldumar Ter Jacksonville, FL | 2.0 | 1.0 | 865 | $1,050 | $1.21 | 3d | 1 | 0.76mi |
| 2575 Haldumar Ter Jacksonville, FL | 1.0 | 1.0 | 775 | $965 | $1.25 | 3d | 1 | 0.76mi |
| 828 Acosta St Unit 1 Jacksonville, FL | 1.0 | 1.0 | 806 | $1,150 | $1.43 | 25d | 1 | 0.77mi |
| 1979 Yulee St Jacksonville, FL | 3.0 | 2.0 | 1050 | $1,500 | $1.43 | 25d | 1 | 0.77mi |
| 2002 Ernest St Unit A Jacksonville, FL | 2.0 | 1.0 | 1000 | $1,795 | $1.79 | 15d | 1 | 0.77mi |
| 2578 Haldumar Ter Jacksonville, FL | 2.0 | 1.0 | 1114 | $2,195 | $1.97 | 16d | 1 | 0.77mi |
| 2050 Dellwood Ave #3 Jacksonville, FL | 1.0 | 1.0 | 785 | $970 | $1.24 | 25d | 1 | 0.79mi |
| 2619 College St Unit 2 Jacksonville, FL | 1.0 | 1.0 | 700 | $1,050 | $1.50 | 25d | 1 | 0.80mi |
| 2659 College St Jacksonville, FL | 1.0 | 1.0 | 639 | $995 | $1.56 | 25d | 1 | 0.80mi |
| 2022 Dellwood Ave Unit 2 Jacksonville, FL | 2.0 | 1.0 | 800 | $1,098 | $1.37 | 16d | 1 | 0.81mi |
| 2653 College St Unit 2653 Jacksonville, FL | 1.0 | 1.0 | 907 | $1,295 | $1.43 | 4d | 1 | 0.81mi |
| 2328 College St Jacksonville, FL | 1.0 | 1.0 | 900 | $1,350 | $1.50 | 25d | 1 | 0.81mi |
| 3035 Fitzgerald St Jacksonville, FL | 2.0 | 1.0 | 900 | $1,021 | $1.13 | 4d | 1 | 0.82mi |
| 2533 Post St Jacksonville, FL | 1.0 | 1.0 | 950 | $1,425 | $1.50 | 19d | 1 | 0.84mi |
| 907 Copeland St Jacksonville, FL | 2.0 | 1.0 | 784 | $1,395 | $1.78 | 25d | 1 | 0.85mi |
| 2657 Post St Apt 2 Jacksonville, FL | 3.0 | 1.0 | 1100 | $1,700 | $1.55 | 4d | 1 | 0.86mi |
| 2136 College St #4 Jacksonville, FL | 2.0 | 1.0 | 900 | $1,250 | $1.39 | 25d | 1 | 0.86mi |
| 2803 College St Jacksonville, FL | 2.0 | 1.0 | 1100 | $1,550 | $1.41 | 15d | 1 | 0.87mi |
| 2920 Dellwood Ave Unit 4 Jacksonville, FL | 1.0 | 1.0 | 650 | $900 | $1.38 | 12d | 1 | 0.87mi |
| 2920 Dellwood Ave #2 Jacksonville, FL | 1.0 | 1.0 | 650 | $900 | $1.38 | 9d | 1 | 0.87mi |
| 1729 Logan St W Unit 3 Jacksonville, FL | 2.0 | 1.0 | 694 | $850 | $1.22 | 25d | 1 | 0.87mi |
| 1751 Broadway Ave Jacksonville, FL | 2.0 | 1.0 | 1000 | $1,525 | $1.52 | 6d | 1 | 0.87mi |
| 2153 Post St Jacksonville, FL | 1.0 | 1.0 | 540 | $875 | $1.62 | 25d | 1 | 0.89mi |
| 2851 College St Unit 1 Jacksonville, FL | 1.0 | 1.0 | 655 | $1,100 | $1.68 | 25d | 1 | 0.90mi |
| 2980 Ernest St Jacksonville, FL | 2.0 | 1.0 | 920 | $1,200 | $1.30 | 25d | 1 | 0.91mi |
| 2853 College St Unit 1 Jacksonville, FL | 1.0 | 1.0 | 655 | $1,100 | $1.68 | 25d | 1 | 0.91mi |
| 1657 Union St W Unit 1 Jacksonville, FL | 2.0 | 1.0 | 700 | $1,050 | $1.50 | 3d | 1 | 0.94mi |
| 1651 Union St W Jacksonville, FL | 2.0 | 1.0 | 675 | $900 | $1.33 | 25d | 1 | 0.95mi |
Listing history 13 events
-
2026-06-07status $137,500 Pending 64 DOM
-
2026-06-03days on market $137,500 Active Under Contract 64 DOM
-
2026-06-02days on market $137,500 Active Under Contract 63 DOM
-
2026-06-01days on market $137,500 Active Under Contract 62 DOM
-
2026-05-31days on market $137,500 Active Under Contract 61 DOM
-
2026-05-13historical Active Under Contract
-
2026-04-10price $137,500
-
2026-03-30$139,900 Active
-
2026-03-18soldstatus $80,000
-
2016-06-27historical 178-char remark
Show marketing remark (178 chars)
This house is in need of a full rehab to be bring it to rental potential. Diamond in the rough though, has huge opportunity for cash flow and great ROI! Check it out. Sold As-Is.
-
2016-05-19$25,500 Active 178-char remark
Show marketing remark (178 chars)
This house is in need of a full rehab to be bring it to rental potential. Diamond in the rough though, has huge opportunity for cash flow and great ROI! Check it out. Sold As-Is.
-
2005-11-17soldstatus $43,000
-
1996-04-29soldstatus $87,600
ⓘ Source: listings_history table (triggers on properties + properties_extension) + one-shot
backfill from property_details.listing_events for pre-trigger history.
Tax reassessment forecast FL · Resets to sale price
- Current annual tax
- $1,595 · $133/mo
- Projected year-2 tax
- $1,595 · $133/mo
- Expected delta
- $0/yr ($0/mo · 0.0%)
ⓘ Screening estimate from a state-policy table — verify with the county assessor before closing.
Climate risk First Street
- Flood 1/10 Low FEMA zone X (unshaded) · 0% chance over 30 yrs
- Wildfire 1/10 Low
- Heat 9/10 Extreme 7 d/yr ≥107°F today · 20 d/yr by 30 yrs out
- Wind 9/10 Extreme 99% chance of damaging wind over 30 yrs
- Air quality 5/10 Major 7 unhealthy d/yr today · 7 by 30 yrs out
Nearby sold comps map
Loading sold comps map…
Walkable amenities ~0.75 mi
Loading nearby amenities…
Taxation est. · year 1
- Rental income
- $14,528
- − Mortgage interest
- −$7,702
- − Property taxes
- −$1,595
- − Insurance
- −$688
- − Repairs & maintenance
- −$1,162
- − Management
- −$1,162
- − Depreciation
- −$4,000
- Taxable loss
- −$1,781
- Est. tax savings @ 24.0%
- +$427
- After-tax cash flow
- $969/yr
For passive investors: Depreciation is non-cash, so a rental often shows a tax loss while cash-flowing — sheltering income. Rental losses are passive: they offset passive income freely, and up to $25,000/yr can offset ordinary (W-2) income if you actively participate and your MAGI is under $100k (phasing out to $0 by $150k); unused losses carry forward. On sale, claimed depreciation is recaptured at up to 25%, and gains may owe capital-gains tax (a 1031 exchange can defer both). Figures are a year-1 estimate at your 24.0% rate — not tax advice; consult a CPA.
Schools (NCES district)
- District
- Duval
- NCES district ID
- 1200480
- Math proficiency
- 46% ▼ -11.00%
- Reading proficiency
- 45% ▼ -4.00%
- Median HH income
- $48,987
- Composite
- 38.97/100
- National rank
- #4076
- State rank
- #48 of 73 in FL
Livability — Jacksonville
- Score
- 83/100
- State rank
- #50
- US rank
- #911
Category grades
Schools grade is shown separately in the Schools card above.
Census & demographics
- Census place
- Jacksonville, FL
- County
- Duval County · 1,015,274 people
- City population
- 979,034
- Metro
- Jacksonville, FL
- Population (ZIP)
- 9,151
- Household income
- $65,063
- Rent vs Own
- Severe rent burden
- 866.0
Population outlook (Duval County) Hauer SSP2
- Today (2025)
- 1,013,010 people
- By 2030
- 1,059,228 · +4.6%
- By 2040
- 1,141,439 · +12.7%
- By 2050
- 1,205,258 · +19.0%
- By 2075
- 1,324,282 · +30.7%
- By 2100
- 1,319,620 · +30.3%
Race, ethnicity, and origin ACS 2023
- Neighborhood character
- Diverse neighborhood (Simpson 0.60)
- Race & ethnicity
- White 55% Black 30% Hispanic / Latino 6% Asian 6% Two or more races 6%
- Hispanic origin (detail)
- Mexican 3% Puerto Rican 1%
- Common ancestry
- Slovak 2% Lithuanian 2% Italian 1%
- Foreign-born
- 7% · China, Canada, Philippines
- Languages at home
- 92% English-only · Spanish 3% Chinese 2% Other Asian/Pacific 2%
Political lean MEDSL · Duval
- 2024 margin
- Toss-up / Even · D 48.7% · R 50.1% · Other 1.2%
- 2008→2024 swing
- +0.4pp no change · 2008: -1.9pp · 2024: -1.5pp
- All cycles
- 2024: R+1.5 2020: D+3.8 2016: R+1.5 2012: R+3.6 2008: R+1.9
Not yet ingested
- Civics
- —
Market trends
- HPI YoY
- ▼ -123.96%
- Current HPI
- 316.3185
- Rent YoY
- ▲ 4.69%
- Metro
- Jacksonville, FL
- State GDP YoY
- ▲ 3.28%
- F500 in state
- 36
Industry mix (Fortune 500 HQ in FL)
| Industry | F500 HQs | Revenue |
|---|---|---|
| Industrial Technology | 2 | $29B |
|
||
| Insurance | 2 | $17B |
|
||
| Retail | 1 | $60B |
|
||
| Technology Distribution | 1 | $58B |
|
||
| Homebuilding | 1 | $35B |
|
||
| Technology Manufacturing | 1 | $35B |
|
||
Price history
+57.0% since first listed8 events — show timeline
- 2026-05-13 Contingent — realMLS
- 2026-04-10 Price Changed $137,500 realMLS
- 2026-03-30 Listed $139,900 realMLS
- 2026-03-18 Sold (Public Records) $80,000 Public Records
- 2016-06-27 Listing Removed — realMLS
- 2016-05-19 Listed $25,500 realMLS
- 2005-11-17 Sold (Public Records) $43,000 Public Records
- 1996-04-29 Sold (Public Records) $87,600 Public Records
Property tax history
+7.5%/yrLatest (2025): $1,595 · +46.9% YoY. Source: county tax records.
Cash-flow waterfall
monthlySold comps — $/sqft
last 12 mo · ≤1 miLoading sold comps…