661 Long St · Graysville, TN
Flood risk 8/10 · Major
- FEMA flood zone
- X (unshaded)
- Chance of flooding over 30 yrs
- 0.99%
- Est. flood insurance / yr
- $507 – $1,088
Fire risk 5/10 · Moderate
- Est. fire insurance / yr
- $949 – $1,763
Heat risk 6/10 · Moderate
- Hot days now (above 105°F)
- 8 days/yr
- Hot days in 30 yrs
- 22 days/yr
Wind risk 4/10 · Minor
- Chance of severe wind over 30 yrs
- 10.0%
Air-quality risk 3/10 · Minor
- Unhealthy air days now
- 2 days/yr
- Unhealthy air days in 30 yrs
- 3 days/yr
Risk factors via First Street. Map © Google.
Why this score? — see what drove the D grade
The composite is a weighted blend of 9 inputs, each scored 0–100. Each bar is that input's sub-score; the figure is the points it added to the 100-point composite (weight × sub-score).
- ARV discount +15.0/15.0
- Cash flow +12.5/30.0
- DSCR +3.7/10.0
- Livability +2.9/5.0
- Schools +2.8/10.0
- 1% rule +2.5/10.0
- Rent growth +2.5/5.0
- Condition / age +2.5/5.0
- Appreciation +0.0/10.0
$159,900
🖨 Deal sheet (PDF) 📄 Offer letter ✓ Due diligence
Listing remarks
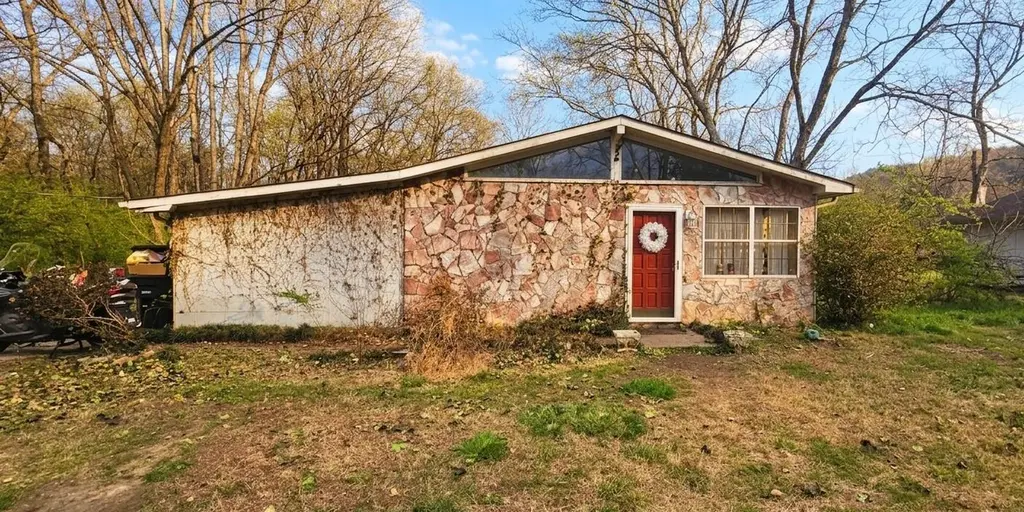
Located in the peaceful Graysville community just south of Dayton, this 1,620-square-foot cottage sits on a generous 0.62-acre level lot that offers a rare blend of privacy and usable outdoor space. Built in 1977, the home features a classic stone-accented exterior and a large yard to create significant curb appeal for those with an eye for renovation. The heart of the home consists of a functional galley-style kitchen that transitions into two distinct living areas: a traditional family room and an expansive den. This dual-living space setup provides the flexibility needed for a modern home office, a playroom, or a large entertaining hub. The true value of this property lies in its expansi
Key facts
- Galley-style kitchen
- 0.62-acre level lot
- Expansive grounds
Tags
Property features AI
Finance
- Other: Living area about 1620 (units: square feet)
Exterior
- Parking: Driveway; Gravel parking
- Utilities: Public water available; Septic tank; Water available
- Home design: Single-family residence; Residential property; Three or more levels; Existing structure
- Construction: Stone and other exterior materials; Other roof type
- Exterior features: Level lot; Lot approximately 0.62 acres; Lot dimensions about 70M x 412 irregular
Interior
- Kitchen: Electric range; Refrigerator
- Bedrooms: 3 bedrooms
- Flooring: Carpet; Vinyl
- Bathrooms: 2 full bathrooms
- Heating & cooling: Central heating; Central air; Other cooling
- Interior features: Ceiling fans
Neighborhood map
What this means for you Summary
Snapshot
- This is a 3-bed/3.0-bath single-family listed at $160k.
Deal economics
- At list price, monthly cash flow is $-89 ($-1k/yr) — negative.
- To cash-flow at today's rent, offer at most $144k (9.9% below list).
- To meet the 1% rule (rent ≥ 1% of price), the offer needs to be $120k (25.0% below list).
- Recommended offer: $120k (25.0% below list) — sets the bar for 1% rule.
Location & tenants
- Location reads 58/100 on livability (#298 in TN) — a working-class tenant base; expect higher turnover. Strengths: cost of living A+, housing A+; Watch: health & safety C-, amenities F, commute F.
- Rhea County (rural): math 35% / reading 31% proficiency, ranked #38 of 139 in TN (top 27%) — families likely to look elsewhere, expect single-tenant / working-renter base with shorter leases.
- Zoned schools: Graysville Elementary School (math 22% / reading 27%, grade F, #546 of 952 statewide, top 61%, 229 students, 0% FRL); Rhea Middle School (math 39% / reading 26%, grade F, #81 of 333 statewide, top 26%, 556 students, 0% FRL); Rhea County High School (math 24% / reading 35%, grade F, #86 of 332 statewide, top 27%, 1,500 students, 0% FRL) — zoned schools average 0% FRL vs 60% district-wide (60 pts lower); this property's tenant base skews higher-income than the district average.
- Market conditions: 216 active listings in the ZIP; 1 comparable units currently listed for rent nearby; 198 units permitted in Rhea County in 2024 (40 in 5+ unit buildings).
Forward outlook
- Local home prices are declining (-3.0%/yr); year-one equity from $1k of loan paydown is wiped out by about $5k of value loss. Plan a longer hold.
Negotiation context
- It's been on market 48 days — a 3% lower offer ($155k) is reasonable based on typical stale-listing flexibility.
- 5 sale attempts since 2y ago; this cycle's ask has dropped $10k (6%) from the opening price — seller is motivated, your offer sets the floor, not the list.
Risks & watch-outs
- Watch-outs: flood insurance adds $66/mo.
- Climate carrying-cost: severe flood risk; moderate wildfire risk; extreme-heat days projected 8→22/yr by 2055 (HVAC capex compounding) — expect insurance premiums to compound above CPI over the hold.
Questions for the listing agent
- What do current leases actually rent for vs. the listed asking? Can we see a recent rent roll and the last 12 months of T-12 income?
- It's been on market 48 days. Have you received any prior offers? Is the seller open to a 25% concession, seller financing, or rate buy-down credit?
- Built in 1977 — when were the roof, HVAC, electrical panel, plumbing, and water heater last replaced?
- What's the actual annual flood-insurance premium (NFIP or private), and is the property in a SFHA with mandatory coverage?
- Is there a deadline driving the sale (1031 exchange, divorce, estate, relocation)? That informs how much negotiation room exists.
- Schools are F-rated, which usually means shorter tenancies and higher turnover. Who's the typical renter profile here, and what's been the actual vacancy rate?
- The area grade is low — what's the realistic commute time and amenity access for the typical tenant pool here? Any planned neighborhood developments (good or bad) we should know about?
- What's the average days-on-market for RENTAL listings here right now (not sales)? A rising rental-DOM trend means longer vacancies and softer asking-rent achievability than the comps imply.
- What's the recent tenant-quality profile in this submarket — average credit score on applications, eviction rate, late-payment / NSF rate, and stable-employment percentage? A property-management company in the area should have these aggregated.
- How much new for-sale + rental construction is in the pipeline within 1–3 miles? Heavy new supply typically softens prices + rents 12–24 months out; constrained supply supports both.
Investment metrics
- 1% rule
- 0.75% ✗
- Cap rate
- 6.12%
- Cash-on-cash
- -0.61%
- DSCR
- 0.97
- GRM
- 11.1
CMA / ARV
- ARV (median comp)
- $215,931
- List price
- $159,900
- Delta
- -25.95%
- Verdict
- UNDERPRICED
- Comps
- 14 within 1.0 mi
Show comp detail 3 sales within ~0.75 mi
| Address | Dist | Beds/Ba | Sqft | Sold | Price | $/sf | Match |
|---|---|---|---|---|---|---|---|
| 154 S Pope St | 0.24mi | 3/2.0 | 1,592 (-2%) | 8mo | $259,000 | $163 | 75 |
| 155 Gray St | 0.60mi | 3/2.0 | 1,431 (-12%) | 3mo | $90,000 | $63 | 46 |
| 4343 Dayton Ave | 0.56mi | 3/2.0 | 1,450 (-10%) | 20mo | $289,000 | $199 | 35 |
Match score weights: distance 35% · size 25% · config 20% · recency 20%. Top-matched comps best support the ARV.
Projected returns pro-forma
-3.0% appreciation · 3.0% rent growth · sell at horizon
- IRR
- -20.3%
- Equity multiple
- 0.29×
- Total profit
- $-31,626
- Equity at exit
- $23,842
- IRR
- -13.4%
- Equity multiple
- 0.22×
- Total profit
- $-34,964
- Equity at exit
- $13,825
Cash invested: $44,772 (down + closing). Projections, not guarantees.
Landlord ↔ Tenant lean methodology
- Overall (STATE)
- 87 Strongly Landlord-Friendly
- State Tennessee
- 87 Strongly Landlord-Friendly · R+13
- County
- — inherits STATE
- City
- — inherits STATE
ZIP-level market 37321
- Home prices YoY
- -12.0%
- Active inventory
- 216
- Price-to-rent
- 11.1×
Monthly cashflow live
- Estimated rent
- $1,200 medium interval (Pro) →
- Mortgage (P&I)
- −$839
- Tax from tax record
- −$66 /mo · $789/yr
- Insurance
- −$67
- Flood insurance flood zone
- −$66 /mo · $798/yr
- HOA
- −$0
- Vacancy / Maint / Mgmt
- −$252
- Net cashflow
- $-89
Break-even live
Sensitivity live
| Price | -10% $1 | -5% $-44 | +0% $-89 | +5% $-135 | +10% $-180 |
|---|---|---|---|---|---|
| Rent | -10% $-184 | -5% $-137 | +0% $-89 | +5% $-42 | +10% $5 |
| Rate | -1.0pp $-9 | -0.5pp $-49 | base $-89 | +0.5pp $-131 | +1.0pp $-173 |
UW: 25.0% down · 7.5% · 30yr · 1.5% tax · 5.0% vac · 8.0% maint · 8.0% mgmt
Financing live
Cash to close
- Down payment
- $39,975
- Closing costs
- $4,797
- Reserves months
- —
- Total cash needed
- —
Loan-product check · same deal, 3 products live
Conventional
25% down · 7.5% · 30yr
- Down + closing
- —
- Monthly P&I
- —
- Monthly cashflow
- —
- DSCR
- —
- Eligible?
- —
Personal DTI + credit; lowest rate.
DSCR
20% down · 8.5% · 30yr
- Down + closing
- —
- Monthly P&I
- —
- Monthly cashflow
- —
- DSCR
- —
- Eligible?
- —
No personal income docs; deal must DSCR.
Hard money
10% down · 12.0% · 12mo
- Down + closing
- —
- Monthly P&I
- —
- Monthly cashflow
- —
- DSCR
- —
- Eligible?
- —
Short-term bridge; refi at stabilization.
Rent comps 1 comps
| Address | Beds | Baths | Sqft | Rent | $/sqft | DOM | Units | Dist |
|---|---|---|---|---|---|---|---|---|
| 210 6th St Graysville, TN | 2.0 | 1.0 | 1092 | $1,200 | $1.10 | 15d | 1 | 0.17mi |
Listing history 31 events
-
2026-06-21days on market $159,900 Coming Soon 48 DOM
-
2026-06-21days on market $159,900 Coming Soon 47 DOM
-
2026-06-18days on market $159,900 Coming Soon 45 DOM
-
2026-06-17days on market $159,900 Coming Soon 44 DOM
-
2026-06-16days on market $159,900 Coming Soon 43 DOM
-
2026-06-15days on market $159,900 Coming Soon 42 DOM
-
2026-06-13days on market $159,900 Coming Soon 40 DOM
-
2026-06-12days on market $159,900 Coming Soon 39 DOM
-
2026-06-09days on market $159,900 Coming Soon 36 DOM
-
2026-06-08days on market $159,900 Coming Soon 35 DOM
-
2026-06-08days on market $159,900 Coming Soon 34 DOM
-
2026-06-07days on market $159,900 Coming Soon 33 DOM
-
2026-06-03days on market $159,900 Coming Soon 30 DOM
-
2026-06-02days on market $159,900 Coming Soon 29 DOM
-
2026-06-01days on market $159,900 Coming Soon 28 DOM
-
2026-05-31days on market $159,900 Coming Soon 27 DOM
-
2026-05-03price $159,900 1221-char remark
-
2026-05-03price $159,900 1221-char remark
-
2026-04-23price $166,900 1221-char remark
-
2026-04-23price $166,900 1221-char remark
-
2026-04-08price $168,000 1221-char remark
-
2026-04-08price $168,000 1221-char remark
-
2026-03-28$169,900 Active 1221-char remark
-
2026-03-28$169,900 Active 1221-char remark
-
2026-03-28$159,900 Active
-
2024-07-09soldstatus $169,000
-
2024-07-05soldstatus $169,000 Closed
-
2024-07-05soldstatus $169,000
-
2024-06-04historical Contingent
-
2024-05-18$174,900 Active
-
2024-05-18$169,000
ⓘ Source: listings_history table (triggers on properties + properties_extension) + one-shot
backfill from property_details.listing_events for pre-trigger history.
Tax reassessment forecast TN · Resets to sale price
- Current annual tax
- $789 · $66/mo
- Projected year-2 tax
- $1,135 · $95/mo
- Expected delta
- +$346/yr (+$29/mo · 43.9%)
ⓘ Screening estimate from a state-policy table — verify with the county assessor before closing.
Climate risk First Street
- Flood 8/10 Severe FEMA zone X (unshaded) · 99% chance over 30 yrs
- Wildfire 5/10 Major
- Heat 6/10 Major 8 d/yr ≥105°F today · 22 d/yr by 30 yrs out
- Wind 4/10 Moderate 10% chance of damaging wind over 30 yrs
- Air quality 3/10 Moderate 2 unhealthy d/yr today · 3 by 30 yrs out
Nearby sold comps map
Loading sold comps map…
Walkable amenities ~0.75 mi
Loading nearby amenities…
Taxation est. · year 1
- Rental income
- $14,400
- − Mortgage interest
- −$8,957
- − Property taxes
- −$789
- − Insurance
- −$1,597
- − Repairs & maintenance
- −$1,152
- − Management
- −$1,152
- − Depreciation
- −$4,652
- Taxable loss
- −$3,899
- Est. tax savings @ 24.0%
- +$936
- After-tax cash flow
- $-137/yr
For passive investors: Depreciation is non-cash, so a rental often shows a tax loss while cash-flowing — sheltering income. Rental losses are passive: they offset passive income freely, and up to $25,000/yr can offset ordinary (W-2) income if you actively participate and your MAGI is under $100k (phasing out to $0 by $150k); unused losses carry forward. On sale, claimed depreciation is recaptured at up to 25%, and gains may owe capital-gains tax (a 1031 exchange can defer both). Figures are a year-1 estimate at your 24.0% rate — not tax advice; consult a CPA.
Schools (NCES district)
- District
- Rhea County
- NCES district ID
- 4703510
- Math proficiency
- 35% ▼ -7.00%
- Reading proficiency
- 31% ▼ -5.00%
- Median HH income
- $39,059
- Composite
- 27.67/100
- National rank
- #6917
- State rank
- #38 of 139 in TN
Livability — Graysville
- Score
- 58/100
- State rank
- #298
- US rank
- #20631
Category grades
Schools grade is shown separately in the Schools card above.
Census & demographics
- Census place
- Graysville, TN
- Population (ZIP)
- 20,670
Population outlook (Rhea County) Hauer SSP2
- Today (2025)
- 33,187 people
- By 2030
- 33,482 · +0.9%
- By 2040
- 33,786 · +1.8%
- By 2050
- 33,730 · +1.6%
- By 2075
- 33,603 · +1.3%
- By 2100
- 33,312 · +0.4%
Race, ethnicity, and origin ACS 2023
- Neighborhood character
- Predominantly White (84%)
- Race & ethnicity
- White 84% Hispanic / Latino 9% Two or more races 8% Black 1% Asian 1%
- Hispanic origin (detail)
- Mexican 6%
- Common ancestry
- Slovak 2% Lithuanian 2% Serbian 2%
- Foreign-born
- 5% · Canada
- Languages at home
- 93% English-only · Spanish 6% Other Indo-European 1%
Political lean MEDSL · Rhea
- 2024 margin
- Solid R (+66.9) · D 16.0% · R 82.9% · Other 1.1%
- 2008→2024 swing
- -20.7pp toward R · 2008: -46.2pp · 2024: -66.9pp
- All cycles
- 2024: R+66.9 2020: R+63.7 2016: R+61.3 2012: R+48.9 2008: R+46.2
Not yet ingested
- Civics
- —
Market trends
- HPI YoY
- ▼ -44.20%
- Current HPI
- 323.7125
- Rent YoY
- —
- Metro
- —
- State GDP YoY
- ▲ 2.78%
- F500 in state
- 22
Industry mix (Fortune 500 HQ in TN)
| Industry | F500 HQs | Revenue |
|---|---|---|
| Healthcare | 3 | $91B |
|
||
| Retail | 3 | $72B |
|
||
| Transportation / Logistics | 1 | $88B |
|
||
| Paper / Packaging | 1 | $19B |
|
||
| Insurance | 1 | $13B |
|
||
| Energy | 1 | $12B |
|
||
Price history
-5.4% since first listed16 events — show timeline
- 2026-05-21 Coming Soon $159,900 REALTRACS as Distributed by MLS Grid
- 2026-05-03 Price Changed $159,900 RCAOR
- 2026-05-03 Price Changed $159,900 GCAR
- 2026-04-23 Price Changed $166,900 RCAOR
- 2026-04-23 Price Changed $166,900 GCAR
- 2026-04-08 Price Changed $168,000 RCAOR
- 2026-04-08 Price Changed $168,000 GCAR
- 2026-03-28 Listed $169,900 GCAR
- 2026-03-28 Listed $169,900 RCAOR
- 2026-03-28 Listed $159,900 REALTRACS as Distributed by MLS Grid
- 2024-07-09 Sold (Public Records) $169,000 Public Records
- 2024-07-05 Sold (MLS) $169,000 RCAOR
- 2024-07-05 Sold (MLS) $169,000 GCAR
- 2024-06-04 Contingent — GCAR
- 2024-05-18 Listed $174,900 GCAR
- 2024-05-18 Listed $169,000 RCAOR
Property tax history
+3.6%/yrLatest (2025): $789 · +4.0% YoY. Source: county tax records.
Cash-flow waterfall
monthlySold comps — $/sqft
last 12 mo · ≤1 miLoading sold comps…