539 Union Bethel Rd · Surf City, NC
Flood risk 1/10 · Minimal
- FEMA flood zone
- X (unshaded)
- Chance of flooding over 30 yrs
- 0.0%
- Est. flood insurance / yr
- $507 – $1,088
Fire risk 6/10 · Moderate
- Est. fire insurance / yr
- $906 – $1,684
Heat risk 9/10 · Severe
- Hot days now (above 103°F)
- 7 days/yr
- Hot days in 30 yrs
- 19 days/yr
Wind risk 9/10 · Severe
- Chance of severe wind over 30 yrs
- 99.0%
Air-quality risk 2/10 · Minimal
- Unhealthy air days now
- 1 days/yr
- Unhealthy air days in 30 yrs
- 1 days/yr
Risk factors via First Street. Map © Google.
Why this score? — see what drove the C grade
The composite is a weighted blend of 9 inputs, each scored 0–100. Each bar is that input's sub-score; the figure is the points it added to the 100-point composite (weight × sub-score).
- Cash flow +24.8/30.0
- DSCR +8.1/10.0
- ARV discount +7.5/15.0
- 1% rule +5.1/10.0
- Schools +4.2/10.0
- Rent growth +3.6/5.0
- Livability +3.2/5.0
- Condition / age +2.5/5.0
- Appreciation +0.0/10.0
$210,000
🖨 Deal sheet 📄 Offer letter ✓ Due diligence
Listing remarks
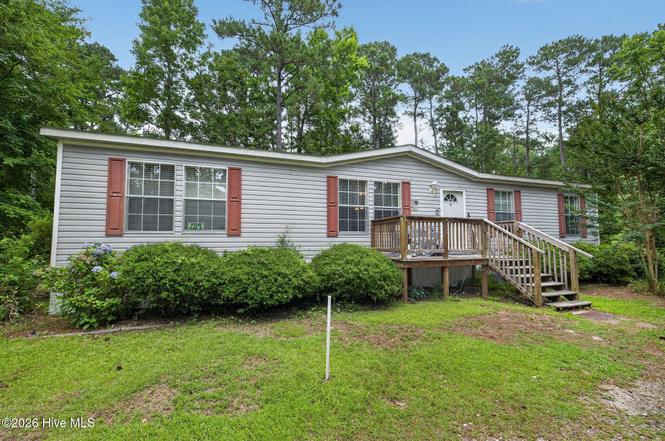
Calling all investors, renovators, and buyers ready to create value! This 3-bedroom, 2-bath manufactured home sits on approximately 1 acre in Hampstead with no HOA, septic, and plenty of room to make it your own. Located in the highly sought-after Topsail school district, this property offers a great opportunity at an affordable price point. The home is being sold AS IS and needs a new roof and minor renovations, which is reflected in the price. Check it out today!
Key facts
- Manufactured home
- Minor renovations
- Septic
Tags
Property features AI
Finance
- Other: Lot is approximately 1 acre (dimensions: 177 x 247 x 177 x 247); Road frontage includes city street and state road; road surface is paved; Zoning: RP
Exterior
- Parking: On-site unpaved parking; No garage
- Utilities: Public water; Water connected; Septic tank
- Home design: Manufactured home (residential); Single-story; Entry level is 1; Facing information not provided
- Construction: Vinyl siding; Other foundation
- Exterior features: Shingle roof; Shed(s) on the property; Has a view; No patio or porch; No fencing
Interior
- Kitchen: Electric oven; Refrigerator; Dishwasher
- Bedrooms: Master downstairs
- Flooring: Carpet; Laminate
- Bathrooms: 2 full bathrooms
- Heating & cooling: Heat pump for heating and cooling; Electric heating
- Interior features: Master bedroom on the main level; Ceiling fans; Window coverings; Water softener
- Laundry & utility: Dedicated laundry room
Neighborhood map
What this means for you Summary
Snapshot
- This is a 3-bed/2.0-bath other listed at $210k.
Deal economics
- At list price, monthly cash flow is $446 ($5k/yr) — positive.
- The deal already cash-flows at list — no discount required.
- Meets the 1% rule at list price ($2k rent vs $210k).
- Cap rate 8.8% vs local median 0.9% in Surf City — top-decile yield for the area; either an underpriced asset or a hidden risk that comps aren't pricing in. Stress-test before assuming the spread holds.
Location & tenants
- Location reads 64/100 on livability (#357 in NC) — a middle-class / working-renter tenant base. Strengths: housing A, employment A-; Watch: health & safety D, amenities F, commute F.
- Pender County Schools (rural): math 49% / reading 50% proficiency, ranked #66 of 178 in NC (top 37%) — families likely to look elsewhere, expect single-tenant / working-renter base with shorter leases.
- Zoned schools: Surf City Elementary (math 63% / reading 60%, grade B, #193 of 1,410 statewide, top 14%, 808 students, 31% FRL); Surf City Middle (math 56% / reading 57%, grade B, #71 of 475 statewide, top 15%, 705 students, 23% FRL); Topsail High (math 67% / reading 72%, grade B, #121 of 535 statewide, top 24%, 1,777 students, 22% FRL) — zoned schools average 25% FRL vs 47% district-wide (22 pts lower); this property's tenant base skews higher-income than the district average.
- Zoned-school proficiency averages 62% at this address vs 50% district-wide (+13 pts) — the actual schools serving this property are materially stronger than the Pender County Schools average implies; a family-tenant draw the district grade alone would hide.
- Market conditions: Rents rising fast (+4.6%/yr); 509 active listings in the ZIP; 3 comparable units currently listed for rent nearby; rentals leasing fast (median 14d on market — plan ~1-2 weeks tenant-placement turnaround); solid renter incomes; 943 units permitted in Pender County in 2024 (0 in 5+ unit buildings).
Forward outlook
- Local home prices are declining (-3.0%/yr); year-one equity from $1k of loan paydown is wiped out by about $6k of value loss. Plan a longer hold.
- Pender County population projected at +38% by 2050 — long-run rental-demand tailwind backs the buy-and-hold thesis.
- At projected returns (-3.0% appreciation + 4.6% rent growth), your $59k cash investment doubles in ~10 years — after that, you're playing with house money.
Negotiation context
- Only 1 days on market — expect competitive offers; lowballing is unlikely to land.
Risks & watch-outs
- Climate carrying-cost: severe wind risk, 99% chance of damaging wind over 30y; major wildfire risk; extreme-heat days projected 7→19/yr by 2055 (HVAC capex compounding) — expect insurance premiums to compound above CPI over the hold.
Questions for the listing agent
- Is there a deadline driving the sale (1031 exchange, divorce, estate, relocation)? That informs how much negotiation room exists.
- Schools are D-rated, which usually means shorter tenancies and higher turnover. Who's the typical renter profile here, and what's been the actual vacancy rate?
- What's the average days-on-market for RENTAL listings here right now (not sales)? A rising rental-DOM trend means longer vacancies and softer asking-rent achievability than the comps imply.
- What's the recent tenant-quality profile in this submarket — average credit score on applications, eviction rate, late-payment / NSF rate, and stable-employment percentage? A property-management company in the area should have these aggregated.
- How much new for-sale + rental construction is in the pipeline within 1–3 miles? Heavy new supply typically softens prices + rents 12–24 months out; constrained supply supports both.
Investment metrics
- 1% rule
- 1.01% ✓
- Cap rate
- 8.84%
- Cash-on-cash
- 9.11%
- DSCR
- 1.41
- GRM
- 8.2
CMA / ARV
No comps found within radius.
Projected returns pro-forma
-3.0% appreciation · 4.57% rent growth · sell at horizon
- IRR
- -1.0%
- Equity multiple
- 0.96×
- Total profit
- $-2,300
- Equity at exit
- $31,312
- IRR
- 10.1%
- Equity multiple
- 1.83×
- Total profit
- $48,638
- Equity at exit
- $18,157
Cash invested: $58,800 (down + closing). Projections, not guarantees.
Landlord ↔ Tenant lean methodology
- Overall (STATE)
- 85 Strongly Landlord-Friendly
- State North Carolina
- 85 Strongly Landlord-Friendly · R+3
- County
- — inherits STATE
- City
- — inherits STATE
ZIP-level market 28443
- Rents YoY
- 4.6%
- Active inventory
- 509
- Price-to-rent
- 8.2×
Monthly cashflow live
- Estimated rent
- $2,127 medium interval (Pro) →
- Mortgage (P&I)
- −$1,101
- Tax from tax record
- −$46 /mo · $546/yr
- Insurance
- −$88
- HOA
- −$0
- Vacancy / Maint / Mgmt
- −$447
- Net cashflow
- $446
Break-even live
UW: 25.0% down · 7.5% · 30yr · 1.5% tax · 5.0% vac · 8.0% maint · 8.0% mgmt
Financing live
Cash to close
- Down payment
- $52,500
- Closing costs
- $6,300
- Reserves months
- —
- Total cash needed
- —
Loan-product check · same deal, 3 products live
Conventional
25% down · 7.5% · 30yr
- Down + closing
- —
- Monthly P&I
- —
- Monthly cashflow
- —
- DSCR
- —
- Eligible?
- —
Personal DTI + credit; lowest rate.
DSCR
20% down · 8.5% · 30yr
- Down + closing
- —
- Monthly P&I
- —
- Monthly cashflow
- —
- DSCR
- —
- Eligible?
- —
No personal income docs; deal must DSCR.
Hard money
10% down · 12.0% · 12mo
- Down + closing
- —
- Monthly P&I
- —
- Monthly cashflow
- —
- DSCR
- —
- Eligible?
- —
Short-term bridge; refi at stabilization.
Rent comps 3 comps
| Address | Beds | Baths | Sqft | Rent | $/sqft | DOM | Units | Dist |
|---|---|---|---|---|---|---|---|---|
| 792 Wildwood Cir Hampstead, NC | 3.0 | 2.5 | 1450 | $1,895 | $1.31 | 13d | 1 | 0.63mi |
| 26 Mullein Dr Hampstead, NC | 2.0–4.0 | 2.0–2.5 | 1542 | $2,460 | $1.60 | 13d | 21 | 1.00mi |
| 1874 Sloop Point Loop Rd Hampstead, NC | 3.0 | 1.0 | 1000 | $1,900 | $1.90 | 13d | 1 | 1.50mi |
Listing history 2 events
-
2026-06-18remarks 469-char remark
-
2026-06-18$210,000 Active 1 DOM
ⓘ Source: listings_history table (triggers on properties + properties_extension) + one-shot
backfill from property_details.listing_events for pre-trigger history.
Tax reassessment forecast NC · Resets to sale price
- Current annual tax
- $546 · $46/mo
- Projected year-2 tax
- $1,722 · $144/mo
- Expected delta
- +$1,176/yr (+$98/mo · 215.2%)
ⓘ Screening estimate from a state-policy table — verify with the county assessor before closing.
Climate risk First Street
- Flood 1/10 Low FEMA zone X (unshaded) · 0% chance over 30 yrs
- Wildfire 6/10 Major
- Heat 9/10 Extreme 7 d/yr ≥103°F today · 19 d/yr by 30 yrs out
- Wind 9/10 Extreme 99% chance of damaging wind over 30 yrs
- Air quality 2/10 Low 1 unhealthy d/yr today · 1 by 30 yrs out
Nearby sold comps map
Loading sold comps map…
Walkable amenities ~0.75 mi
Loading nearby amenities…
Taxation est. · year 1
- Rental income
- $25,526
- − Mortgage interest
- −$11,763
- − Property taxes
- −$546
- − Insurance
- −$1,050
- − Repairs & maintenance
- −$2,042
- − Management
- −$2,042
- − Depreciation
- −$6,109
- Taxable income
- $1,973
- Est. tax owed @ 24.0%
- −$474
- After-tax cash flow
- $4,881/yr
For passive investors: Depreciation is non-cash, so a rental often shows a tax loss while cash-flowing — sheltering income. Rental losses are passive: they offset passive income freely, and up to $25,000/yr can offset ordinary (W-2) income if you actively participate and your MAGI is under $100k (phasing out to $0 by $150k); unused losses carry forward. On sale, claimed depreciation is recaptured at up to 25%, and gains may owe capital-gains tax (a 1031 exchange can defer both). Figures are a year-1 estimate at your 24.0% rate — not tax advice; consult a CPA.
Schools (NCES district)
- District
- Pender County Schools
- NCES district ID
- 3703570
- Math proficiency
- 49% ▲ 3.00%
- Reading proficiency
- 50% ▬ 0.00%
- Median HH income
- $45,792
- Composite
- 41.97/100
- National rank
- #3342
- State rank
- #66 of 178 in NC
Livability — Surf City
- Score
- 64/100
- State rank
- #357
- US rank
- #14131
Category grades
Schools grade is shown separately in the Schools card above.
Census & demographics
- County
- Pender County · 28,416 people
- Metro
- Wilmington, NC
- Population (ZIP)
- 28,416
- Household income
- $90,477
- Rent vs Own
- Severe rent burden
- 700.0
Population outlook (Pender County) Hauer SSP2
- Today (2025)
- 69,295 people
- By 2030
- 74,990 · +8.2%
- By 2040
- 85,954 · +24.0%
- By 2050
- 95,925 · +38.4%
- By 2075
- 117,525 · +69.6%
- By 2100
- 129,074 · +86.3%
Race, ethnicity, and origin ACS 2023
- Neighborhood character
- Predominantly White (82%)
- Race & ethnicity
- White 82% Two or more races 7% Black 5% Hispanic / Latino 5% Asian 1%
- Hispanic origin (detail)
- Mexican 4%
- Common ancestry
- Slovak 3% Romanian 3% Serbian 2%
- Foreign-born
- 4% · Canada
- Languages at home
- 94% English-only · Spanish 4% Other Indo-European 1%
Political lean MEDSL · Pender
- 2024 margin
- Solid R (+35.0) · D 32.1% · R 67.0%
- 2008→2024 swing
- -19.4pp toward R · 2008: -15.6pp · 2024: -35.0pp
- All cycles
- 2024: R+35.0 2020: R+29.9 2016: R+30.4 2012: R+20.4 2008: R+15.6
Not yet ingested
- Civics
- —
Market trends
- HPI YoY
- ▼ -125.51%
- Current HPI
- 188.426
- Rent YoY
- ▲ 4.57%
- Metro
- Wilmington, NC
- State GDP YoY
- ▲ 3.28%
- F500 in state
- 26
Industry mix (Fortune 500 HQ in NC)
| Industry | F500 HQs | Revenue |
|---|---|---|
| Financial Services | 2 | $213B |
|
||
| Retail | 2 | $95B |
|
||
| Industrial Conglomerate | 1 | $38B |
|
||
| Metals / Steel | 1 | $35B |
|
||
| Utilities | 1 | $30B |
|
||
| Industrial Machinery | 1 | $19B |
|
||
Price history
1 event — show timeline
- 2026-06-18 Listed $210,000 Hive MLS
Property tax history
+11.4%/yrLatest (2025): $546 · -26.8% YoY. Source: county tax records.
Cash-flow waterfall
monthlySold comps — $/sqft
last 12 mo · ≤1 miLoading sold comps…