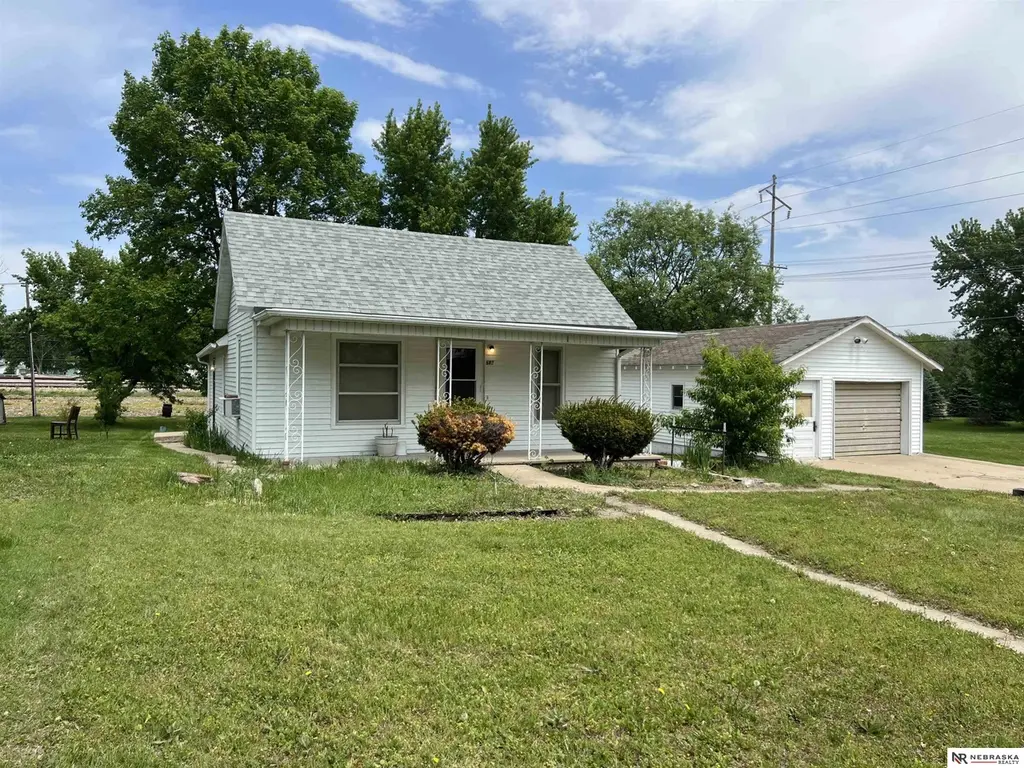
582 Calhoun St · Tecumseh, NE
Flood risk 1/10 · Minimal
- FEMA flood zone
- X (unshaded)
- Chance of flooding over 30 yrs
- 0.0%
- Est. flood insurance / yr
- $507 – $1,088
Fire risk 4/10 · Minor
- Est. fire insurance / yr
- $1,161 – $2,155
Heat risk 3/10 · Minor
- Hot days now (above 106°F)
- 7 days/yr
- Hot days in 30 yrs
- 16 days/yr
Wind risk 2/10 · Minimal
- Chance of severe wind over 30 yrs
- —
Air-quality risk 2/10 · Minimal
- Unhealthy air days now
- 0 days/yr
- Unhealthy air days in 30 yrs
- 1 days/yr
Risk factors via First Street. Map © Google.
Why this score? — see what drove the B grade
The composite is a weighted blend of 9 inputs, each scored 0–100. Each bar is that input's sub-score; the figure is the points it added to the 100-point composite (weight × sub-score).
- Cash flow +24.6/30.0
- ARV discount +15.0/15.0
- DSCR +7.9/10.0
- Appreciation +5.8/10.0
- 1% rule +5.4/10.0
- Schools +4.0/10.0
- Livability +3.7/5.0
- Rent growth +2.5/5.0
- Condition / age +2.5/5.0
$84,900
🖨 Deal sheet 📄 Offer letter ✓ Due diligence
Listing remarks
Welcome 582 Calhoun, a charming Move-in ready 2 bedroom 1 Bathroom home with main floor Laundry! This property features a detached 1.5 stall garage on a spacious over Quarter acre lot! Newer roof and water heater bring piece of mind. Freshly painted exterior brings this home to life. Fully functional baseboard heating. Situated across the street from a Cornfield, this home blends city amenities with small town living. Priced to sell, make this your home and piece of paradise!
Key facts
- Newer roof
- Main floor laundry
- Newer water heater
Tags
Property features AI
Exterior
- Parking: Detached garage (1 covered space, 1 total parking space)
- Utilities: Public water
- Home design: Single family residence; Residential property; Built in 1905; Living area about 936 square feet
- Construction: Stone foundation; Composition roof
- Exterior features: Porch; Shed(s); Lot approximately 0.29 acres (about 66 x 190); Lot size over 1/4 up to 1/2 acre
Interior
- Kitchen: Range; Refrigerator; Dishwasher; Microwave; Disposal
- Bedrooms: Master bedroom on the main floor; Second bedroom on the main floor
- Bathrooms: One full bathroom (main floor)
- Heating & cooling: Electric baseboard heating; Window air conditioning units
- Interior features: No basement; Porch
- Laundry & utility: Washer; Dryer
Neighborhood map
What this means for you Summary
Snapshot
- This is a 2-bed/2.0-bath single-family listed at $85k.
Deal economics
- At list price, monthly cash flow is $175 ($2k/yr) — positive.
- The deal already cash-flows at list — no discount required.
- Meets the 1% rule at list price ($884 rent vs $85k).
- Recommended offer: $84k (1.5% below list) — sets the bar for market timing.
Location & tenants
- Location reads 74/100 on livability (#108 in NE, #4,391 nationally) — a middle-class / working-renter tenant base. Strengths: crime A+, cost of living A+, housing A+; Watch: schools C-, amenities F, commute F.
- Johnson County Central Public Schools (rural): math 47% / reading 48% proficiency, ranked #73 of 111 in NE (top 66%) — families likely to look elsewhere, expect single-tenant / working-renter base with shorter leases.
- Market conditions: 14 active listings in the ZIP; 4 units permitted in Johnson County in 2024 (0 in 5+ unit buildings).
Forward outlook
- In year one you build about $2k of equity ($587 loan paydown + $1k appreciation (1.6% local appreciation)).
- Johnson County population projected at +10% by 2050 — modest demand growth; plan on rents tracking national, not racing it.
- At projected returns (1.6% appreciation + 3.0% rent growth), your $24k cash investment doubles in ~6 years — after that, you're playing with house money.
Negotiation context
- It's been on market 24 days — a 2% lower offer ($84k) is reasonable based on typical stale-listing flexibility.
- 3 sale attempts with the ask held roughly flat each time — persistent listings suggest the price (not the market) is what's stuck; bring a comps-based counter.
- Current owner paid $22k; list at $85k implies a 277% gain — meaningful room to come down on a strong offer.
Risks & watch-outs
- Watch-outs: built in 1905 — expect roof / HVAC / electrical / plumbing capex.
Questions for the listing agent
- Built in 1905 — when were the roof, HVAC, electrical panel, plumbing, and water heater last replaced?
- Is there a deadline driving the sale (1031 exchange, divorce, estate, relocation)? That informs how much negotiation room exists.
- What's the average days-on-market for RENTAL listings here right now (not sales)? A rising rental-DOM trend means longer vacancies and softer asking-rent achievability than the comps imply.
- What's the recent tenant-quality profile in this submarket — average credit score on applications, eviction rate, late-payment / NSF rate, and stable-employment percentage? A property-management company in the area should have these aggregated.
- How much new for-sale + rental construction is in the pipeline within 1–3 miles? Heavy new supply typically softens prices + rents 12–24 months out; constrained supply supports both.
Investment metrics
- 1% rule
- 1.04% ✓
- Cap rate
- 8.76%
- Cash-on-cash
- 8.83%
- DSCR
- 1.39
- GRM
- 8.0
CMA / ARV
- ARV (median comp)
- $137,301
- List price
- $84,900
- Delta
- -38.16%
- Verdict
- UNDERPRICED
- Comps
- 12 within 1.0 mi
Show comp detail 1 sale within ~0.75 mi
| Address | Dist | Beds/Ba | Sqft | Sold | Price | $/sf | Match |
|---|---|---|---|---|---|---|---|
| 253 N 3rd St | 0.49mi | 2/2.0 | 960 (+3%) | 7mo | $208,000 | $217 | 67 |
Match score weights: distance 35% · size 25% · config 20% · recency 20%. Top-matched comps best support the ARV.
Projected returns pro-forma
1.62% appreciation · 3.0% rent growth · sell at horizon
- IRR
- 12.2%
- Equity multiple
- 1.64×
- Total profit
- $15,304
- Equity at exit
- $31,755
- IRR
- 15.3%
- Equity multiple
- 2.97×
- Total profit
- $46,798
- Equity at exit
- $44,432
Cash invested: $23,772 (down + closing). Projections, not guarantees.
Landlord ↔ Tenant lean methodology
- Overall (STATE)
- 83 Strongly Landlord-Friendly
- State Nebraska
- 83 Strongly Landlord-Friendly · R+13
- County
- — inherits STATE
- City
- — inherits STATE
ZIP-level market 68450
- Home prices YoY
- 0.9%
- Active inventory
- 14
- Price-to-rent
- 8.0×
Monthly cashflow live
- Estimated rent
- $884 medium interval (Pro) →
- Mortgage (P&I)
- −$445
- Tax from tax record
- −$43 /mo · $511/yr
- Insurance
- −$35
- HOA
- −$0
- Vacancy / Maint / Mgmt
- −$186
- Net cashflow
- $175
Break-even live
UW: 25.0% down · 7.5% · 30yr · 1.5% tax · 5.0% vac · 8.0% maint · 8.0% mgmt
Financing live
Cash to close
- Down payment
- $21,225
- Closing costs
- $2,547
- Reserves months
- —
- Total cash needed
- —
Loan-product check · same deal, 3 products live
Conventional
25% down · 7.5% · 30yr
- Down + closing
- —
- Monthly P&I
- —
- Monthly cashflow
- —
- DSCR
- —
- Eligible?
- —
Personal DTI + credit; lowest rate.
DSCR
20% down · 8.5% · 30yr
- Down + closing
- —
- Monthly P&I
- —
- Monthly cashflow
- —
- DSCR
- —
- Eligible?
- —
No personal income docs; deal must DSCR.
Hard money
10% down · 12.0% · 12mo
- Down + closing
- —
- Monthly P&I
- —
- Monthly cashflow
- —
- DSCR
- —
- Eligible?
- —
Short-term bridge; refi at stabilization.
Listing history 10 events
-
2026-06-18days on market $84,900 Active 24 DOM
-
2026-06-17days on market $84,900 Active 23 DOM
-
2026-06-16statusdays on market $84,900 Active 22 DOM
-
2026-06-15days on market $84,900 Back On Market 21 DOM
-
2026-06-13days on market $84,900 Back On Market 19 DOM
-
2026-06-12statusdays on market $84,900 Back On Market 18 DOM
-
2026-05-13status Active 480-char remark
-
2026-05-13historical 480-char remark
-
2026-05-02$84,900 New 480-char remark
-
2003-05-16soldstatus $22,500
ⓘ Source: listings_history table (triggers on properties + properties_extension) + one-shot
backfill from property_details.listing_events for pre-trigger history.
Tax reassessment forecast NE · Resets to sale price
- Current annual tax
- $511 · $43/mo
- Projected year-2 tax
- $1,469 · $122/mo
- Expected delta
- +$958/yr (+$80/mo · 187.6%)
ⓘ Screening estimate from a state-policy table — verify with the county assessor before closing.
Climate risk First Street
- Flood 1/10 Low FEMA zone X (unshaded) · 0% chance over 30 yrs
- Wildfire 4/10 Moderate
- Heat 3/10 Moderate 7 d/yr ≥106°F today · 16 d/yr by 30 yrs out
- Wind 2/10 Low
- Air quality 2/10 Low 0 unhealthy d/yr today · 1 by 30 yrs out
Nearby sold comps map
Loading sold comps map…
Walkable amenities ~0.75 mi
Loading nearby amenities…
Taxation est. · year 1
- Rental income
- $10,603
- − Mortgage interest
- −$4,756
- − Property taxes
- −$511
- − Insurance
- −$424
- − Repairs & maintenance
- −$848
- − Management
- −$848
- − Depreciation
- −$2,470
- Taxable income
- $746
- Est. tax owed @ 24.0%
- −$179
- After-tax cash flow
- $1,919/yr
For passive investors: Depreciation is non-cash, so a rental often shows a tax loss while cash-flowing — sheltering income. Rental losses are passive: they offset passive income freely, and up to $25,000/yr can offset ordinary (W-2) income if you actively participate and your MAGI is under $100k (phasing out to $0 by $150k); unused losses carry forward. On sale, claimed depreciation is recaptured at up to 25%, and gains may owe capital-gains tax (a 1031 exchange can defer both). Figures are a year-1 estimate at your 24.0% rate — not tax advice; consult a CPA.
Schools (NCES district)
- District
- Johnson County Central Public Schools
- NCES district ID
- 3100176
- Math proficiency
- 47% ▲ 3.00%
- Reading proficiency
- 48% ▲ 1.00%
- Median HH income
- $44,058
- Composite
- 40.15/100
- National rank
- #3795
- State rank
- #73 of 111 in NE
Livability — Tecumseh
- Score
- 74/100
- State rank
- #108
- US rank
- #4391
Category grades
Schools grade is shown separately in the Schools card above.
Census & demographics
- Census place
- Tecumseh, NE
- Population (ZIP)
- 3,111
Population outlook (Johnson County) Hauer SSP2
- Today (2025)
- 5,198 people
- By 2030
- 5,231 · +0.6%
- By 2040
- 5,408 · +4.0%
- By 2050
- 5,699 · +9.6%
- By 2075
- 6,747 · +29.8%
- By 2100
- 7,066 · +35.9%
Race, ethnicity, and origin ACS 2023
- Neighborhood character
- Predominantly White (67%)
- Race & ethnicity
- White 67% Hispanic / Latino 18% Two or more races 9% Black 8% Native American 2% Asian 2%
- Hispanic origin (detail)
- Mexican 14% Puerto Rican 1%
- Common ancestry
- Iranian 2% Romanian 1% Serbian 1%
- Foreign-born
- 6% · Canada
- Languages at home
- 84% English-only · Spanish 13% Other Asian/Pacific 2%
Political lean MEDSL · Johnson
- 2024 margin
- Solid R (+40.5) · D 29.0% · R 69.5% · Other 1.4%
- 2008→2024 swing
- -29.7pp toward R · 2008: -10.8pp · 2024: -40.5pp
- All cycles
- 2024: R+40.5 2020: R+39.0 2016: R+38.4 2012: R+21.1 2008: R+10.8
Not yet ingested
- Civics
- —
Market trends
- HPI YoY
- ▲ 1.62%
- Current HPI
- 178.9214
- Rent YoY
- —
- Metro
- —
- State GDP YoY
- ▲ 0.68%
- F500 in state
- 2
Industry mix (Fortune 500 HQ in NE)
| Industry | F500 HQs | Revenue |
|---|---|---|
| Conglomerate | 1 | $371B |
|
||
Price history
+277.3% since first listed6 events — show timeline
- 2026-06-11 Relisted — GPRMLS
- 2026-05-29 Pending — GPRMLS
- 2026-05-13 Relisted — GPRMLS
- 2026-05-13 Listing Removed — GPRMLS
- 2026-05-02 Listed $84,900 GPRMLS
- 2003-05-16 Sold (Public Records) $22,500 Public Records
Cash-flow waterfall
monthlySold comps — $/sqft
last 12 mo · ≤1 miLoading sold comps…