227 Quail Run Rd · Tool, TX
Flood risk No data
- FEMA flood zone
- —
- Chance of flooding over 30 yrs
- —
- Est. flood insurance / yr
- —
Fire risk No data
- Est. fire insurance / yr
- —
Heat risk No data
- Hot days now (above threshold)
- —
- Hot days in 30 yrs
- —
Wind risk No data
- Chance of severe wind over 30 yrs
- —
Air-quality risk No data
- Unhealthy air days now
- —
- Unhealthy air days in 30 yrs
- —
Risk factors via First Street. Map © Google.
Why this score? — see what drove the B+ grade
The composite is a weighted blend of 9 inputs, each scored 0–100. Each bar is that input's sub-score; the figure is the points it added to the 100-point composite (weight × sub-score).
- Cash flow +30.0/30.0
- DSCR +10.0/10.0
- 1% rule +9.0/10.0
- ARV discount +8.5/15.0
- Appreciation +5.5/10.0
- Schools +4.3/10.0
- Condition / age +4.0/5.0
- Livability +3.3/5.0
- Rent growth +2.5/5.0
$265,000
🖨 Deal sheet 📄 Offer letter ✓ Due diligence
Listing remarks MLS
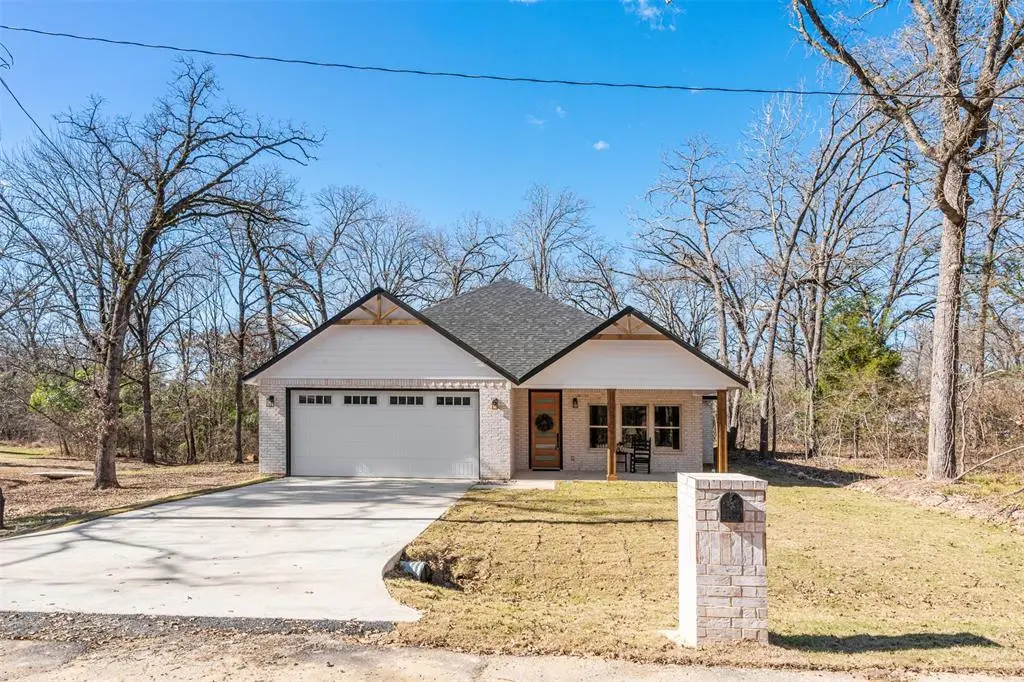
Discover modern lake-area living in this brand-new 2025 build located in a gated waterfront community in Trinidad. This 3-bedroom, 2-bath home offers approximately 1,500 sq ft with an open floor plan that centers around a stylish kitchen island, creating the perfect space for cooking, gathering, and entertaining. Contemporary finishes, abundant natural light, and a bright, airy layout make the home feel inviting and functional. Enjoy the peace of a private, HOA-maintained neighborhood with lake access and secure entry. Whether you're looking for a primary residence, vacation home, or investment property, this new construction delivers the low-maintenance lifestyle buyers want near Cedar Creek Lake.
Key facts
- Open floor plan
- Lake access
- 6,578 sq ft lot
Tags
Neighborhood map
What this means for you Summary
Snapshot
- This is a 3-bed/2.0-bath single-family listed at $265k. Condition is rated good.
Deal economics
- At list price, monthly cash flow is $1k ($13k/yr) — positive.
- The deal already cash-flows at list — no discount required.
- Meets the 1% rule at list price ($4k rent vs $265k).
- Recommended offer: $233k (12.0% below list) — sets the bar for market timing.
- Cap rate 11.1% vs local median 2.8% in Tool — top-decile yield for the area; either an underpriced asset or a hidden risk that comps aren't pricing in. Stress-test before assuming the spread holds.
Location & tenants
- Location reads 66/100 on livability (#651 in TX) — a middle-class / working-renter tenant base. Strengths: crime A+, cost of living A+, housing A+; Watch: employment D, amenities F, commute F.
- Malakoff ISD (town): math 48% / reading 54% proficiency, ranked #187 of 826 in TX (top 23%) — acceptable for families but not a draw, mixed tenant base, ~2y average lease; 61% free/reduced lunch — lower-income household profile, screen leases tightly.
- Market conditions: 162 active listings in the ZIP; 3 comparable units currently listed for rent nearby; rentals lingering (median 44d on market — plan ~5-8 weeks vacancy on turnover, expect pricing pressure); 100% of comp listings sitting > 30 days — soft ceiling on asking rent; 263 units permitted in Henderson County in 2024 (0 in 5+ unit buildings).
Forward outlook
- In year one you build about $5k of equity ($2k loan paydown + $3k appreciation (1.0% local appreciation)).
- At projected returns (1.0% appreciation + 3.0% rent growth), your $74k cash investment doubles in ~4 years — after that, you're playing with house money.
- By year 7, paydown + projected appreciation supports a ~$31k cash-out refi (75% LTV) — recoverable capital for the next deal without selling this one.
Negotiation context
- It's been on market 141 days — a 12% lower offer ($233k) is reasonable based on typical stale-listing flexibility.
Questions for the listing agent
- It's been on market 141 days. Have you received any prior offers? Is the seller open to a 12% concession, seller financing, or rate buy-down credit?
- What does the HOA fee cover, when was the last increase, and are there any pending special assessments or reserve-fund shortfalls?
- Why hasn't it sold? Are there any deal-killer items the seller is aware of (foundation, flood, title, zoning, code violations)?
- Is there a deadline driving the sale (1031 exchange, divorce, estate, relocation)? That informs how much negotiation room exists.
- What's the average days-on-market for RENTAL listings here right now (not sales)? A rising rental-DOM trend means longer vacancies and softer asking-rent achievability than the comps imply.
- What's the recent tenant-quality profile in this submarket — average credit score on applications, eviction rate, late-payment / NSF rate, and stable-employment percentage? A property-management company in the area should have these aggregated.
- How much new for-sale + rental construction is in the pipeline within 1–3 miles? Heavy new supply typically softens prices + rents 12–24 months out; constrained supply supports both.
Investment metrics
- 1% rule
- 1.40% ✓
- Cap rate
- 11.09%
- Cash-on-cash
- 17.13%
- DSCR
- 1.76
- GRM
- 5.9
CMA / ARV
- ARV (median comp)
- $271,200
- List price
- $265,000
- Delta
- -2.29%
- Verdict
- FAIR
- Comps
- 20 within 1.0 mi
Show comp detail 12 sales within ~0.75 mi
| Address | Dist | Beds/Ba | Sqft | Sold | Price | $/sf | Match |
|---|---|---|---|---|---|---|---|
| 212 E Beachwood Loop | 0.15mi | 3/2.0 | 1,500 (-4%) | 1mo | $272,500 | $182 | 85 |
| 127 Parkside Dr | 0.32mi | 3/2.0 | 1,590 (+2%) | 0mo | $298,900 | $188 | 82 |
| 202 Morning Dove Dr | 0.23mi | 3/2.0 | 1,606 (+3%) | 5mo | $269,900 | $168 | 80 |
| 207 Driftwood Dr | 0.17mi | 3/2.0 | 1,721 (+10%) | 2mo | $317,000 | $184 | 73 |
| 110 Dogwood Dr | 0.35mi | 3/2.0 | 1,602 (+3%) | 7mo | $279,000 | $174 | 73 |
| 113 Dogwood Dr | 0.34mi | 4/2.0 (+1) | 1,618 (+4%) | 5mo | $295,000 | $182 | 69 |
| 100 Indian Blanket Ln | 0.46mi | 3/2.5 | 1,534 (-2%) | 8mo | $345,000 | $225 | 67 |
| 109 Dogwood Dr | 0.37mi | 3/2.0 | 1,656 (+6%) | 7mo | $275,000 | $166 | 67 |
| 118 Channelview Dr | 0.44mi | 3/2.0 | 1,467 (-6%) | 4mo | $258,900 | $176 | 66 |
| 119 Driftwood Dr | 0.39mi | 3/2.0 | 1,645 (+5%) | 8mo | $254,900 | $155 | 66 |
| 105 Oakwood Dr | 0.52mi | 3/2.0 | 1,500 (-4%) | 4mo | $289,900 | $193 | 66 |
| 102 Channelview | 0.48mi | 3/2.0 | 1,450 (-7%) | 2mo | $269,000 | $186 | 64 |
Match score weights: distance 35% · size 25% · config 20% · recency 20%. Top-matched comps best support the ARV.
Projected returns pro-forma
1.03% appreciation · 3.0% rent growth · sell at horizon
- IRR
- 19.2%
- Equity multiple
- 1.98×
- Total profit
- $72,937
- Equity at exit
- $90,943
- IRR
- 22.3%
- Equity multiple
- 3.71×
- Total profit
- $201,021
- Equity at exit
- $121,224
Cash invested: $74,200 (down + closing). Projections, not guarantees.
Landlord ↔ Tenant lean methodology
- Overall (STATE)
- 87 Strongly Landlord-Friendly
- State Texas
- 87 Strongly Landlord-Friendly · R+5
- County
- — inherits STATE
- City
- — inherits STATE
ZIP-level market 75163
- Home prices YoY
- 0.5%
- Active inventory
- 162
- Price-to-rent
- 5.9×
Monthly cashflow live
- Estimated rent
- $3,717 medium interval (Pro) →
- Mortgage (P&I)
- −$1,390
- Tax est. 1.5%
- −$331 /mo · $3,975/yr
- Insurance
- −$110
- HOA
- −$46
- Vacancy / Maint / Mgmt
- −$781
- Net cashflow
- $1,059
Break-even live
UW: 25.0% down · 7.5% · 30yr · 1.5% tax · 5.0% vac · 8.0% maint · 8.0% mgmt
Financing live
Cash to close
- Down payment
- $66,250
- Closing costs
- $7,950
- Reserves months
- —
- Total cash needed
- —
Loan-product check · same deal, 3 products live
Conventional
25% down · 7.5% · 30yr
- Down + closing
- —
- Monthly P&I
- —
- Monthly cashflow
- —
- DSCR
- —
- Eligible?
- —
Personal DTI + credit; lowest rate.
DSCR
20% down · 8.5% · 30yr
- Down + closing
- —
- Monthly P&I
- —
- Monthly cashflow
- —
- DSCR
- —
- Eligible?
- —
No personal income docs; deal must DSCR.
Hard money
10% down · 12.0% · 12mo
- Down + closing
- —
- Monthly P&I
- —
- Monthly cashflow
- —
- DSCR
- —
- Eligible?
- —
Short-term bridge; refi at stabilization.
Rent comps 3 comps
| Address | Beds | Baths | Sqft | Rent | $/sqft | DOM | Units | Dist |
|---|---|---|---|---|---|---|---|---|
| 102 Plumthicket Ln Trinidad, TX | 3.0 | 2.0 | 1200 | $1,495 | $1.25 | 44d | 1 | 1.06mi |
| 100 Plumthicket Ln Trinidad, TX | 3.0 | 2.0 | 1200 | $1,495 | $1.25 | 44d | 1 | 1.08mi |
| 1012 Chestnut Dr Unit 1301590P Tool, TX | 3.0 | 2.0 | 1894 | $8,514 | $4.50 | 44d | 1 | 1.24mi |
HOA detail
- Monthly dues
- $46 · $552/yr
- Likely covers
- watersecurity
Listing history 16 events
-
2026-06-19days on market $265,000 Active 141 DOM
-
2026-06-18days on market $265,000 Active 140 DOM
-
2026-06-17days on market $265,000 Active 139 DOM
-
2026-06-16days on market $265,000 Active 138 DOM
-
2026-06-15days on market $265,000 Active 137 DOM
-
2026-06-14days on market $265,000 Active 135 DOM
-
2026-06-12days on market $265,000 Active 134 DOM
-
2026-06-09days on market $265,000 Active 131 DOM
-
2026-06-08days on market $265,000 Active 130 DOM
-
2026-06-07days on market $265,000 Active 129 DOM
-
2026-06-02days on market $265,000 Active 124 DOM
-
2026-06-01days on market $265,000 Active 123 DOM
-
2026-05-31days on market $265,000 Active 122 DOM
-
2026-05-30days on market $265,000 Active 121 DOM
-
2026-04-13price $265,000 707-char remark
Show marketing remark (707 chars)
Discover modern lake-area living in this brand-new 2025 build located in a gated waterfront community in Trinidad. This 3-bedroom, 2-bath home offers approximately 1,500 sq ft with an open floor plan that centers around a stylish kitchen island, creating the perfect space for cooking, gathering, and entertaining. Contemporary finishes, abundant natural light, and a bright, airy layout make the home feel inviting and functional. Enjoy the peace of a private, HOA-maintained neighborhood with lake access and secure entry. Whether you're looking for a primary residence, vacation home, or investment property, this new construction delivers the low-maintenance lifestyle buyers want near Cedar Creek Lake.
-
2026-01-18$305,000 Active 707-char remark
Show marketing remark (707 chars)
Discover modern lake-area living in this brand-new 2025 build located in a gated waterfront community in Trinidad. This 3-bedroom, 2-bath home offers approximately 1,500 sq ft with an open floor plan that centers around a stylish kitchen island, creating the perfect space for cooking, gathering, and entertaining. Contemporary finishes, abundant natural light, and a bright, airy layout make the home feel inviting and functional. Enjoy the peace of a private, HOA-maintained neighborhood with lake access and secure entry. Whether you're looking for a primary residence, vacation home, or investment property, this new construction delivers the low-maintenance lifestyle buyers want near Cedar Creek Lake.
ⓘ Source: listings_history table (triggers on properties + properties_extension) + one-shot
backfill from property_details.listing_events for pre-trigger history.
Nearby sold comps map
Loading sold comps map…
Walkable amenities ~0.75 mi
Loading nearby amenities…
Taxation est. · year 1
- Rental income
- $44,603
- − Mortgage interest
- −$14,844
- − Property taxes
- −$3,975
- − Insurance
- −$1,325
- − Repairs & maintenance
- −$3,568
- − Management
- −$3,568
- − HOA
- −$552
- − Depreciation
- −$7,709
- Taxable income
- $9,061
- Est. tax owed @ 24.0%
- −$2,175
- After-tax cash flow
- $10,533/yr
For passive investors: Depreciation is non-cash, so a rental often shows a tax loss while cash-flowing — sheltering income. Rental losses are passive: they offset passive income freely, and up to $25,000/yr can offset ordinary (W-2) income if you actively participate and your MAGI is under $100k (phasing out to $0 by $150k); unused losses carry forward. On sale, claimed depreciation is recaptured at up to 25%, and gains may owe capital-gains tax (a 1031 exchange can defer both). Figures are a year-1 estimate at your 24.0% rate — not tax advice; consult a CPA.
Condition & rehab AI · 12 photos
This modern, well-maintained home in a gated waterfront community offers a low-maintenance lifestyle with a fresh paint job and landscaping improvements to further enhance its value.
Value-add opportunities
- Both Painting exterior and interior walls — Fresh paint can enhance curb appeal and interior aesthetics.
- Both Landscaping improvements — Enhanced landscaping can increase curb appeal and property value.
- Both Add a small garden or flower bed near the front door — A small garden can improve curb appeal and add value to the property.
Renovation cost estimate screening
Value-add ROI direction
- Both Painting exterior and interior walls — Fresh paint can enhance curb appeal and interior aesthetics. ↑
- Both Landscaping improvements — Enhanced landscaping can increase curb appeal and property value. ↑
- Both Add a small garden or flower bed near the front door — A small garden can improve curb appeal and add value to the property. ↑
ⓘ Cost ranges are severity-bucket heuristics (US national rule-of-thumb). Get contractor quotes + a written scope before underwriting a rehab budget.
Schools (NCES district)
- District
- Malakoff ISD
- NCES district ID
- 4828780
- Math proficiency
- 48% ▼ -14.00%
- Reading proficiency
- 54% ▼ -5.00%
- Median HH income
- $38,970
- Composite
- 42.54/100
- National rank
- #3200
- State rank
- #187 of 826 in TX
Livability — Tool
- Score
- 66/100
- State rank
- #651
- US rank
- #12292
Category grades
Schools grade is shown separately in the Schools card above.
Census & demographics
- Population (ZIP)
- 2,569
Population outlook (Henderson County) Hauer SSP2
- Today (2025)
- 80,471 people
- By 2030
- 80,608 · +0.2%
- By 2040
- 80,087 · -0.5%
- By 2050
- 78,208 · -2.8%
- By 2075
- 72,423 · -10.0%
- By 2100
- 61,012 · -24.2%
Race, ethnicity, and origin ACS 2023
- Neighborhood character
- Predominantly White (77%)
- Race & ethnicity
- White 77% Two or more races 11% Hispanic / Latino 9% Black 6%
- Hispanic origin (detail)
- Mexican 8%
- Common ancestry
- Serbian 3% Lithuanian 1% European 1%
- Foreign-born
- 7% · Canada, Jamaica
- Languages at home
- 84% English-only · Arabic 10% Spanish 6%
Political lean MEDSL · Henderson
- 2024 margin
- Solid R (+63.5) · D 18.0% · R 81.4%
- 2008→2024 swing
- -18.8pp toward R · 2008: -44.6pp · 2024: -63.5pp
- All cycles
- 2024: R+63.5 2020: R+60.2 2016: R+60.0 2012: R+54.8 2008: R+44.6
Not yet ingested
- Civics
- —
Market trends
- HPI YoY
- ▲ 1.03%
- Current HPI
- 211.6125
- Rent YoY
- —
- Metro
- —
- State GDP YoY
- ▲ 3.95%
- F500 in state
- 110
Industry mix (Fortune 500 HQ in TX)
| Industry | F500 HQs | Revenue |
|---|---|---|
| Energy | 16 | $1,198B |
|
||
| Technology | 5 | $198B |
|
||
| Engineering / Construction | 4 | $72B |
|
||
| Energy Services | 3 | $60B |
|
||
| Utilities | 3 | $41B |
|
||
| Healthcare | 2 | $330B |
|
||
Price history
-13.1% since first listed2 events — show timeline
- 2026-04-13 Price Changed $265,000 NTREIS
- 2026-01-18 Listed $305,000 NTREIS
Cash-flow waterfall
monthlySold comps — $/sqft
last 12 mo · ≤1 miLoading sold comps…