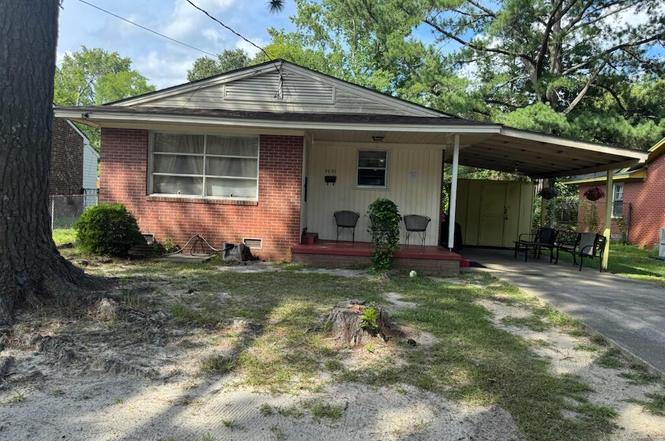
1021 Burt St · Rocky Mount, NC
Flood risk 1/10 · Minimal
- FEMA flood zone
- X (unshaded)
- Chance of flooding over 30 yrs
- 0.0%
- Est. flood insurance / yr
- $507 – $1,088
Fire risk 3/10 · Minor
- Est. fire insurance / yr
- $906 – $1,684
Heat risk 7/10 · Major
- Hot days now (above 107°F)
- 7 days/yr
- Hot days in 30 yrs
- 16 days/yr
Wind risk 6/10 · Moderate
- Chance of severe wind over 30 yrs
- 68.0%
Air-quality risk 2/10 · Minimal
- Unhealthy air days now
- 1 days/yr
- Unhealthy air days in 30 yrs
- 2 days/yr
Risk factors via First Street. Map © Google.
Why this score? — see what drove the B grade
The composite is a weighted blend of 9 inputs, each scored 0–100. Each bar is that input's sub-score; the figure is the points it added to the 100-point composite (weight × sub-score).
- Cash flow +30.0/30.0
- ARV discount +11.2/15.0
- DSCR +10.0/10.0
- 1% rule +9.1/10.0
- Livability +3.5/5.0
- Rent growth +2.5/5.0
- Condition / age +2.5/5.0
- Schools +2.0/10.0
- Appreciation +0.0/10.0
$100,000
🖨 Deal sheet 📄 Offer letter ✓ Due diligence
Listing remarks MLS
Nice and neat 3BR 1BA move in ready home. Excellent for first time buyer or investor.
Key facts
- 8,250 sq ft lot
- Built 1961
- Listed 134 days
Property features AI
Finance
- Other: Zoning: R6; Road frontage on city street and state road; Lot dimensions approximately 55 x 150 (0.19 acres)
Exterior
- Parking: On-site parking
- Security: Smoke detector(s)
- Utilities: Public water; Sewer connected; Water connected; Cable available
- Home design: Single family residence; One level
- Construction: Brick construction; Brick/mortar foundation; Shingle roof; Built as residential single family
- Exterior features: Porch; Storm door(s); Chain link fencing; Has a view
Interior
- Kitchen: Eat-in kitchen
- Bedrooms: 5 total rooms (includes bedrooms and living spaces)
- Flooring: Wood
- Bathrooms: 1 full bathroom
- Heating & cooling: Central air; Forced air heating; Natural gas heating
- Interior features: Eat-in kitchen; Wood flooring; Smoke detector(s)
Neighborhood map
What this means for you Summary
Snapshot
- This is a 3-bed/1.0-bath single-family listed at $100k.
Deal economics
- At list price, monthly cash flow is $505 ($6k/yr) — positive.
- The deal already cash-flows at list — no discount required.
- Meets the 1% rule at list price ($1k rent vs $100k).
- Recommended offer: $88k (12.0% below list) — sets the bar for market timing.
- Cap rate 12.4% vs local median 4.5% in Rocky Mount — top-decile yield for the area; either an underpriced asset or a hidden risk that comps aren't pricing in. Stress-test before assuming the spread holds.
Location & tenants
- Location reads 70/100 on livability (#134 in NC) — a middle-class / working-renter tenant base. Strengths: cost of living A+, housing A+, health & safety A+; Watch: crime F, amenities F, employment F.
- Edgecombe County Public Schools (rural): math 21% / reading 27% proficiency, ranked #163 of 178 in NC (top 92%) — low school quality limits family demand, transient renter base, plan for 1-2y turnover; 74% free/reduced lunch — lower-income household profile, screen leases tightly.
- Zoned schools: North Edgecombe High (math 15% / reading 24%, grade F, #492 of 535 statewide, top 93%, 229 students, 99% FRL) — zoned schools average 99% FRL vs 74% district-wide (25 pts higher); higher-poverty schools than district average — tighter screening recommended.
- Market conditions: 133 active listings in the ZIP; lower-income renter base — watch delinquency; 50 units permitted in Edgecombe County in 2024 (5 in 5+ unit buildings).
- This rent runs 38% of the median local income ($45k/yr) — at the standard rent-burdened threshold; future hikes will face affordability resistance.
Forward outlook
- Local home prices are declining (-3.0%/yr); year-one equity from $691 of loan paydown is wiped out by about $3k of value loss. Plan a longer hold.
- Edgecombe County population projected at -34% by 2050 — secular population decline; favor cash flow + early exit over multi-decade hold.
- At projected returns (-3.0% appreciation + 3.0% rent growth), your $28k cash investment doubles in ~6 years — after that, you're playing with house money.
Negotiation context
- It's been on market 135 days — a 12% lower offer ($88k) is reasonable based on typical stale-listing flexibility.
- 4 sale attempts since 12y ago with the ask held roughly flat each time — persistent listings suggest the price (not the market) is what's stuck; bring a comps-based counter.
- Current owner paid $23k; list at $100k implies a 335% gain — meaningful room to come down on a strong offer.
Risks & watch-outs
- Climate carrying-cost: major wind risk, 68% chance of damaging wind over 30y; extreme-heat days projected 7→16/yr by 2055 (HVAC capex compounding) — expect insurance premiums to compound above CPI over the hold.
Questions for the listing agent
- It's been on market 135 days. Have you received any prior offers? Is the seller open to a 12% concession, seller financing, or rate buy-down credit?
- Built in 1961 — when were the roof, HVAC, electrical panel, plumbing, and water heater last replaced?
- Why hasn't it sold? Are there any deal-killer items the seller is aware of (foundation, flood, title, zoning, code violations)?
- Is there a deadline driving the sale (1031 exchange, divorce, estate, relocation)? That informs how much negotiation room exists.
- Schools are F-rated, which usually means shorter tenancies and higher turnover. Who's the typical renter profile here, and what's been the actual vacancy rate?
- Crime grade is F in this area — have there been break-ins, vandalism, or insurance claims at this property in the last 3 years? What carrier currently insures it and at what premium?
- What's the average days-on-market for RENTAL listings here right now (not sales)? A rising rental-DOM trend means longer vacancies and softer asking-rent achievability than the comps imply.
- What's the recent tenant-quality profile in this submarket — average credit score on applications, eviction rate, late-payment / NSF rate, and stable-employment percentage? A property-management company in the area should have these aggregated.
- How much new for-sale + rental construction is in the pipeline within 1–3 miles? Heavy new supply typically softens prices + rents 12–24 months out; constrained supply supports both.
Investment metrics
- 1% rule
- 1.41% ✓
- Cap rate
- 12.35%
- Cash-on-cash
- 21.64%
- DSCR
- 1.96
- GRM
- 5.9
CMA / ARV
- ARV (on-the-fly)
- $108,900
- Comps found
- 12
Show comp detail 12 sales within ~0.75 mi
| Address | Dist | Beds/Ba | Sqft | Sold | Price | $/sf | Match |
|---|---|---|---|---|---|---|---|
| 1317 Proctor St | 0.29mi | 3/1.5 | 1,107 (+2%) | 11mo | $140,000 | $126 | 73 |
| 1121 Hill St | 0.39mi | 3/1.0 | 1,104 (+1%) | 10mo | $110,000 | $100 | 71 |
| 1104 Johnson St | 0.27mi | 4/1.5 (+1) | 1,076 (-1%) | 9mo | $60,000 | $56 | 71 |
| 1220 Tarboro St | 0.61mi | 3/1.0 | 1,100 (+1%) | 7mo | $150,000 | $136 | 64 |
| 929 Tyan St | 0.33mi | 3/2.0 | 1,187 (+9%) | 10mo | $90,000 | $76 | 57 |
| 727 Long Ave | 0.39mi | 2/1.0 (-1) | 1,177 (+8%) | 10mo | $40,000 | $34 | 56 |
| 540 Lincoln Dr | 0.73mi | 3/2.0 | 1,067 (-2%) | 9mo | $128,000 | $120 | 51 |
| 722 Long Ave | 0.42mi | 3/1.0 | 1,231 (+13%) | 10mo | $48,000 | $39 | 50 |
| 225 Hendricks St | 0.65mi | 2/1.0 (-1) | 1,203 (+10%) | 2mo | $20,000 | $17 | 46 |
| 1312 Hill Street St | 0.54mi | 4/2.0 (+1) | 1,221 (+12%) | 8mo | $159,900 | $131 | 39 |
| 617 Pender St | 0.73mi | 3/1.0 | 1,232 (+13%) | 8mo | $42,000 | $34 | 37 |
| 801 Lincoln Dr | 0.65mi | 3/2.0 | 1,251 (+15%) | 5mo | $170,000 | $136 | 37 |
Match score weights: distance 35% · size 25% · config 20% · recency 20%. Top-matched comps best support the ARV.
Projected returns pro-forma
-3.0% appreciation · 3.0% rent growth · sell at horizon
- IRR
- 14.2%
- Equity multiple
- 1.57×
- Total profit
- $15,925
- Equity at exit
- $14,910
- IRR
- 23.0%
- Equity multiple
- 2.97×
- Total profit
- $55,161
- Equity at exit
- $8,646
Cash invested: $28,000 (down + closing). Projections, not guarantees.
Landlord ↔ Tenant lean methodology
- Overall (STATE)
- 85 Strongly Landlord-Friendly
- State North Carolina
- 85 Strongly Landlord-Friendly · R+3
- County
- — inherits STATE
- City
- — inherits STATE
ZIP-level market 27801
- Home prices YoY
- -5.6%
- Active inventory
- 133
- Price-to-rent
- 5.9×
Monthly cashflow live
- Estimated rent
- $1,412 medium interval (Pro) →
- Mortgage (P&I)
- −$524
- Tax from tax record
- −$44 /mo · $530/yr
- Insurance
- −$42
- HOA
- −$0
- Vacancy / Maint / Mgmt
- −$296
- Net cashflow
- $505
Break-even live
UW: 25.0% down · 7.5% · 30yr · 1.5% tax · 5.0% vac · 8.0% maint · 8.0% mgmt
Financing live
Cash to close
- Down payment
- $25,000
- Closing costs
- $3,000
- Reserves months
- —
- Total cash needed
- —
Loan-product check · same deal, 3 products live
Conventional
25% down · 7.5% · 30yr
- Down + closing
- —
- Monthly P&I
- —
- Monthly cashflow
- —
- DSCR
- —
- Eligible?
- —
Personal DTI + credit; lowest rate.
DSCR
20% down · 8.5% · 30yr
- Down + closing
- —
- Monthly P&I
- —
- Monthly cashflow
- —
- DSCR
- —
- Eligible?
- —
No personal income docs; deal must DSCR.
Hard money
10% down · 12.0% · 12mo
- Down + closing
- —
- Monthly P&I
- —
- Monthly cashflow
- —
- DSCR
- —
- Eligible?
- —
Short-term bridge; refi at stabilization.
Listing history 24 events
-
2026-06-19days on market $100,000 Active 135 DOM
-
2026-06-18days on market $100,000 Active 134 DOM
-
2026-06-17days on market $100,000 Active 133 DOM
-
2026-06-16days on market $100,000 Active 132 DOM
-
2026-06-15days on market $100,000 Active 131 DOM
-
2026-06-14days on market $100,000 Active 129 DOM
-
2026-06-13days on market $100,000 Active 128 DOM
-
2026-06-10days on market $100,000 Active 126 DOM
-
2026-06-09days on market $100,000 Active 125 DOM
-
2026-06-08days on market $100,000 Active 124 DOM
-
2026-06-07days on market $100,000 Active 123 DOM
-
2026-06-03days on market $100,000 Active 119 DOM
-
2026-06-02days on market $100,000 Active 118 DOM
-
2026-06-01days on market $100,000 Active 117 DOM
-
2026-05-31days on market $100,000 Active 116 DOM
-
2026-05-30days on market $100,000 Active 115 DOM
-
2026-02-04$100,000 Active
-
2025-12-31historical
-
2025-07-19$105,000 Active
-
2017-08-14soldstatus $23,000 85-char remark
Show marketing remark (85 chars)
Nice and neat 3BR 1BA move in ready home. Excellent for first time buyer or investor.
-
2017-03-18$25,000 85-char remark
Show marketing remark (85 chars)
Nice and neat 3BR 1BA move in ready home. Excellent for first time buyer or investor.
-
2015-01-07historical
-
2014-07-16$25,000
-
1989-10-31soldstatus $38,000
ⓘ Source: listings_history table (triggers on properties + properties_extension) + one-shot
backfill from property_details.listing_events for pre-trigger history.
Tax reassessment forecast NC · Resets to sale price
- Current annual tax
- $530 · $44/mo
- Projected year-2 tax
- $820 · $68/mo
- Expected delta
- +$290/yr (+$24/mo · 54.8%)
ⓘ Screening estimate from a state-policy table — verify with the county assessor before closing.
Climate risk First Street
- Flood 1/10 Low FEMA zone X (unshaded) · 0% chance over 30 yrs
- Wildfire 3/10 Moderate
- Heat 7/10 Severe 7 d/yr ≥107°F today · 16 d/yr by 30 yrs out
- Wind 6/10 Major 68% chance of damaging wind over 30 yrs
- Air quality 2/10 Low 1 unhealthy d/yr today · 2 by 30 yrs out
Nearby sold comps map
Loading sold comps map…
Walkable amenities ~0.75 mi
Loading nearby amenities…
Taxation est. · year 1
- Rental income
- $16,939
- − Mortgage interest
- −$5,602
- − Property taxes
- −$530
- − Insurance
- −$500
- − Repairs & maintenance
- −$1,355
- − Management
- −$1,355
- − Depreciation
- −$2,909
- Taxable income
- $4,688
- Est. tax owed @ 24.0%
- −$1,125
- After-tax cash flow
- $4,934/yr
For passive investors: Depreciation is non-cash, so a rental often shows a tax loss while cash-flowing — sheltering income. Rental losses are passive: they offset passive income freely, and up to $25,000/yr can offset ordinary (W-2) income if you actively participate and your MAGI is under $100k (phasing out to $0 by $150k); unused losses carry forward. On sale, claimed depreciation is recaptured at up to 25%, and gains may owe capital-gains tax (a 1031 exchange can defer both). Figures are a year-1 estimate at your 24.0% rate — not tax advice; consult a CPA.
Schools (NCES district)
- District
- Edgecombe County Public Schools
- NCES district ID
- 3701320
- Math proficiency
- 21% ▼ -2.00%
- Reading proficiency
- 27% ▲ 2.00%
- Median HH income
- $35,711
- Composite
- 19.85/100
- National rank
- #8696
- State rank
- #163 of 178 in NC
Livability — Rocky Mount
- Score
- 70/100
- State rank
- #134
- US rank
- #7692
Category grades
Schools grade is shown separately in the Schools card above.
Census & demographics
- Census place
- Rocky Mount, NC
- County
- Edgecombe County · 37,913 people
- City population
- 70,300
- Metro
- Rocky Mount, NC
- Population (ZIP)
- 19,532
- Household income
- $44,884
- Rent vs Own
- Severe rent burden
- 900.0
Population outlook (Edgecombe County) Hauer SSP2
- Today (2025)
- 47,800 people
- By 2030
- 44,396 · -7.1%
- By 2040
- 37,562 · -21.4%
- By 2050
- 31,495 · -34.1%
- By 2075
- 20,943 · -56.2%
- By 2100
- 13,674 · -71.4%
Race, ethnicity, and origin ACS 2023
- Neighborhood character
- Predominantly Black (70%)
- Race & ethnicity
- Black 70% White 24% Two or more races 3% Hispanic / Latino 1%
- Common ancestry
- Romanian 1%
- Foreign-born
- 1% · Canada
- Languages at home
- 97% English-only · Spanish 2%
Political lean MEDSL · Edgecombe
- 2024 margin
- Strong D (+22.7) · D 61.0% · R 38.3%
- 2008→2024 swing
- -11.8pp toward R · 2008: 34.5pp · 2024: 22.7pp
- All cycles
- 2024: D+22.7 2020: D+27.0 2016: D+32.2 2012: D+36.4 2008: D+34.5
Not yet ingested
- Civics
- —
Market trends
- HPI YoY
- ▼ -17.65%
- Current HPI
- 296.3428
- Rent YoY
- —
- Metro
- Rocky Mount, NC
- State GDP YoY
- ▲ 3.28%
- F500 in state
- 26
Industry mix (Fortune 500 HQ in NC)
| Industry | F500 HQs | Revenue |
|---|---|---|
| Financial Services | 2 | $213B |
|
||
| Retail | 2 | $95B |
|
||
| Industrial Conglomerate | 1 | $38B |
|
||
| Metals / Steel | 1 | $35B |
|
||
| Utilities | 1 | $30B |
|
||
| Industrial Machinery | 1 | $19B |
|
||
Price history
+163.2% since first listed8 events — show timeline
- 2026-02-04 Listed $100,000 Hive MLS
- 2025-12-31 Listing Removed — Hive MLS
- 2025-07-19 Listed $105,000 Hive MLS
- 2017-08-14 Sold (MLS) $23,000 Hive MLS
- 2017-03-18 Listed $25,000 Hive MLS
- 2015-01-07 Listing Removed — Hive MLS
- 2014-07-16 Listed $25,000 Hive MLS
- 1989-10-31 Sold (Public Records) $38,000 Public Records
Property tax history
+0.9%/yrLatest (2025): $530 · +0.0% YoY. Source: county tax records.
Cash-flow waterfall
monthlySold comps — $/sqft
last 12 mo · ≤1 miLoading sold comps…