2285 Peachtree Rd #602 · Atlanta, GA
Flood risk 1/10 · Minimal
- FEMA flood zone
- X (unshaded)
- Chance of flooding over 30 yrs
- 0.0%
- Est. flood insurance / yr
- $507 – $1,088
Fire risk 1/10 · Minimal
- Est. fire insurance / yr
- $963 – $1,789
Heat risk 6/10 · Moderate
- Hot days now (above 104°F)
- 7 days/yr
- Hot days in 30 yrs
- 18 days/yr
Wind risk 4/10 · Minor
- Chance of severe wind over 30 yrs
- 24.0%
Air-quality risk 4/10 · Minor
- Unhealthy air days now
- 5 days/yr
- Unhealthy air days in 30 yrs
- 7 days/yr
Risk factors via First Street. Map © Google.
Why this score? — see what drove the D- grade
The composite is a weighted blend of 9 inputs, each scored 0–100. Each bar is that input's sub-score; the figure is the points it added to the 100-point composite (weight × sub-score).
- ARV discount +13.7/15.0
- 1% rule +5.0/10.0
- Cash flow +4.5/30.0
- Livability +4.2/5.0
- Rent growth +3.3/5.0
- Schools +2.7/10.0
- Condition / age +2.5/5.0
- DSCR +0.0/10.0
- Appreciation +0.0/10.0
$149,500
🖨 Deal sheet 📄 Offer letter ✓ Due diligence
Listing remarks
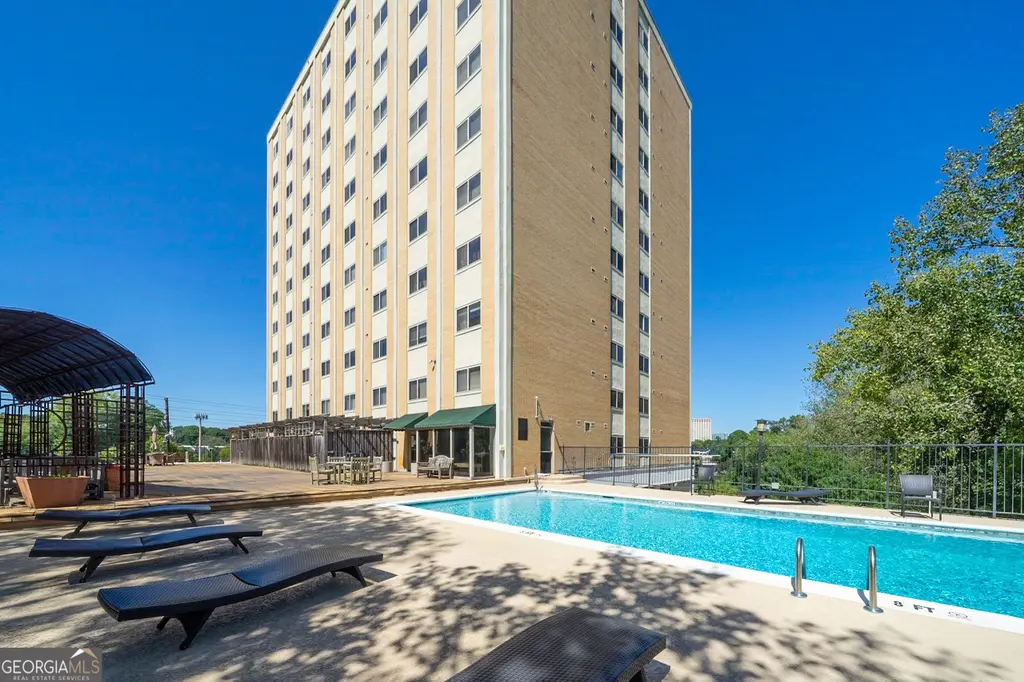
.Unbeatable Value and Location! This charming 1-bedroom, 1-bath condo is situated in the absolute heart of Buckhead, offering supreme walkability to premier shopping and dining. The unit features an updated kitchen with white cabinets, stainless steel appliances, and granite countertops, plus new flooring throughout, a walk-in closet, and covered, gated parking. The truly all-inclusive HOA is the key benefit, covering electricity, gas, water, sewer, trash, high-speed internet, cable TV, termite, pest control, and common area maintenance, minimizing your operating costs. Amenities include a great rooftop swimming pool and cookout area, and with NO RENTAL CAP and rentals allowed for 6 months
Key facts
- White cabinets
- Walk-in closet
- New flooring
Tags
Property features AI
Finance
- HOA & community: HOA/association membership required; Association covers facilities fee, heating/cooling, structure and grounds maintenance, management fee, pest control, sewer, swimming (pool), trash and water
Exterior
- Parking: Assigned parking
- Utilities: Public water; Public sewer; Electricity available; High-speed internet available; Cable available
- Home design: Attached condominium in a high-rise; Resale unit; Three or more levels
- Construction: Built in 1965; Brick and other exterior materials; Composition and other roofing
- Exterior features: Community pool; Community clubhouse; Fitness center; Near shopping
Interior
- Kitchen: Convection oven; Dishwasher; Microwave; Refrigerator; Stainless steel appliances
- Bedrooms: One bedroom on the main level
- Flooring: Laminate; Tile; Vinyl; Other
- Bathrooms: One full bathroom on the main level
- Heating & cooling: Central heating (electric); Central air (electric); Ceiling fan(s)
- Interior features: Open family/living area; No basement
- Laundry & utility: Laundry closet
Neighborhood map
What this means for you Summary
Snapshot
- This is a 1-bed/1.0-bath condo listed at $150k.
Deal economics
- At list price, monthly cash flow is $-383 ($-5k/yr) — negative.
- The deal already cash-flows at list — no discount required.
- To meet the 1% rule (rent ≥ 1% of price), the offer needs to be $149k (0.4% below list).
- Recommended offer: $145k (3.0% below list) — sets the bar for market timing.
Location & tenants
- Location reads 83/100 on livability (#6 in GA, #919 nationally) — a professional / high-income tenant draw. Strengths: amenities A+, commute A+, housing A+; Watch: cost of living C-.
- Atlanta Public Schools (urban): math 28% / reading 35% proficiency, ranked #80 of 174 in GA (top 46%) — families likely to look elsewhere, expect single-tenant / working-renter base with shorter leases; 71% free/reduced lunch — lower-income household profile, screen leases tightly.
- Zoned schools: E. Rivers Elementary School (math 33% / reading 52%, grade F, #374 of 1,228 statewide, top 31%, 708 students, 32% FRL); Willis A. Sutton Middle School (math 36% / reading 55%, grade D+, #97 of 470 statewide, top 22%, 1,548 students, 34% FRL); North Atlanta High School (math 27% / reading 17%, grade F, #213 of 424 statewide, top 51%, 2,316 students, 24% FRL) — zoned schools average 30% FRL vs 71% district-wide (41 pts lower); this property's tenant base skews higher-income than the district average.
- Market conditions: Rents rising (+3.1%/yr); 408 active listings in the ZIP; 40 comparable units currently listed for rent nearby; rentals leasing fast (median 3d on market — plan ~1-2 weeks tenant-placement turnaround); high-income renter base; 11,565 units permitted in Fulton County in 2024 (8,159 in 5+ unit buildings).
- This rent is only 16% of the median local income ($114k/yr) — well below the 30% rent-burden line; pricing power to push rent on renewal without tenant pushback.
Forward outlook
- Local home prices are declining (-3.0%/yr); year-one equity from $1k of loan paydown is wiped out by about $4k of value loss. Plan a longer hold.
- Fulton County population projected at +38% by 2050 — long-run rental-demand tailwind backs the buy-and-hold thesis.
Negotiation context
- It's been on market 40 days — a 3% lower offer ($145k) is reasonable based on typical stale-listing flexibility.
- 10 sale attempts since 17y ago; this cycle's ask has dropped $20k (12%) from the opening price — seller is motivated, your offer sets the floor, not the list.
- Current owner paid $122k; 22% above their basis — modest negotiation headroom, anchor on the comps not their cost.
Risks & watch-outs
- Watch-outs: HOA is 38% of rent.
- Climate carrying-cost: extreme-heat days projected 7→18/yr by 2055 (HVAC capex compounding) — expect insurance premiums to compound above CPI over the hold.
Questions for the listing agent
- What do current leases actually rent for vs. the listed asking? Can we see a recent rent roll and the last 12 months of T-12 income?
- It's been on market 40 days. Have you received any prior offers? Is the seller open to a 3% concession, seller financing, or rate buy-down credit?
- Built in 1965 — when were the roof, HVAC, electrical panel, plumbing, and water heater last replaced?
- What does the HOA fee cover, when was the last increase, and are there any pending special assessments or reserve-fund shortfalls?
- Any open or pending special assessments — roof, HVAC, plumbing, elevator, façade? What's the per-unit balance and payoff schedule, and is the seller paying it off at close or rolling it to the buyer?
- Is there a deadline driving the sale (1031 exchange, divorce, estate, relocation)? That informs how much negotiation room exists.
- The area grade is low — what's the realistic commute time and amenity access for the typical tenant pool here? Any planned neighborhood developments (good or bad) we should know about?
- What's the average days-on-market for RENTAL listings here right now (not sales)? A rising rental-DOM trend means longer vacancies and softer asking-rent achievability than the comps imply.
- What's the recent tenant-quality profile in this submarket — average credit score on applications, eviction rate, late-payment / NSF rate, and stable-employment percentage? A property-management company in the area should have these aggregated.
- How much new apartment / multifamily construction is in the pipeline within 1–3 miles? Heavy new supply (>2% of stock underway) typically softens rents 12–24 months out; light construction supports rent growth.
Investment metrics
- 1% rule
- 1.00% ✗
- Cap rate
- 3.22%
- Cash-on-cash
- -10.98%
- DSCR
- 0.51
- GRM
- 8.4
CMA / ARV
- ARV (median comp)
- $173,371
- List price
- $149,500
- Delta
- -13.77%
- Verdict
- UNDERPRICED
- Comps
- 20 within 1.0 mi
Projected returns pro-forma
-3.0% appreciation · 3.09% rent growth · sell at horizon
- IRR
- -35.7%
- Equity multiple
- -0.15×
- Total profit
- $-48,134
- Equity at exit
- $22,291
- IRR
- -44.7%
- Equity multiple
- -0.70×
- Total profit
- $-71,361
- Equity at exit
- $12,926
Cash invested: $41,860 (down + closing). Projections, not guarantees.
Landlord ↔ Tenant lean methodology
- Overall (STATE)
- 90 Strongly Landlord-Friendly
- State Georgia
- 90 Strongly Landlord-Friendly · R+3
- County
- — inherits STATE
- City
- — inherits STATE
ZIP-level market 30309
- Rents YoY
- 3.1%
- Active inventory
- 408
- Price-to-rent
- 8.4×
Monthly cashflow live
- Estimated rent
- $1,488 high interval (Pro) →
- Mortgage (P&I)
- −$784
- Tax from tax record
- −$152 /mo · $1,829/yr
- Insurance
- −$62
- HOA est. from 6 same-building comps
- −$560
- Vacancy / Maint / Mgmt
- −$313
- Net cashflow
- $-383
Break-even live
UW: 25.0% down · 7.5% · 30yr · 1.5% tax · 5.0% vac · 8.0% maint · 8.0% mgmt
Financing live
Cash to close
- Down payment
- $37,375
- Closing costs
- $4,485
- Reserves months
- —
- Total cash needed
- —
Loan-product check · same deal, 3 products live
Conventional
25% down · 7.5% · 30yr
- Down + closing
- —
- Monthly P&I
- —
- Monthly cashflow
- —
- DSCR
- —
- Eligible?
- —
Personal DTI + credit; lowest rate.
DSCR
20% down · 8.5% · 30yr
- Down + closing
- —
- Monthly P&I
- —
- Monthly cashflow
- —
- DSCR
- —
- Eligible?
- —
No personal income docs; deal must DSCR.
Hard money
10% down · 12.0% · 12mo
- Down + closing
- —
- Monthly P&I
- —
- Monthly cashflow
- —
- DSCR
- —
- Eligible?
- —
Short-term bridge; refi at stabilization.
Rent comps 40 comps
| Address | Beds | Baths | Sqft | Rent | $/sqft | DOM | Units | Dist |
|---|---|---|---|---|---|---|---|---|
| 2285 Peachtree Rd NE Atlanta, GA | 1.0 | 1.0 | 667 | $1,664 | $2.49 | 2d | 2 | 0.05mi |
| 11 Peachtree Hills Ave NE Unit B5 Atlanta, GA | 1.0 | 1.0 | 600 | $1,000 | $1.67 | 24d | 1 | 0.12mi |
| 2420 Peachtree Rd NW Atlanta, GA | 1.0–2.0 | 1.0–2.0 | 957 | $1,949 | $2.04 | 20d | 5 | 0.27mi |
| 2111 Fairhaven Cir NE Unit UPSTAIRS Atlanta, GA | 1.0 | 1.0 | 550 | $1,150 | $2.09 | 15d | 1 | 0.28mi |
| 2111 Fairhaven Cir NE Unit UPSTAI Atlanta, GA | 1.0 | 1.0 | 550 | $1,050 | $1.91 | 12d | 1 | 0.28mi |
| 100 Colonial Homes Dr NW Atlanta, GA | 1.0–3.0 | 1.0–2.0 | 1188 | $1,550 | $1.30 | 1d | 28 | 0.31mi |
| 40 Peachtree Valley Rd NE Atlanta, GA | 3.0 | 1.0–2.0 | 1103 | $1,653 | $1.50 | 1d | 47 | 0.40mi |
| 100 Terrace Dr NE Unit 12 Atlanta, GA | 2.0 | 1.0 | 700 | $1,325 | $1.89 | 24d | 1 | 0.41mi |
| 100 Terrace Dr NE Unit 1 Atlanta, GA | 1.0 | 1.0 | 600 | $1,195 | $1.99 | 24d | 1 | 0.41mi |
| 222 Colonial Homes Dr NW Atlanta, GA | 1.0–3.0 | 1.0–2.0 | 968 | $1,909 | $1.97 | 1d | 14 | 0.44mi |
| 2035 Peachtree Rd NE Atlanta, GA | 1.0–2.0 | 1.0–2.0 | 771 | $1,196 | $1.55 | 1d | 18 | 0.48mi |
| 2025 Peachtree Rd NE Atlanta, GA | 1.0 | 1.0 | 600 | $1,395 | $2.33 | 5d | 142 | 0.49mi |
| 2025 Peachtree Rd Unit 1-0113 Rachel Mitigations Regional Atlanta, GA | 1.0 | 1.0 | 450 | $1,195 | $2.66 | 3d | 1 | 0.51mi |
| 350 Peachtree Hills Ave NE Atlanta, GA | 1.0–2.0 | 1.0–2.0 | 950 | $1,325 | $1.39 | 1d | 28 | 0.89mi |
| 480 Peachtree Hills Ave NE Atlanta, GA | 1.0 | 1.0 | 600 | $1,186 | $1.98 | 2d | 2 | 0.94mi |
| 1777 Peachtree St NE Atlanta, GA | 2.0 | 1.0–2.0 | 886 | $2,614 | $2.95 | 7d | 6 | 0.94mi |
| 112 Ardmore Pl NW Unit 12 Atlanta, GA | 1.0 | 1.0 | 575 | $999 | $1.74 | 18d | 1 | 0.96mi |
| 112 Ardmore Pl NW Atlanta, GA | 1.0 | 1.0 | 750 | $1,199 | $1.60 | 16d | 1 | 0.96mi |
| 112 Ardmore Pl NW Unit 3 Atlanta, GA | 1.0 | 1.0 | 750 | $1,199 | $1.60 | 18d | 1 | 0.96mi |
| 147 26th St NW Atlanta, GA | 2.0 | 1.0–2.0 | 956 | $1,639 | $1.71 | 1d | 24 | 1.05mi |
| 1925 Monroe Dr NE Atlanta, GA | 1.0–3.0 | 1.0–2.0 | 1101 | $1,464 | $1.33 | 1d | 47 | 1.07mi |
| 6 Vivian Ln NE Unit 23 Atlanta, GA | 1.0 | 1.0 | 650 | $1,245 | $1.92 | 21d | 1 | 1.10mi |
| 485 Lindbergh Pl NE Atlanta, GA | 2.0 | 1.0–2.0 | 918 | $1,632 | $1.78 | 1d | 33 | 1.11mi |
| 2450 Camellia Ln NE Atlanta, GA | 1.0–2.0 | 1.0–2.0 | 911 | $1,359 | $1.49 | 2d | 20 | 1.11mi |
| 45 Sheridan Dr NE Unit 13 Atlanta, GA | — | 1.0 | 510 | $1,100 | $2.16 | 24d | 1 | 1.12mi |
| 65 Sheridan Dr NE Atlanta, GA | 1.0 | 1.0 | 520 | $1,065 | $2.05 | 16d | 1 | 1.13mi |
| 225 26th St NW Atlanta, GA | 3.0 | 1.0–2.0 | 1197 | $1,889 | $1.58 | 1d | 13 | 1.19mi |
| 21 Delmont Dr NE Apt 3 Atlanta, GA | 1.0 | 1.0 | 556 | $1,400 | $2.52 | 16d | 1 | 1.19mi |
| 508 Main St NE Atlanta, GA | 2.0 | 1.0–2.0 | 829 | $1,840 | $2.22 | 1d | 26 | 1.19mi |
| 21 Delmont Dr NE Unit 1 Atlanta, GA | 1.0 | 1.0 | 600 | $1,300 | $2.17 | 24d | 1 | 1.20mi |
| 2000 Monroe Pl NE Atlanta, GA | — | 1.0 | 584 | $1,329 | $2.28 | 3d | 1 | 1.24mi |
| The Peach Atlanta, GA | 1.0–3.0 | 1.0–3.5 | 1175 | $1,335 | $1.14 | 3d | 38 | 1.24mi |
| 1950 Piedmont Cir NE Atlanta, GA | 2.0 | 1.0–2.0 | 888 | $2,096 | $2.36 | 1d | 48 | 1.33mi |
| 2323 Piedmont Rd NE Atlanta, GA | 1.0–2.0 | 1.0–2.0 | 984 | $1,646 | $1.67 | 1d | 30 | 1.38mi |
| 32 Peachtree Ave NE Unit 3 Atlanta, GA | 1.0 | 1.0 | 650 | $1,300 | $2.00 | 1d | 1 | 1.40mi |
| 32 Peachtree Ave NE Unit 1 Atlanta, GA | 1.0 | 1.0 | 650 | $1,300 | $2.00 | 24d | 1 | 1.40mi |
| 2400 Parkland Dr NE Atlanta, GA | 1.0–3.0 | 1.0–2.0 | 1027 | $1,453 | $1.41 | 1d | 19 | 1.41mi |
| 1760 Northside Dr NW Atlanta, GA | 1.0–2.0 | 1.0–2.0 | 701 | $1,249 | $1.78 | 2d | 7 | 1.43mi |
| 2591 Piedmont Rd NE Atlanta, GA | 1.0–2.0 | 1.0–2.0 | 1019 | $1,398 | $1.37 | 1d | 20 | 1.43mi |
| 658 Lindbergh Dr NE Atlanta, GA | 1.0–2.0 | 1.0–2.0 | 1022 | $1,756 | $1.72 | 3d | 22 | 1.44mi |
HOA detail condo
- Monthly dues
- $0 · $0/yr
- Likely covers
- watersewertrashgaselectricinternetcablepoolsecurity
- Assessments
- None detected in remarks — confirm with the listing agent.
Listing history 44 events
-
2026-06-18days on market $149,500 Active 40 DOM
-
2026-06-17days on market $149,500 Active 39 DOM
-
2026-06-16days on market $149,500 Active 38 DOM
-
2026-06-15days on market $149,500 Active 37 DOM
-
2026-06-13days on market $149,500 Active 35 DOM
-
2026-06-13days on market $149,500 Active 34 DOM
-
2026-06-09days on market $149,500 Active 31 DOM
-
2026-06-08days on market $149,500 Active 30 DOM
-
2026-06-07days on market $149,500 Active 29 DOM
-
2026-06-04days on market $149,500 Active 26 DOM
-
2026-06-03days on market $149,500 Active 25 DOM
-
2026-06-02days on market $149,500 Active 24 DOM
-
2026-06-01days on market $149,500 Active 23 DOM
-
2026-05-31days on market $149,500 Active 22 DOM
-
2026-05-09price $149,500 805-char remark
-
2026-05-09historical
-
2026-04-01status Back On Market
-
2026-03-31historical
-
2025-10-03price $159,500
-
2025-09-29price $162,000
-
2025-09-02$159,900 New 805-char remark
-
2025-09-02$170,000 New
-
2025-07-01historical
-
2025-06-03price $169,999
-
2025-02-26$174,500 New
-
2025-02-23historical
-
2025-02-15price $174,500
-
2024-10-26$178,500 New
-
2023-04-07soldstatus $122,500
-
2023-04-06soldstatus $122,500 Sold
-
2023-04-06soldstatus $122,500 Closed
-
2023-04-01status Pending
-
2023-03-27status Under Contract
-
2023-03-27historical Active Under Contract
-
2023-03-18status Active
-
2023-03-18status Back On Market
-
2023-03-14status Under Contract
-
2023-03-13historical Active Under Contract
-
2023-03-07$130,000 New
-
2023-03-07$130,000 Active
-
2009-10-21soldstatus $61,900
-
2009-10-19soldstatus $61,850
-
2009-07-18$61,850
-
1982-06-11soldstatus $41,500
ⓘ Source: listings_history table (triggers on properties + properties_extension) + one-shot
backfill from property_details.listing_events for pre-trigger history.
Tax reassessment forecast GA · Resets to sale price
- Current annual tax
- $1,829 · $152/mo
- Projected year-2 tax
- $1,829 · $152/mo
- Expected delta
- $0/yr ($0/mo · 0.0%)
ⓘ Screening estimate from a state-policy table — verify with the county assessor before closing.
Climate risk First Street
- Flood 1/10 Low FEMA zone X (unshaded) · 0% chance over 30 yrs
- Wildfire 1/10 Low
- Heat 6/10 Major 7 d/yr ≥104°F today · 18 d/yr by 30 yrs out
- Wind 4/10 Moderate 24% chance of damaging wind over 30 yrs
- Air quality 4/10 Moderate 5 unhealthy d/yr today · 7 by 30 yrs out
Nearby sold comps map
Loading sold comps map…
Walkable amenities ~0.75 mi
Loading nearby amenities…
Taxation est. · year 1
- Rental income
- $17,860
- − Mortgage interest
- −$8,374
- − Property taxes
- −$1,829
- − Insurance
- −$748
- − Repairs & maintenance
- −$1,429
- − Management
- −$1,429
- − HOA
- −$6,720
- − Depreciation
- −$4,349
- Taxable loss
- −$7,018
- Est. tax savings @ 24.0%
- +$1,684
- After-tax cash flow
- $-2,911/yr
For passive investors: Depreciation is non-cash, so a rental often shows a tax loss while cash-flowing — sheltering income. Rental losses are passive: they offset passive income freely, and up to $25,000/yr can offset ordinary (W-2) income if you actively participate and your MAGI is under $100k (phasing out to $0 by $150k); unused losses carry forward. On sale, claimed depreciation is recaptured at up to 25%, and gains may owe capital-gains tax (a 1031 exchange can defer both). Figures are a year-1 estimate at your 24.0% rate — not tax advice; consult a CPA.
Schools (NCES district)
- District
- Atlanta Public Schools
- NCES district ID
- 1300120
- Math proficiency
- 28% ▼ -6.00%
- Reading proficiency
- 35% ▼ -2.00%
- Median HH income
- $48,306
- Composite
- 27.27/100
- National rank
- #7006
- State rank
- #80 of 174 in GA
Livability — Atlanta
- Score
- 83/100
- State rank
- #6
- US rank
- #919
Category grades
Schools grade is shown separately in the Schools card above.
Census & demographics
- Census place
- Atlanta, GA
- County
- Fulton County · 1,094,430 people
- City population
- 629,525
- Metro
- Atlanta-Sandy Springs-Alpharetta, GA
- Population (ZIP)
- 32,479
- Household income
- $114,072
- Rent vs Own
- Severe rent burden
- 2135.0
Population outlook (Fulton County) Hauer SSP2
- Today (2025)
- 1,203,707 people
- By 2030
- 1,299,706 · +8.0%
- By 2040
- 1,488,256 · +23.6%
- By 2050
- 1,664,580 · +38.3%
- By 2075
- 2,036,072 · +69.2%
- By 2100
- 2,222,402 · +84.6%
Race, ethnicity, and origin ACS 2023
- Neighborhood character
- Diverse neighborhood (Simpson 0.57)
- Race & ethnicity
- White 62% Black 14% Asian 9% Hispanic / Latino 8% Two or more races 8%
- Hispanic origin (detail)
- Mexican 2% Puerto Rican 2%
- Common ancestry
- Slovak 3% Romanian 2% Lithuanian 2%
- Foreign-born
- 15% · Canada, China, South Korea
- Languages at home
- 83% English-only · Spanish 5% Other Indo-European 4% Chinese 3%
Political lean MEDSL · Fulton
- 2024 margin
- Solid D (+44.9) · D 71.9% · R 27.0% · Other 1.1%
- 2008→2024 swing
- +9.8pp toward D · 2008: 35.0pp · 2024: 44.9pp
- All cycles
- 2024: D+44.9 2020: D+46.4 2016: D+42.1 2012: D+29.6 2008: D+35.0
Not yet ingested
- Civics
- —
Market trends
- HPI YoY
- ▼ -561.75%
- Current HPI
- 156.3796
- Rent YoY
- ▲ 3.09%
- Metro
- Atlanta-Sandy Springs-Alpharetta, GA
- State GDP YoY
- ▲ 2.66%
- F500 in state
- 28
Industry mix (Fortune 500 HQ in GA)
| Industry | F500 HQs | Revenue |
|---|---|---|
| Paper / Packaging | 2 | $29B |
|
||
| Retail | 1 | $160B |
|
||
| Transportation / Logistics | 1 | $91B |
|
||
| Airlines | 1 | $62B |
|
||
| Consumer Goods | 1 | $47B |
|
||
| Utilities | 1 | $25B |
|
||
Price history
+260.2% since first listed30 events — show timeline
- 2026-05-09 Price Changed $149,500 GAMLS
- 2026-05-09 Listing Removed — GAMLS
- 2026-04-01 Relisted — GAMLS
- 2026-03-31 Listing Removed — GAMLS
- 2025-10-03 Price Changed $159,500 GAMLS
- 2025-09-29 Price Changed $162,000 GAMLS
- 2025-09-02 Listed $170,000 GAMLS
- 2025-09-02 Listed $159,900 GAMLS
- 2025-07-01 Listing Removed — GAMLS
- 2025-06-03 Price Changed $169,999 GAMLS
- 2025-02-26 Listed $174,500 GAMLS
- 2025-02-23 Listing Removed — GAMLS
- 2025-02-15 Price Changed $174,500 GAMLS
- 2024-10-26 Listed $178,500 GAMLS
- 2023-04-07 Sold (Public Records) $122,500 Public Records
- 2023-04-06 Sold (MLS) $122,500 FMLS
- 2023-04-06 Sold (MLS) $122,500 GAMLS
- 2023-04-01 Pending — FMLS
- 2023-03-27 Pending — GAMLS
- 2023-03-27 Contingent — FMLS
- 2023-03-18 Relisted — FMLS
- 2023-03-18 Relisted — GAMLS
- 2023-03-14 Pending — GAMLS
- 2023-03-13 Contingent — FMLS
- 2023-03-07 Listed $130,000 FMLS
- 2023-03-07 Listed $130,000 GAMLS
- 2009-10-21 Sold (Public Records) $61,900 Public Records
- 2009-10-19 Sold (MLS) $61,850 FMLS
- 2009-07-18 Listed $61,850 FMLS
- 1982-06-11 Sold (Public Records) $41,500 Public Records
Property tax history
+0.7%/yrLatest (2025): $1,829 · -7.4% YoY. Source: county tax records.
Cash-flow waterfall
monthlySold comps — $/sqft
last 12 mo · ≤1 miLoading sold comps…