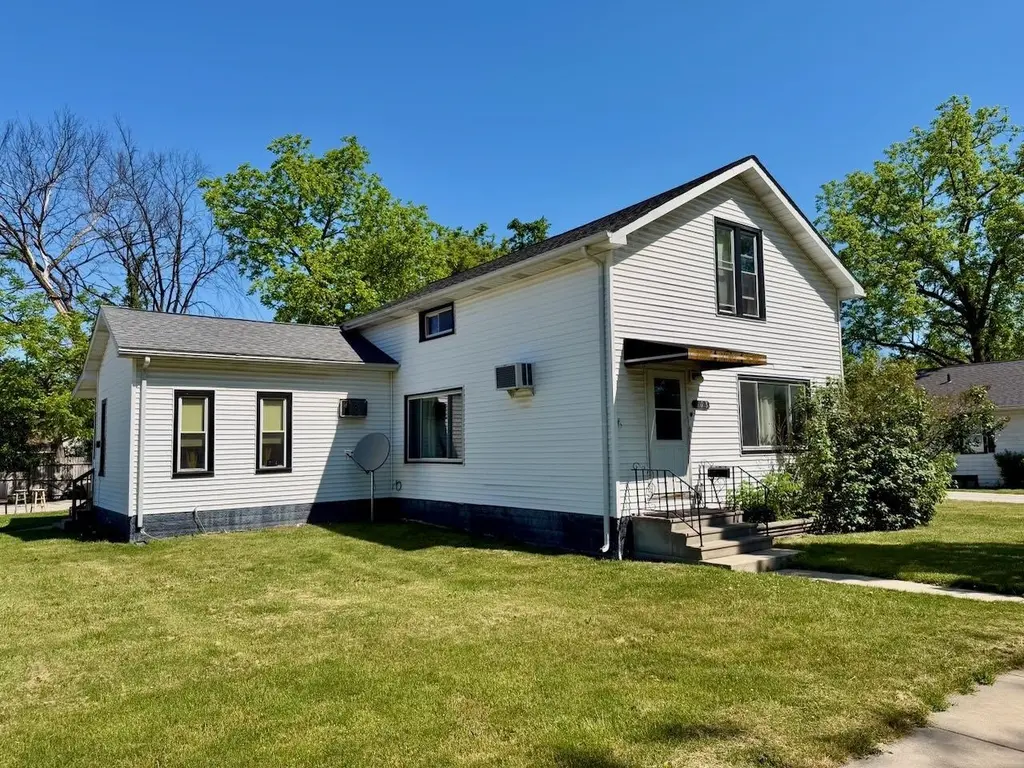
1404 Monroe St · Saginaw, MI
Flood risk 1/10 · Minimal
- FEMA flood zone
- X (unshaded)
- Chance of flooding over 30 yrs
- 0.0%
- Est. flood insurance / yr
- $473 – $860
Fire risk 1/10 · Minimal
- Est. fire insurance / yr
- $784 – $1,456
Heat risk 2/10 · Minimal
- Hot days now (above 100°F)
- 7 days/yr
- Hot days in 30 yrs
- 14 days/yr
Wind risk 1/10 · Minimal
- Chance of severe wind over 30 yrs
- —
Air-quality risk 2/10 · Minimal
- Unhealthy air days now
- 1 days/yr
- Unhealthy air days in 30 yrs
- 2 days/yr
Risk factors via First Street. Map © Google.
Why this score? — see what drove the B- grade
The composite is a weighted blend of 9 inputs, each scored 0–100. Each bar is that input's sub-score; the figure is the points it added to the 100-point composite (weight × sub-score).
- Cash flow +30.0/30.0
- DSCR +10.0/10.0
- 1% rule +8.7/10.0
- ARV discount +6.0/15.0
- Rent growth +3.5/5.0
- Livability +3.2/5.0
- Condition / age +2.5/5.0
- Schools +2.0/10.0
- Appreciation +0.0/10.0
$89,900
🖨 Deal sheet 📄 Offer letter ✓ Due diligence
Listing remarks MLS
Turnkey investment opportunity with reliable, long-term tenants already in place. This duplex offers over 1,700 square feet of living space with 4 total bedrooms and 3 total bathrooms, generating $1,550 per month in rental income. Both tenants have occupied their units for more than five years and are currently on month-to-month leases, providing flexibility for future ownership plans. The property features a basement with laundry hookups, a detached one-car garage, and several recent improvements, including approximately half of the plumbing being updated within the last three years. Tenants pay for their own heat, electricity, and snow removal, helping reduce operating expenses, while the landlord covers water and lawn maintenance. Whether you're looking to expand your portfolio or purchase your first income-producing property, this well-maintained duplex offers steady cash flow and strong rental history in an established neighborhood.
Key facts
- Recent improvements
- 6,534 sq ft lot
- Garage
Tags
Property features AI
Finance
- Other: Lot dimensions approximately 108 x 60 (0.15 acres)
- Financial info: Unit rents reported: one unit at $900, another at $600
Exterior
- Parking: Assigned parking; One garage space
- Utilities: Public water; Public sewer
- Home design: Two levels; Residential income / multifamily property
- Construction: Vinyl siding; Block foundation; Block basement
- Exterior features: Paved road access; Second garage on the property; Residential zoning
Interior
- Kitchen: Oven; Range; Refrigerator; Gas water heater
- Bathrooms: Three full bathrooms
- Heating & cooling: Forced air heating (natural gas); Separate meters for heating; Ceiling fans; Window air conditioning units
- Interior features: High speed internet; Has basement with block foundation
Neighborhood map
What this means for you Summary
Snapshot
- This is a 4-bed/2.0-bath single-family listed at $90k.
Deal economics
- At list price, monthly cash flow is $343 ($4k/yr) — positive.
- The deal already cash-flows at list — no discount required.
- Meets the 1% rule at list price ($1k rent vs $90k).
- Recommended offer: $89k (1.5% below list) — sets the bar for market timing.
- Cap rate 10.9% vs local median 8.3% in Saginaw — top-decile yield for the area; either an underpriced asset or a hidden risk that comps aren't pricing in. Stress-test before assuming the spread holds.
Location & tenants
- Location reads 63/100 on livability (#521 in MI) — a middle-class / working-renter tenant base. Strengths: cost of living A+, housing A+, health & safety A+; Watch: schools F, crime F, amenities F.
- Saginaw School District (urban): math 20% / reading 29% proficiency, ranked #444 of 540 in MI (top 82%) — low school quality limits family demand, transient renter base, plan for 1-2y turnover; 76% free/reduced lunch — lower-income household profile, screen leases tightly.
- Market conditions: Rents rising (+4.0%/yr); 250 active listings in the ZIP; 154 units permitted in Saginaw County in 2024 (0 in 5+ unit buildings).
- This rent runs 31% of the median local income ($47k/yr) — at the standard rent-burdened threshold; future hikes will face affordability resistance.
Forward outlook
- Local home prices are declining (-3.0%/yr); year-one equity from $622 of loan paydown is wiped out by about $3k of value loss. Plan a longer hold.
- Saginaw County population projected at -25% by 2050 — secular population decline; favor cash flow + early exit over multi-decade hold.
- At projected returns (-3.0% appreciation + 4.0% rent growth), your $25k cash investment doubles in ~7 years — after that, you're playing with house money.
Negotiation context
- It's been on market 16 days — a 2% lower offer ($89k) is reasonable based on typical stale-listing flexibility.
- 4 sale attempts since 6y ago with the ask held roughly flat each time — persistent listings suggest the price (not the market) is what's stuck; bring a comps-based counter.
- Current owner paid $45k; list at $90k implies a 100% gain — meaningful room to come down on a strong offer.
Risks & watch-outs
- Watch-outs: built in 1894 — expect roof / HVAC / electrical / plumbing capex.
Questions for the listing agent
- Built in 1894 — when were the roof, HVAC, electrical panel, plumbing, and water heater last replaced?
- Is there a deadline driving the sale (1031 exchange, divorce, estate, relocation)? That informs how much negotiation room exists.
- Schools are F-rated, which usually means shorter tenancies and higher turnover. Who's the typical renter profile here, and what's been the actual vacancy rate?
- Crime grade is F in this area — have there been break-ins, vandalism, or insurance claims at this property in the last 3 years? What carrier currently insures it and at what premium?
- What's the average days-on-market for RENTAL listings here right now (not sales)? A rising rental-DOM trend means longer vacancies and softer asking-rent achievability than the comps imply.
- What's the recent tenant-quality profile in this submarket — average credit score on applications, eviction rate, late-payment / NSF rate, and stable-employment percentage? A property-management company in the area should have these aggregated.
- How much new for-sale + rental construction is in the pipeline within 1–3 miles? Heavy new supply typically softens prices + rents 12–24 months out; constrained supply supports both.
Investment metrics
- 1% rule
- 1.37% ✓
- Cap rate
- 10.87%
- Cash-on-cash
- 16.35%
- DSCR
- 1.73
- GRM
- 6.1
CMA / ARV
- ARV (on-the-fly)
- $87,050
- Comps found
- 12
Show comp detail 12 sales within ~0.75 mi
| Address | Dist | Beds/Ba | Sqft | Sold | Price | $/sf | Match |
|---|---|---|---|---|---|---|---|
| 1614 Barnard St | 0.30mi | 4/2.0 | 1,677 (-4%) | 4mo | $160,000 | $95 | 76 |
| 513 N Oakley St | 0.13mi | 4/1.5 | 1,644 (-6%) | 8mo | $65,000 | $40 | 76 |
| 516 N Granger St | 0.32mi | 4/2.0 | 1,862 (+7%) | 7mo | $150,000 | $81 | 67 |
| 412 N Oakley St | 0.19mi | 4/1.0 | 1,905 (+9%) | 6mo | $36,000 | $19 | 66 |
| 203 N Webster St | 0.43mi | 3/2.0 (-1) | 1,607 (-8%) | 4mo | $115,000 | $72 | 59 |
| 2403 Stobbe St | 0.29mi | 4/1.5 | 1,510 (-13%) | 6mo | $90,000 | $60 | 58 |
| 1907 Adams Blvd | 0.58mi | 3/2.0 (-1) | 1,654 (-5%) | 3mo | $130,000 | $79 | 57 |
| 1118 Cass St | 0.52mi | 3/1.5 (-1) | 1,617 (-7%) | 7mo | $46,500 | $29 | 51 |
| 616 S Oakley St | 0.74mi | 3/1.0 (-1) | 1,836 (+6%) | 7mo | $36,000 | $20 | 42 |
| 1933 Delaware St | 0.61mi | 3/1.0 (-1) | 1,539 (-12%) | 3mo | $51,000 | $33 | 41 |
| 2104 Delaware Blvd | 0.72mi | 3/1.5 (-1) | 1,611 (-8%) | 8mo | $80,000 | $50 | 40 |
| 407 S Oakley St | 0.61mi | 3/1.0 (-1) | 1,495 (-14%) | 4mo | $58,000 | $39 | 36 |
Match score weights: distance 35% · size 25% · config 20% · recency 20%. Top-matched comps best support the ARV.
Projected returns pro-forma
-3.0% appreciation · 3.98% rent growth · sell at horizon
- IRR
- 8.5%
- Equity multiple
- 1.34×
- Total profit
- $8,532
- Equity at exit
- $13,404
- IRR
- 18.6%
- Equity multiple
- 2.62×
- Total profit
- $40,801
- Equity at exit
- $7,773
Cash invested: $25,172 (down + closing). Projections, not guarantees.
Landlord ↔ Tenant lean methodology
- Overall (STATE)
- 62 Landlord-Friendly
- State Michigan
- 62 Landlord-Friendly · EVEN
- County
- — inherits STATE
- City
- — inherits STATE
ZIP-level market 48602
- Home prices YoY
- -19.7%
- Rents YoY
- 4.0%
- Active inventory
- 250
- Price-to-rent
- 6.1×
Monthly cashflow live
- Estimated rent
- $1,233 medium interval (Pro) →
- Mortgage (P&I)
- −$471
- Tax from tax record
- −$122 /mo · $1,468/yr
- Insurance
- −$37
- HOA
- −$0
- Vacancy / Maint / Mgmt
- −$259
- Net cashflow
- $343
Break-even live
UW: 25.0% down · 7.5% · 30yr · 1.5% tax · 5.0% vac · 8.0% maint · 8.0% mgmt
Financing live
Cash to close
- Down payment
- $22,475
- Closing costs
- $2,697
- Reserves months
- —
- Total cash needed
- —
Loan-product check · same deal, 3 products live
Conventional
25% down · 7.5% · 30yr
- Down + closing
- —
- Monthly P&I
- —
- Monthly cashflow
- —
- DSCR
- —
- Eligible?
- —
Personal DTI + credit; lowest rate.
DSCR
20% down · 8.5% · 30yr
- Down + closing
- —
- Monthly P&I
- —
- Monthly cashflow
- —
- DSCR
- —
- Eligible?
- —
No personal income docs; deal must DSCR.
Hard money
10% down · 12.0% · 12mo
- Down + closing
- —
- Monthly P&I
- —
- Monthly cashflow
- —
- DSCR
- —
- Eligible?
- —
Short-term bridge; refi at stabilization.
Listing history 12 events
-
2026-06-19days on market $89,900 Active 16 DOM
-
2026-06-18days on market $89,900 Active 15 DOM
-
2026-06-17days on market $89,900 Active 14 DOM
-
2026-06-16days on market $89,900 Active 13 DOM
-
2026-06-15days on market $89,900 Active 12 DOM
-
2026-06-14days on market $89,900 Active 10 DOM
-
2026-06-12days on market $89,900 Active 9 DOM
-
2026-06-09days on market $89,900 Active 6 DOM
-
2026-06-08days on market $89,900 Active 5 DOM
-
2026-06-07days on market $89,900 Active 4 DOM
-
2026-06-03remarks 699-char remark
Show marketing remark (951 chars)
Turnkey investment opportunity with reliable, long-term tenants already in place. This duplex offers over 1,700 square feet of living space with 4 total bedrooms and 3 total bathrooms, generating $1,550 per month in rental income. Both tenants have occupied their units for more than five years and are currently on month-to-month leases, providing flexibility for future ownership plans. The property features a basement with laundry hookups, a detached one-car garage, and several recent improvements, including approximately half of the plumbing being updated within the last three years. Tenants pay for their own heat, electricity, and snow removal, helping reduce operating expenses, while the landlord covers water and lawn maintenance. Whether you're looking to expand your portfolio or purchase your first income-producing property, this well-maintained duplex offers steady cash flow and strong rental history in an established neighborhood.
-
2026-06-03$89,900 Active 1 DOM
Show marketing remark (951 chars)
Turnkey investment opportunity with reliable, long-term tenants already in place. This duplex offers over 1,700 square feet of living space with 4 total bedrooms and 3 total bathrooms, generating $1,550 per month in rental income. Both tenants have occupied their units for more than five years and are currently on month-to-month leases, providing flexibility for future ownership plans. The property features a basement with laundry hookups, a detached one-car garage, and several recent improvements, including approximately half of the plumbing being updated within the last three years. Tenants pay for their own heat, electricity, and snow removal, helping reduce operating expenses, while the landlord covers water and lawn maintenance. Whether you're looking to expand your portfolio or purchase your first income-producing property, this well-maintained duplex offers steady cash flow and strong rental history in an established neighborhood.
ⓘ Source: listings_history table (triggers on properties + properties_extension) + one-shot
backfill from property_details.listing_events for pre-trigger history.
Tax reassessment forecast MI · Partial reset (capped growth)
- Current annual tax
- $1,468 · $122/mo
- Projected year-2 tax
- $1,468 · $122/mo
- Expected delta
- $0/yr ($0/mo · 0.0%)
ⓘ Screening estimate from a state-policy table — verify with the county assessor before closing.
Climate risk First Street
- Flood 1/10 Low FEMA zone X (unshaded) · 0% chance over 30 yrs
- Wildfire 1/10 Low
- Heat 2/10 Low 7 d/yr ≥100°F today · 14 d/yr by 30 yrs out
- Wind 1/10 Low
- Air quality 2/10 Low 1 unhealthy d/yr today · 2 by 30 yrs out
Nearby sold comps map
Loading sold comps map…
Walkable amenities ~0.75 mi
Loading nearby amenities…
Taxation est. · year 1
- Rental income
- $14,799
- − Mortgage interest
- −$5,036
- − Property taxes
- −$1,468
- − Insurance
- −$450
- − Repairs & maintenance
- −$1,184
- − Management
- −$1,184
- − Depreciation
- −$2,615
- Taxable income
- $2,862
- Est. tax owed @ 24.0%
- −$687
- After-tax cash flow
- $3,429/yr
For passive investors: Depreciation is non-cash, so a rental often shows a tax loss while cash-flowing — sheltering income. Rental losses are passive: they offset passive income freely, and up to $25,000/yr can offset ordinary (W-2) income if you actively participate and your MAGI is under $100k (phasing out to $0 by $150k); unused losses carry forward. On sale, claimed depreciation is recaptured at up to 25%, and gains may owe capital-gains tax (a 1031 exchange can defer both). Figures are a year-1 estimate at your 24.0% rate — not tax advice; consult a CPA.
Schools (NCES district)
- District
- Saginaw School District
- NCES district ID
- 2630390
- Math proficiency
- 20% ▼ -5.00%
- Reading proficiency
- 29% ▼ -3.00%
- Median HH income
- $28,940
- Composite
- 19.6/100
- National rank
- #8755
- State rank
- #444 of 540 in MI
Livability — Saginaw
- Score
- 63/100
- State rank
- #521
- US rank
- #15424
Category grades
Schools grade is shown separately in the Schools card above.
Census & demographics
- Census place
- Saginaw, MI
- County
- Saginaw County · 54,884 people
- City population
- 54,884
- Metro
- Saginaw, MI
- Population (ZIP)
- 27,127
- Household income
- $46,984
- Rent vs Own
- Severe rent burden
- 1416.0
Population outlook (Saginaw County) Hauer SSP2
- Today (2025)
- 180,568 people
- By 2030
- 172,302 · -4.6%
- By 2040
- 153,919 · -14.8%
- By 2050
- 135,519 · -24.9%
- By 2075
- 97,199 · -46.2%
- By 2100
- 65,037 · -64.0%
Race, ethnicity, and origin ACS 2023
- Neighborhood character
- Diverse neighborhood (Simpson 0.64)
- Race & ethnicity
- White 50% Black 27% Hispanic / Latino 17% Two or more races 12%
- Hispanic origin (detail)
- Mexican 14% Puerto Rican 1%
- Common ancestry
- Romanian 4% Lithuanian 3% Italian 2%
- Foreign-born
- 1% · Canada
- Languages at home
- 96% English-only · Spanish 3%
Political lean MEDSL · Saginaw
- 2024 margin
- Toss-up / Even · D 47.7% · R 51.0% · Other 1.4%
- 2008→2024 swing
- -20.6pp toward R · 2008: 17.3pp · 2024: -3.3pp
- All cycles
- 2024: R+3.3 2020: D+0.3 2016: R+1.1 2012: D+11.9 2008: D+17.3
Not yet ingested
- Civics
- —
Market trends
- HPI YoY
- ▼ -39.15%
- Current HPI
- 159.8807
- Rent YoY
- ▲ 3.98%
- Metro
- Saginaw, MI
- State GDP YoY
- ▲ 1.37%
- F500 in state
- 28
Industry mix (Fortune 500 HQ in MI)
| Industry | F500 HQs | Revenue |
|---|---|---|
| Automotive Parts | 3 | $48B |
|
||
| Automotive | 2 | $372B |
|
||
| Chemicals | 1 | $45B |
|
||
| Automotive Retail | 1 | $29B |
|
||
| Healthcare / Medical Devices | 1 | $23B |
|
||
| Automotive Technology | 1 | $20B |
|
||
Price history
+100.2% since first listed8 events — show timeline
- 2026-06-03 Listed $89,900 REALCOMP
- 2026-06-03 Listed $89,900 MiRealSource-MiMLS
- 2021-06-24 Sold (MLS) $44,900 MiRealSource-MiMLS
- 2021-06-24 Sold (MLS) $44,900 REALCOMP
- 2020-09-23 Pending — REALCOMP
- 2020-09-23 Pending — MiRealSource-MiMLS
- 2020-09-15 Listed $44,900 MiRealSource-MiMLS
- 2020-09-15 Listed $44,900 REALCOMP
Property tax history
+1.6%/yrLatest (2025): $1,468 · -16.3% YoY. Source: county tax records.
Cash-flow waterfall
monthlySold comps — $/sqft
last 12 mo · ≤1 miLoading sold comps…