 🏗️ New Construction
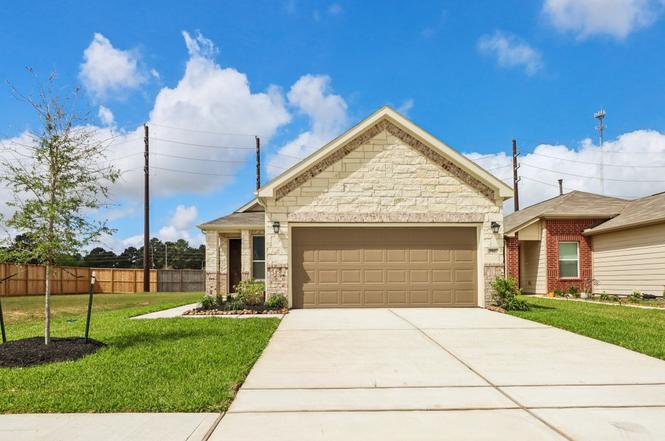
19807 Corberry Park Ln · Houston, TX
Flood risk No data
- FEMA flood zone
- —
- Chance of flooding over 30 yrs
- —
- Est. flood insurance / yr
- —
Fire risk No data
- Est. fire insurance / yr
- —
Heat risk No data
- Hot days now (above threshold)
- —
- Hot days in 30 yrs
- —
Wind risk No data
- Chance of severe wind over 30 yrs
- —
Air-quality risk No data
- Unhealthy air days now
- —
- Unhealthy air days in 30 yrs
- —
Risk factors via First Street. Map © Google.
Why this score? — see what drove the D- grade
The composite is a weighted blend of 9 inputs, each scored 0–100. Each bar is that input's sub-score; the figure is the points it added to the 100-point composite (weight × sub-score).
- Cash flow +10.8/30.0
- ARV discount +7.5/15.0
- Livability +3.7/5.0
- 1% rule +3.5/10.0
- DSCR +3.1/10.0
- Schools +2.9/10.0
- Condition / age +2.5/5.0
- Rent growth +2.1/5.0
- Appreciation +0.0/10.0
$239,995
🖨 Deal sheet (PDF) 📄 Offer letter ✓ Due diligence
Listing remarks
KB HOME NEW CONSTRUCTION - Welcome to 19807 Corberry Park Lane, a beautifully designed one-story home with NO BACK NEIGHBORS is located in the sought-after Bauer Meadows community—zoned to Waller ISD! This stunning home features 3 bedrooms, 2 full bathrooms, and an attached 2-car garage. Enjoy the charm of a spacious front porch and the flexibility of a versatile den—perfect for a home office, formal dining, or second living area. The kitchen shines with Silestone countertops and stainless steel Whirlpool appliances, while both the primary and secondary bathrooms feature stylish 30" vanities. Additional highlights include a ceiling fan in the Great Room, tankless water heat
Key facts
- 30 inch vanities
- Versatile den
- Spacious front porch
Tags
Property features AI
Finance
- Other: Municipal Utility District disclosure
- HOA & community: Association: Vision Communities Management; Annual association fee of $900; Community features include curbs and gutters
Exterior
- Parking: Attached 2-car garage
- Security: Smoke detectors
- Utilities: Public water; Public sewer
- Home design: Residential property; New construction (builder: KB Home); Slab foundation; Composition roof; Living area approximately 1,377; Year built 2025
- Construction: Brick and stone construction
- Exterior features: Deck; Patio; Porch; Private yard; Fenced backyard; Subdivision setting; Concrete road access
Interior
- Kitchen: Dishwasher; Free-standing range; Gas oven; Gas range; Microwave; Disposal
- Bedrooms: Primary bedroom (first floor) — 13.5 x 13.5; Bedroom (first floor) — 10 x 14; Bedroom (first floor) — 9.5 x 10; Den (first floor) — 10 x 10; Breakfast nook (first floor) — 6.5 x 3.5
- Flooring: Carpet; Plank; Tile; Vinyl
- Bathrooms: 2 full bathrooms
- Heating & cooling: Central heating (gas); Central electric air conditioning
- Interior features: Kitchen/family room combo; Pantry; Solid surface counters; Tub with shower; Window treatments; Ceiling fans; Programmable thermostat; ENERGY STAR qualified appliances; Tankless water heater; Window coverings
- Laundry & utility: Washer hookup; Electric dryer hookup
Neighborhood map
What this means for you Summary
Snapshot
- This is a 3-bed/2.0-bath single-family listed at $240k.
Deal economics
- At list price, monthly cash flow is $-119 ($-1k/yr) — negative.
- The deal already cash-flows at list — no discount required.
- To meet the 1% rule (rent ≥ 1% of price), the offer needs to be $221k (8.0% below list).
- Recommended offer: $218k (9.0% below list) — sets the bar for market timing.
- Cap rate 5.7% vs local median 3.2% in Houston — top-decile yield for the area; either an underpriced asset or a hidden risk that comps aren't pricing in. Stress-test before assuming the spread holds.
Location & tenants
- Location reads 74/100 on livability (#184 in TX, #4,771 nationally) — a middle-class / working-renter tenant base. Strengths: amenities A+, cost of living A+, housing A+; Watch: crime F.
- Waller ISD (rural): math 30% / reading 35% proficiency, ranked #532 of 826 in TX (top 64%) — families likely to look elsewhere, expect single-tenant / working-renter base with shorter leases.
- Zoned schools: Evelyn Turlington El (math 46% / reading 45%, grade D-, #1,112 of 4,322 statewide, top 26%, 1,084 students, 69% FRL); Schultz J H (math 31% / reading 37%, grade F, #892 of 1,662 statewide, top 55%, 1,120 students, 65% FRL); Waller H S (math 25% / reading 40%, grade F, #1,029 of 1,632 statewide, top 64%, 2,639 students, 62% FRL).
- Market conditions: Rents soft (-1.6%/yr); 1791 active listings in the ZIP; 3 comparable units currently listed for rent nearby; rentals leasing fast (median 1d on market — plan ~1-2 weeks tenant-placement turnaround); high-income renter base; 29,883 units permitted in Harris County in 2024 (8,621 in 5+ unit buildings).
Forward outlook
- Local home prices are declining (-3.0%/yr); year-one equity from $2k of loan paydown is wiped out by about $8k of value loss. Plan a longer hold.
- Harris County population projected at +47% by 2050 — long-run rental-demand tailwind backs the buy-and-hold thesis.
Negotiation context
- It's been on market 100 days — a 9% lower offer ($218k) is reasonable based on typical stale-listing flexibility.
- 2 sale attempts; this cycle's ask has dropped $14k (6%) from the opening price — seller is motivated, your offer sets the floor, not the list.
Questions for the listing agent
- What do current leases actually rent for vs. the listed asking? Can we see a recent rent roll and the last 12 months of T-12 income?
- It's been on market 100 days. Have you received any prior offers? Is the seller open to a 9% concession, seller financing, or rate buy-down credit?
- What does the HOA fee cover, when was the last increase, and are there any pending special assessments or reserve-fund shortfalls?
- Why hasn't it sold? Are there any deal-killer items the seller is aware of (foundation, flood, title, zoning, code violations)?
- Is there a deadline driving the sale (1031 exchange, divorce, estate, relocation)? That informs how much negotiation room exists.
- Schools are D-rated, which usually means shorter tenancies and higher turnover. Who's the typical renter profile here, and what's been the actual vacancy rate?
- Crime grade is F in this area — have there been break-ins, vandalism, or insurance claims at this property in the last 3 years? What carrier currently insures it and at what premium?
- The area grade is low — what's the realistic commute time and amenity access for the typical tenant pool here? Any planned neighborhood developments (good or bad) we should know about?
- What's the average days-on-market for RENTAL listings here right now (not sales)? A rising rental-DOM trend means longer vacancies and softer asking-rent achievability than the comps imply.
- What's the recent tenant-quality profile in this submarket — average credit score on applications, eviction rate, late-payment / NSF rate, and stable-employment percentage? A property-management company in the area should have these aggregated.
- How much new for-sale + rental construction is in the pipeline within 1–3 miles? Heavy new supply typically softens prices + rents 12–24 months out; constrained supply supports both.
Investment metrics
- 1% rule
- 0.85% ✗
- Cap rate
- 5.74%
- Cash-on-cash
- -1.98%
- DSCR
- 0.91
- GRM
- 9.8
CMA / ARV
- ARV (on-the-fly)
- $258,876
- Comps found
- 12
Show comp detail 12 sales within ~0.75 mi
| Address | Dist | Beds/Ba | Sqft | Sold | Price | $/sf | Match |
|---|---|---|---|---|---|---|---|
| 19807 Corberry Park Ln | 0.00mi | 3/2.0 | 1,377 (0%) | 1mo | $239,995 | $174 | 99 |
| 22846 Mahogany Hills Ln | 0.07mi | 3/2.0 | 1,360 (-1%) | 1mo | $219,995 | $162 | 94 |
| 22855 Magnolia Haven Dr | 0.14mi | 3/2.0 | 1,377 (0%) | 4mo | $244,995 | $178 | 90 |
| 22862 Magnolia Haven Dr | 0.11mi | 3/2.0 | 1,242 (-10%) | 4mo | $234,995 | $189 | 75 |
| 22846 Magnolia Haven Dr | 0.12mi | 3/2.0 | 1,242 (-10%) | 6mo | $232,995 | $188 | 73 |
| 19727 Corberry Park Ln | 0.02mi | 3/2.0 | 1,548 (+12%) | 7mo | $249,995 | $161 | 73 |
| 22843 Magnolia Haven Dr | 0.14mi | 3/2.0 | 1,242 (-10%) | 8mo | $246,315 | $198 | 71 |
| 19902 Thurlow Ln | 0.17mi | 3/2.0 | 1,548 (+12%) | 4mo | $245,930 | $159 | 68 |
| 22803 Gentle Shadow Dr | 0.43mi | 3/2.0 | 1,470 (+7%) | 5mo | $280,000 | $190 | 64 |
| 20011 Epirus Shores Dr | 0.65mi | 3/2.0 | 1,350 (-2%) | 4mo | $220,000 | $163 | 63 |
| 23123 Glory Orchid Dr | 0.43mi | 4/2.0 (+1) | 1,506 (+9%) | 1mo | $302,900 | $201 | 59 |
| 23031 Glory Orchid Dr | 0.40mi | 2/2.5 (-1) | 1,186 (-14%) | 1mo | $249,900 | $211 | 50 |
Match score weights: distance 35% · size 25% · config 20% · recency 20%. Top-matched comps best support the ARV.
Projected returns pro-forma
-3.0% appreciation · 0.0% rent growth · sell at horizon
- IRR
- -23.1%
- Equity multiple
- 0.23×
- Total profit
- $-55,948
- Equity at exit
- $38,599
- IRR
- -29.0%
- Equity multiple
- -0.15×
- Total profit
- $-83,202
- Equity at exit
- $22,383
Cash invested: $72,485 (down + closing). Projections, not guarantees.
Landlord ↔ Tenant lean methodology
- Overall (STATE)
- 87 Strongly Landlord-Friendly
- State Texas
- 87 Strongly Landlord-Friendly · R+5
- County
- — inherits STATE
- City
- — inherits STATE
ZIP-level market 77447
- Home prices YoY
- -31.1%
- Rents YoY
- -1.6%
- Active inventory
- 1791
- Price-to-rent
- 9.1×
Monthly cashflow live
- Estimated rent
- $2,208 medium interval (Pro) →
- Mortgage (P&I)
- −$1,358
- Tax est. 1.5%
- −$324 /mo · $3,883/yr
- Insurance
- −$108
- HOA
- −$75
- Vacancy / Maint / Mgmt
- −$464
- Net cashflow
- $-119
Break-even live
Sensitivity live
| Price | -10% $59 | -5% $-30 | +0% $-119 | +5% $-209 | +10% $-298 |
|---|---|---|---|---|---|
| Rent | -10% $-294 | -5% $-207 | +0% $-119 | +5% $-32 | +10% $55 |
| Rate | -1.0pp $11 | -0.5pp $-54 | base $-119 | +0.5pp $-187 | +1.0pp $-255 |
UW: 25.0% down · 7.5% · 30yr · 1.5% tax · 5.0% vac · 8.0% maint · 8.0% mgmt
Financing live
Cash to close
- Down payment
- $64,719
- Closing costs
- $7,766
- Reserves months
- —
- Total cash needed
- —
Loan-product check · same deal, 3 products live
Conventional
25% down · 7.5% · 30yr
- Down + closing
- —
- Monthly P&I
- —
- Monthly cashflow
- —
- DSCR
- —
- Eligible?
- —
Personal DTI + credit; lowest rate.
DSCR
20% down · 8.5% · 30yr
- Down + closing
- —
- Monthly P&I
- —
- Monthly cashflow
- —
- DSCR
- —
- Eligible?
- —
No personal income docs; deal must DSCR.
Hard money
10% down · 12.0% · 12mo
- Down + closing
- —
- Monthly P&I
- —
- Monthly cashflow
- —
- DSCR
- —
- Eligible?
- —
Short-term bridge; refi at stabilization.
Rent comps 3 comps
| Address | Beds | Baths | Sqft | Rent | $/sqft | DOM | Units | Dist |
|---|---|---|---|---|---|---|---|---|
| 20313 Evergreen Cypress Dr Hockley, TX | 2.0–5.0 | 2.0–3.5 | 2051 | $2,353 | $1.15 | 0d | 1 | 0.44mi |
| 22023 Lost Lantern Dr Hockley, TX | 3.0–4.0 | 2.0 | 1601 | $1,901 | $1.19 | 0d | 1 | 1.17mi |
| 22719 Klingamans Way Hockley, TX | 3.0 | 2.0 | 1416 | $1,689 | $1.19 | 3d | 1 | 1.18mi |
HOA detail
- Monthly dues
- $75 · $900/yr
- Likely covers
- waterpool
Listing history 19 events
-
2026-04-15status Pending
-
2026-04-08price $239,995
-
2026-03-18price $245,995
-
2026-02-18price $244,993
-
2026-02-11price $244,883
-
2026-02-05price $249,883
-
2026-01-23price $249,424
-
2026-01-14price $249,995
-
2026-01-05$254,424 Active
-
2026-01-05historical
-
2025-12-18price $254,424
-
2025-12-03price $254,995
-
2025-11-12price $255,364
-
2025-11-06price $253,364
-
2025-10-01price $249,995
-
2025-09-03price $253,215
-
2025-07-23price $260,215
-
2025-07-18price $260,175
-
2025-07-10$268,175 Active
ⓘ Source: listings_history table (triggers on properties + properties_extension) + one-shot
backfill from property_details.listing_events for pre-trigger history.
Nearby sold comps map
Loading sold comps map…
Walkable amenities ~0.75 mi
Loading nearby amenities…
Taxation est. · year 1
- Rental income
- $26,500
- − Mortgage interest
- −$14,501
- − Property taxes
- −$3,883
- − Insurance
- −$1,294
- − Repairs & maintenance
- −$2,120
- − Management
- −$2,120
- − HOA
- −$900
- − Depreciation
- −$7,531
- Taxable loss
- −$5,849
- Est. tax savings @ 24.0%
- +$1,404
- After-tax cash flow
- $-29/yr
For passive investors: Depreciation is non-cash, so a rental often shows a tax loss while cash-flowing — sheltering income. Rental losses are passive: they offset passive income freely, and up to $25,000/yr can offset ordinary (W-2) income if you actively participate and your MAGI is under $100k (phasing out to $0 by $150k); unused losses carry forward. On sale, claimed depreciation is recaptured at up to 25%, and gains may owe capital-gains tax (a 1031 exchange can defer both). Figures are a year-1 estimate at your 24.0% rate — not tax advice; consult a CPA.
Schools (NCES district)
- District
- Waller ISD
- NCES district ID
- 4844430
- Math proficiency
- 30% ▼ -23.00%
- Reading proficiency
- 35% ▼ -11.00%
- Median HH income
- $58,911
- Composite
- 29.12/100
- National rank
- #6593
- State rank
- #532 of 826 in TX
Livability — Houston
- Score
- 74/100
- State rank
- #184
- US rank
- #4771
Category grades
Schools grade is shown separately in the Schools card above.
Census & demographics
- County
- Harris County · 4,702,590 people
- City population
- 3,226,434
- Metro
- Houston-The Woodlands-Sugar Land, TX
- Population (ZIP)
- 25,231
- Household income
- $116,925
- Rent vs Own
- Severe rent burden
- 265.0
Population outlook (Harris County) Hauer SSP2
- Today (2025)
- 5,571,493 people
- By 2030
- 6,089,821 · +9.3%
- By 2040
- 7,142,806 · +28.2%
- By 2050
- 8,185,864 · +46.9%
- By 2075
- 10,574,329 · +89.8%
- By 2100
- 12,109,958 · +117.4%
Race, ethnicity, and origin ACS 2023
- Neighborhood character
- Diverse neighborhood (Simpson 0.63)
- Race & ethnicity
- White 44% Hispanic / Latino 41% Two or more races 16% Black 9% Asian 1%
- Hispanic origin (detail)
- Mexican 27%
- Common ancestry
- Lithuanian 3% Slovak 1% Romanian 1%
- Foreign-born
- 15% · Canada, Jamaica, Dominican Republic
- Languages at home
- 69% English-only · Spanish 28% Other Indo-European 1% Vietnamese 1%
Political lean MEDSL · Harris
- 2024 margin
- Lean D (+5.5) · D 52.0% · R 46.4% · Other 1.6%
- 2008→2024 swing
- +3.9pp toward D · 2008: 1.6pp · 2024: 5.5pp
- All cycles
- 2024: D+5.5 2020: D+13.3 2016: D+12.4 2012: D+0.1 2008: D+1.6
Not yet ingested
- Civics
- —
Market trends
- HPI YoY
- ▼ -112.73%
- Current HPI
- 249.6969
- Rent YoY
- ▼ -1.58%
- Metro
- Houston-The Woodlands-Sugar Land, TX
- State GDP YoY
- ▲ 3.95%
- F500 in state
- 110
Industry mix (Fortune 500 HQ in TX)
| Industry | F500 HQs | Revenue |
|---|---|---|
| Energy | 16 | $1,198B |
|
||
| Technology | 5 | $198B |
|
||
| Engineering / Construction | 4 | $72B |
|
||
| Energy Services | 3 | $60B |
|
||
| Utilities | 3 | $41B |
|
||
| Healthcare | 2 | $330B |
|
||
Price history
-10.5% since first listed19 events — show timeline
- 2026-04-15 Pending — HARMLS
- 2026-04-08 Price Changed $239,995 HARMLS
- 2026-03-18 Price Changed $245,995 HARMLS
- 2026-02-18 Price Changed $244,993 HARMLS
- 2026-02-11 Price Changed $244,883 HARMLS
- 2026-02-05 Price Changed $249,883 HARMLS
- 2026-01-23 Price Changed $249,424 HARMLS
- 2026-01-14 Price Changed $249,995 HARMLS
- 2026-01-05 Listing Removed — HARMLS
- 2026-01-05 Listed $254,424 HARMLS
- 2025-12-18 Price Changed $254,424 HARMLS
- 2025-12-03 Price Changed $254,995 HARMLS
- 2025-11-12 Price Changed $255,364 HARMLS
- 2025-11-06 Price Changed $253,364 HARMLS
- 2025-10-01 Price Changed $249,995 HARMLS
- 2025-09-03 Price Changed $253,215 HARMLS
- 2025-07-23 Price Changed $260,215 HARMLS
- 2025-07-18 Price Changed $260,175 HARMLS
- 2025-07-10 Listed $268,175 HARMLS
Cash-flow waterfall
monthlySold comps — $/sqft
last 12 mo · ≤1 miLoading sold comps…