 6-Plex
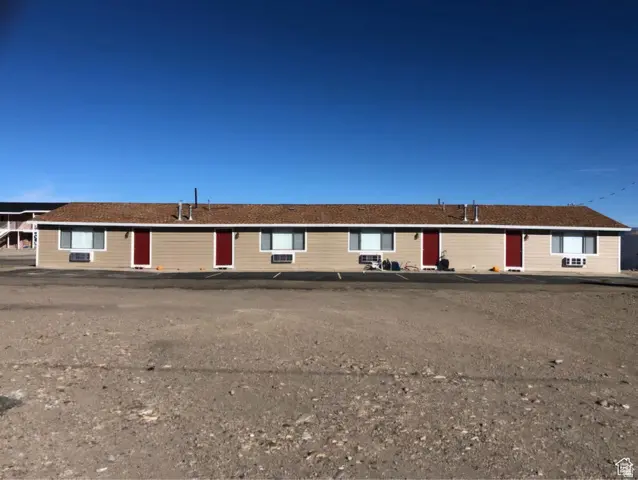
570 W Main St · Green River, UT
Flood risk No data
- FEMA flood zone
- —
- Chance of flooding over 30 yrs
- —
- Est. flood insurance / yr
- —
Fire risk No data
- Est. fire insurance / yr
- —
Heat risk No data
- Hot days now (above threshold)
- —
- Hot days in 30 yrs
- —
Wind risk No data
- Chance of severe wind over 30 yrs
- —
Air-quality risk No data
- Unhealthy air days now
- —
- Unhealthy air days in 30 yrs
- —
Risk factors via First Street. Map © Google.
Why this score? — see what drove the C+ grade
The composite is a weighted blend of 9 inputs, each scored 0–100. Each bar is that input's sub-score; the figure is the points it added to the 100-point composite (weight × sub-score).
- Cash flow +21.8/30.0
- ARV discount +7.5/15.0
- DSCR +7.0/10.0
- Appreciation +6.4/10.0
- 1% rule +5.7/10.0
- Condition / age +3.8/5.0
- Livability +3.2/5.0
- Rent growth +2.5/5.0
- Schools +2.5/10.0
$625,000
🖨 Deal sheet 📄 Offer letter ✓ Due diligence
Multi-family units
County records classify this as Multi-Family (5+ Unit). Listing-text estimate: 6 units. confirmed
5+ unit building — per-unit beds/baths from public records are typically unavailable; the breakdown below (if shown) is an estimate from the listing text.
Listing remarks
6 Plex Money Maker. This property on Main Street in Greenriver includes 4 studios and 2 2Bedrooms apartments. Remodeled and updated. %93 occupancy rate. Add these to your portfolio and let your loan pay itself off. Ideal for an owner occupy scenario. New gas water heaters just installed. Currently one of the tenants assist as a property manager for rent deduction. Gross over 60k and net over 44k annually. The adjacent property MLS 2020533 (16plex) is also for sale. the Greenriver sits close to incredible attractions that include the San Rafael, Greenriver, Goblin Valley, Slot Canyons, Petroglyphs, Bookcliffs, Golfing, Ghost towns, and within an hour of the Arches. Quiet town that is known f
Key facts
- Remodeled
- 1.22 acre lot
- 20 parking spots
Tags
Property features AI
Finance
- Other:
- Financial info: Total of 6 units; Four units: approximately 350 sq ft each, rent $800 each; Two units: approximately 700 sq ft each, 2 beds/2 baths, rent $1,250 each; Zoned Commercial
- HOA & community:
Exterior
- Parking: 20 total parking spaces (all open)
- Security:
- Utilities: Natural gas available; Electricity connected; Public sewer connected; Water connected (culinary)
- Home design: Single-story building; Built and currently standing
- Construction: Asphalt roof (repeated from exterior features)
- Exterior features: Asphalt roof; Property currently used as residential; South-facing
Interior
- Kitchen:
- Bedrooms: Four 1-bath units (unit-level details noted below); Two 2-bed, 2-bath units (unit-level details noted below)
- Flooring:
- Bathrooms: One bathroom in each of the four smaller units; Two bathrooms in each of the two larger units
- Heating & cooling: Electric heating; Heat pump
- Interior features: Plantation shutters
- Laundry & utility:
Neighborhood map
What this means for you Summary
Snapshot
- This is a 6 × 8-bed/8.0-bath units multifamily listed at $625k. Condition is rated good.
Deal economics
- At list price, monthly cash flow is $970 ($12k/yr) — positive. Per door: $162/mo.
- The deal already cash-flows at list — no discount required.
- Meets the 1% rule at list price ($7k rent vs $625k).
- Recommended offer: $606k (3.0% below list) — sets the bar for market timing.
Location & tenants
- Location reads 64/100 on livability (#166 in UT) — a middle-class / working-renter tenant base. Strengths: cost of living A+, health & safety A; Watch: employment D+, housing D+, schools F.
- Grand District (town): math 27% / reading 31% proficiency, ranked #71 of 80 in UT (top 89%) — low school quality limits family demand, transient renter base, plan for 1-2y turnover.
- Market conditions: 15 active listings in the ZIP; 238 units permitted in Grand County in 2024 (100 in 5+ unit buildings).
Forward outlook
- In year one you build about $22k of equity ($4k loan paydown + $17k appreciation (2.8% local appreciation)).
- Grand County population projected at +10% by 2050 — modest demand growth; plan on rents tracking national, not racing it.
- At projected returns (2.8% appreciation + 3.0% rent growth), your $175k cash investment doubles in ~5 years — after that, you're playing with house money.
- By year 2, paydown + projected appreciation supports a ~$35k cash-out refi (75% LTV) — recoverable capital for the next deal without selling this one.
Negotiation context
- It's been on market 53 days — a 3% lower offer ($606k) is reasonable based on typical stale-listing flexibility.
- 4 sale attempts since 2y ago with the ask held roughly flat each time — persistent listings suggest the price (not the market) is what's stuck; bring a comps-based counter.
Questions for the listing agent
- It's been on market 53 days. Have you received any prior offers? Is the seller open to a 3% concession, seller financing, or rate buy-down credit?
- Can we see the unit-by-unit rent roll, current vacancy, and any below-market leases? What's the average tenancy length?
- What capital expenditures (roof, boiler, parking lot, exteriors) have been made in the last 5 years, and what's planned in the next 2?
- Built in 1977 — when were the roof, HVAC, electrical panel, plumbing, and water heater last replaced?
- Is there a deadline driving the sale (1031 exchange, divorce, estate, relocation)? That informs how much negotiation room exists.
- Schools are F-rated, which usually means shorter tenancies and higher turnover. Who's the typical renter profile here, and what's been the actual vacancy rate?
- What's the average days-on-market for RENTAL listings here right now (not sales)? A rising rental-DOM trend means longer vacancies and softer asking-rent achievability than the comps imply.
- What's the recent tenant-quality profile in this submarket — average credit score on applications, eviction rate, late-payment / NSF rate, and stable-employment percentage? A property-management company in the area should have these aggregated.
- How much new apartment / multifamily construction is in the pipeline within 1–3 miles? Heavy new supply (>2% of stock underway) typically softens rents 12–24 months out; light construction supports rent growth.
Investment metrics
- 1% rule
- 1.07% ✓
- Cap rate
- 8.15%
- Cash-on-cash
- 6.65%
- DSCR
- 1.30
- GRM
- 7.8
CMA / ARV
No comps found within radius.
Projected returns pro-forma
2.77% appreciation · 3.0% rent growth · sell at horizon
- IRR
- 13.1%
- Equity multiple
- 1.74×
- Total profit
- $129,661
- Equity at exit
- $273,050
- IRR
- 15.2%
- Equity multiple
- 3.20×
- Total profit
- $384,656
- Equity at exit
- $414,703
Cash invested: $175,000 (down + closing). Projections, not guarantees.
Landlord ↔ Tenant lean methodology
- Overall (STATE)
- 86 Strongly Landlord-Friendly
- State Utah
- 86 Strongly Landlord-Friendly · R+15
- County
- — inherits STATE
- City
- — inherits STATE
ZIP-level market 84525
- Home prices YoY
- 2.5%
- Active inventory
- 15
- Price-to-rent
- 46.7×
Monthly cashflow live
- Estimated rent
- $6,695 medium interval (Pro) →
- Mortgage (P&I)
- −$3,278
- Tax est. 1.5%
- −$781 /mo · $9,375/yr
- Insurance
- −$260
- HOA
- −$0
- Vacancy / Maint / Mgmt
- −$1,406
- Net cashflow
- $970
Break-even live
6-unit breakdown (identical units grouped — click to expand)
| Units | Beds | Baths | Est. rent |
|---|---|---|---|
| 6× units | 8 | 8 | $6,696 |
| #1 | 8 | 8 | $1,116 |
| #2 | 8 | 8 | $1,116 |
| #3 | 8 | 8 | $1,116 |
| #4 | 8 | 8 | $1,116 |
| #5 | 8 | 8 | $1,116 |
| #6 | 8 | 8 | $1,116 |
| Total (6 units) | $6,695 | ||
UW: 25.0% down · 7.5% · 30yr · 1.5% tax · 5.0% vac · 8.0% maint · 8.0% mgmt
Financing live
Cash to close
- Down payment
- $156,250
- Closing costs
- $18,750
- Reserves months
- —
- Total cash needed
- —
Loan-product check · same deal, 3 products live
Conventional
25% down · 7.5% · 30yr
- Down + closing
- —
- Monthly P&I
- —
- Monthly cashflow
- —
- DSCR
- —
- Eligible?
- —
Personal DTI + credit; lowest rate.
DSCR
20% down · 8.5% · 30yr
- Down + closing
- —
- Monthly P&I
- —
- Monthly cashflow
- —
- DSCR
- —
- Eligible?
- —
No personal income docs; deal must DSCR.
Hard money
10% down · 12.0% · 12mo
- Down + closing
- —
- Monthly P&I
- —
- Monthly cashflow
- —
- DSCR
- —
- Eligible?
- —
Short-term bridge; refi at stabilization.
Listing history 28 events
-
2026-06-19days on market $625,000 Active 53 DOM
-
2026-06-18days on market $625,000 Active 52 DOM
-
2026-06-17days on market $625,000 Active 51 DOM
-
2026-06-16days on market $625,000 Active 50 DOM
-
2026-06-15days on market $625,000 Active 49 DOM
-
2026-06-14days on market $625,000 Active 47 DOM
-
2026-06-13days on market $625,000 Active 46 DOM
-
2026-06-10days on market $625,000 Active 44 DOM
-
2026-06-09days on market $625,000 Active 43 DOM
-
2026-06-08days on market $625,000 Active 42 DOM
-
2026-06-07days on market $625,000 Active 41 DOM
-
2026-06-05days on market $625,000 Active 38 DOM
-
2026-06-03days on market $625,000 Active 37 DOM
-
2026-06-02days on market $625,000 Active 36 DOM
-
2026-06-01days on market $625,000 Active 35 DOM
-
2026-05-31days on market $625,000 Active 34 DOM
-
2026-05-30days on market $625,000 Active 33 DOM
-
2026-04-28$625,000 Active
-
2026-02-28historical
-
2026-02-18price $623,000
-
2026-01-29price $624,000
-
2025-09-03status Active
-
2025-08-28historical
-
2025-04-23price $625,000
-
2025-03-18status Active
-
2025-03-18price $650,000
-
2025-01-08historical
-
2024-08-27$695,000 Active
ⓘ Source: listings_history table (triggers on properties + properties_extension) + one-shot
backfill from property_details.listing_events for pre-trigger history.
Nearby sold comps map
Loading sold comps map…
Walkable amenities ~0.75 mi
Loading nearby amenities…
Taxation est. · year 1
- Rental income
- $80,340
- − Mortgage interest
- −$35,010
- − Property taxes
- −$9,375
- − Insurance
- −$3,125
- − Repairs & maintenance
- −$6,427
- − Management
- −$6,427
- − Depreciation
- −$18,182
- Taxable income
- $1,794
- Est. tax owed @ 24.0%
- −$431
- After-tax cash flow
- $11,207/yr
For passive investors: Depreciation is non-cash, so a rental often shows a tax loss while cash-flowing — sheltering income. Rental losses are passive: they offset passive income freely, and up to $25,000/yr can offset ordinary (W-2) income if you actively participate and your MAGI is under $100k (phasing out to $0 by $150k); unused losses carry forward. On sale, claimed depreciation is recaptured at up to 25%, and gains may owe capital-gains tax (a 1031 exchange can defer both). Figures are a year-1 estimate at your 24.0% rate — not tax advice; consult a CPA.
Condition & rehab AI · 13 photos
This multi-family property is in good condition with updated kitchens and bathrooms. It has a good roof, exterior, and foundation, and is located in a desirable area with nearby attractions. Painting the countertops and bathrooms would significantly enhance its appeal and value.
Repairs flagged
- Minor Kitchen countertops — The countertops appear worn and could benefit from a fresh coat of paint or a new surface.
- Minor Bathroom paint — The paint appears slightly faded and could be refreshed with a new coat.
Value-add opportunities
- Both Painting the kitchen countertops and bathrooms — Refreshing the paint on the countertops and bathrooms will improve the overall appearance and appeal of the property, benefiting both resale and rental value.
Renovation cost estimate screening
| Repair item | Severity | Est. cost |
|---|---|---|
| Kitchen countertops · The countertops appear worn and could benefit from a fresh coat of paint or a new surface. | Minor | $500–3,000 |
| Bathroom paint · The paint appears slightly faded and could be refreshed with a new coat. | Minor | $500–3,000 |
| Total estimated repair cost · 2 items | $1,000–6,000 |
Value-add ROI direction
- Both Painting the kitchen countertops and bathrooms — Refreshing the paint on the countertops and bathrooms will improve the overall appearance and appeal of the property, benefiting both resale and rental value. ↑
ⓘ Cost ranges are severity-bucket heuristics (US national rule-of-thumb). Get contractor quotes + a written scope before underwriting a rehab budget.
Schools (NCES district)
- District
- Grand District
- NCES district ID
- 4900330
- Math proficiency
- 27% ▼ -7.00%
- Reading proficiency
- 31% ▼ -8.00%
- Median HH income
- $43,188
- Composite
- 24.71/100
- National rank
- #7611
- State rank
- #71 of 80 in UT
Livability — Green River
- Score
- 64/100
- State rank
- #166
- US rank
- #13816
Category grades
Schools grade is shown separately in the Schools card above.
Census & demographics
- Population (ZIP)
- 871
Population outlook (Grand County) Hauer SSP2
- Today (2025)
- 10,228 people
- By 2030
- 10,507 · +2.7%
- By 2040
- 10,897 · +6.5%
- By 2050
- 11,243 · +9.9%
- By 2075
- 12,309 · +20.3%
- By 2100
- 13,202 · +29.1%
Race, ethnicity, and origin ACS 2023
- Neighborhood character
- Predominantly White (66%)
- Race & ethnicity
- White 66% Hispanic / Latino 32% Two or more races 4% Native American 2%
- Hispanic origin (detail)
- Mexican 26%
- Common ancestry
- Slovak 3% Iranian 3% Italian 1%
- Foreign-born
- 9% · Canada
- Languages at home
- 74% English-only · Spanish 23%
Political lean MEDSL · Grand
- 2024 margin
- Lean D (+9.4) · D 53.4% · R 43.9% · Other 2.7%
- 2008→2024 swing
- +4.6pp toward D · 2008: 4.8pp · 2024: 9.4pp
- All cycles
- 2024: D+9.4 2020: D+10.8 2016: R+0.0 2012: R+6.3 2008: D+4.8
Not yet ingested
- Civics
- —
Market trends
- HPI YoY
- ▲ 2.77%
- Current HPI
- 111.4272
- Rent YoY
- —
- Metro
- —
- State GDP YoY
- ▲ 3.54%
- F500 in state
- 2
Industry mix (Fortune 500 HQ in UT)
| Industry | F500 HQs | Revenue |
|---|---|---|
| Financial Services | 1 | $3B |
|
||
Price history
-10.1% since first listed11 events — show timeline
- 2026-04-28 Listed $625,000 WFRMLS
- 2026-02-28 Listing Removed — WFRMLS
- 2026-02-18 Price Changed $623,000 WFRMLS
- 2026-01-29 Price Changed $624,000 WFRMLS
- 2025-09-03 Relisted — WFRMLS
- 2025-08-28 Listing Removed — WFRMLS
- 2025-04-23 Price Changed $625,000 WFRMLS
- 2025-03-18 Relisted — WFRMLS
- 2025-03-18 Price Changed $650,000 WFRMLS
- 2025-01-08 Listing Removed — WFRMLS
- 2024-08-27 Listed $695,000 WFRMLS
Cash-flow waterfall
monthlySold comps — $/sqft
last 12 mo · ≤1 miLoading sold comps…