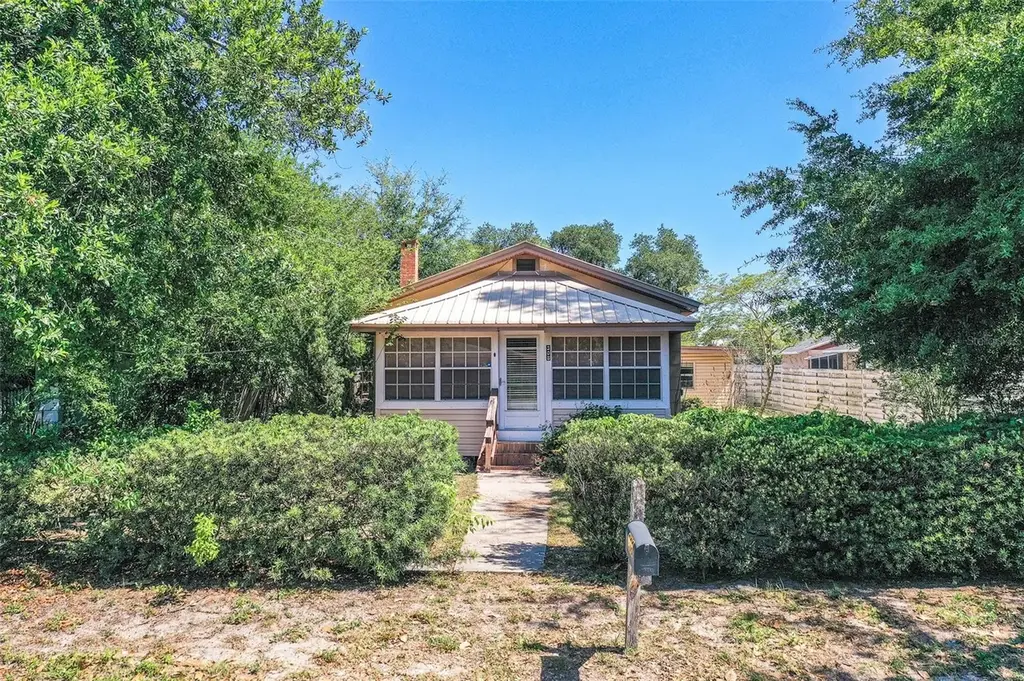
308 W Dixie St · Plant City, FL
Flood risk 1/10 · Minimal
- FEMA flood zone
- X (unshaded)
- Chance of flooding over 30 yrs
- 0.0%
- Est. flood insurance / yr
- $507 – $1,088
Fire risk 4/10 · Minor
- Est. fire insurance / yr
- $947 – $1,759
Heat risk 8/10 · Major
- Hot days now (above 108°F)
- 6 days/yr
- Hot days in 30 yrs
- 18 days/yr
Wind risk 9/10 · Severe
- Chance of severe wind over 30 yrs
- 99.0%
Air-quality risk 3/10 · Minor
- Unhealthy air days now
- 2 days/yr
- Unhealthy air days in 30 yrs
- 3 days/yr
Risk factors via First Street. Map © Google.
Why this score? — see what drove the D- grade
The composite is a weighted blend of 9 inputs, each scored 0–100. Each bar is that input's sub-score; the figure is the points it added to the 100-point composite (weight × sub-score).
- Cash flow +12.5/30.0
- ARV discount +7.5/15.0
- Schools +4.2/10.0
- Livability +3.8/5.0
- DSCR +3.7/10.0
- 1% rule +3.3/10.0
- Condition / age +2.5/5.0
- Rent growth +2.4/5.0
- Appreciation +0.0/10.0
$185,000
🖨 Deal sheet 📄 Offer letter ✓ Due diligence
Listing remarks MLS
Charming 2 bedroom/2 bath home located in Plant City. Close to I-4 in case you have to commute. Rear entry to the property keeps front of house aesthetically pleasing.
Key facts
- Durable metal roof
- 7,560 sq ft lot
- Parking
Tags
Property features AI
Finance
- Other: Lot is landscaped, level and paved (approx. 0.17 acre, dimensions 56 x 135); Roads are asphalt/paved; Trees and landscaping on lot
- HOA & community: No HOA/association; Pets allowed
Exterior
- Parking: Driveway; Carport (1 space)
- Utilities: Public water; Public sewer; Electricity connected; High-speed internet / broadband available
- Home design: Single-family residence; One story; South-facing; Residential zoning (R-1)
- Construction: Frame construction with vinyl siding and asbestos materials; Metal roof; Crawlspace foundation; Built area about 1,438 sq ft
- Exterior features: Covered, enclosed rear patio/porch; Patio; Rear porch; Exterior lighting; Sidewalk; Storage (shed)
Interior
- Kitchen: Range; Microwave; Refrigerator
- Bedrooms: 2 bedrooms
- Flooring: Ceramic tile
- Bathrooms: 2 full bathrooms
- Heating & cooling: Central heating (electric); Central air conditioning
- Interior features: Ceiling fans; Living room/dining room combo; Solid wood cabinets; Window treatments (including blinds)
- Laundry & utility: Washer; Dryer; Laundry room (outside)
Neighborhood map
What this means for you Summary
Snapshot
- This is a 2-bed/2.0-bath single-family listed at $185k.
Deal economics
- At list price, monthly cash flow is $-28 ($-341/yr) — negative.
- To cash-flow at today's rent, offer at most $180k (2.7% below list).
- To meet the 1% rule (rent ≥ 1% of price), the offer needs to be $153k (17.2% below list).
- Recommended offer: $153k (17.2% below list) — sets the bar for 1% rule.
Location & tenants
- Location reads 76/100 on livability (#227 in FL, #3,587 nationally) — a middle-class / working-renter tenant base. Strengths: amenities A+, cost of living A+, housing A+; Watch: employment C-, commute F.
- Hillsborough (suburban): math 47% / reading 50% proficiency, ranked #41 of 73 in FL (top 56%) — families likely to look elsewhere, expect single-tenant / working-renter base with shorter leases.
- Zoned schools: Wilson Elementary School (math 37% / reading 37%, grade F, #1,609 of 2,144 statewide, top 77%, 317 students, 89% FRL); Plant City High School (math 38% / reading 40%, grade F, #312 of 667 statewide, top 48%, 2,474 students, 58% FRL) — zoned schools average 73% FRL vs 52% district-wide (22 pts higher); higher-poverty schools than district average — tighter screening recommended.
- Market conditions: Rents soft (-0.6%/yr); 181 active listings in the ZIP; 20 comparable units currently listed for rent nearby; rentals at typical pace (median 24d on market — plan ~3-4 weeks tenant-placement turnaround); 9,053 units permitted in Hillsborough County in 2024 (4,555 in 5+ unit buildings).
- This rent runs 31% of the median local income ($60k/yr) — at the standard rent-burdened threshold; future hikes will face affordability resistance.
Forward outlook
- Local home prices are declining (-3.0%/yr); year-one equity from $1k of loan paydown is wiped out by about $6k of value loss. Plan a longer hold.
- Hillsborough County population projected at +37% by 2050 — long-run rental-demand tailwind backs the buy-and-hold thesis.
Negotiation context
- Only 6 days on market — expect competitive offers; lowballing is unlikely to land.
- 3 sale attempts since 17y ago; this cycle's ask is 6% above the opening price — seller raised mid-cycle; expect resistance to lowballs.
Risks & watch-outs
- Watch-outs: built in 1940 — expect roof / HVAC / electrical / plumbing capex.
- Climate carrying-cost: severe wind risk, 99% chance of damaging wind over 30y; extreme-heat days projected 6→18/yr by 2055 (HVAC capex compounding) — expect insurance premiums to compound above CPI over the hold.
Questions for the listing agent
- What do current leases actually rent for vs. the listed asking? Can we see a recent rent roll and the last 12 months of T-12 income?
- Built in 1940 — when were the roof, HVAC, electrical panel, plumbing, and water heater last replaced?
- Is there a deadline driving the sale (1031 exchange, divorce, estate, relocation)? That informs how much negotiation room exists.
- Schools are D-rated, which usually means shorter tenancies and higher turnover. Who's the typical renter profile here, and what's been the actual vacancy rate?
- The area grade is low — what's the realistic commute time and amenity access for the typical tenant pool here? Any planned neighborhood developments (good or bad) we should know about?
- What's the average days-on-market for RENTAL listings here right now (not sales)? A rising rental-DOM trend means longer vacancies and softer asking-rent achievability than the comps imply.
- What's the recent tenant-quality profile in this submarket — average credit score on applications, eviction rate, late-payment / NSF rate, and stable-employment percentage? A property-management company in the area should have these aggregated.
- How much new for-sale + rental construction is in the pipeline within 1–3 miles? Heavy new supply typically softens prices + rents 12–24 months out; constrained supply supports both.
Investment metrics
- 1% rule
- 0.83% ✗
- Cap rate
- 6.11%
- Cash-on-cash
- -0.66%
- DSCR
- 0.97
- GRM
- 10.1
CMA / ARV
No comps found within radius.
Projected returns pro-forma
-3.0% appreciation · 0.0% rent growth · sell at horizon
- IRR
- -20.7%
- Equity multiple
- 0.30×
- Total profit
- $-36,276
- Equity at exit
- $27,584
- IRR
- -22.4%
- Equity multiple
- 0.01×
- Total profit
- $-51,271
- Equity at exit
- $15,995
Cash invested: $51,800 (down + closing). Projections, not guarantees.
Landlord ↔ Tenant lean methodology
- Overall (STATE)
- 87 Strongly Landlord-Friendly
- State Florida
- 87 Strongly Landlord-Friendly · R+3
- County
- — inherits STATE
- City
- — inherits STATE
ZIP-level market 33563
- Home prices YoY
- -23.2%
- Rents YoY
- -0.6%
- Active inventory
- 181
- Price-to-rent
- 10.1×
Monthly cashflow live
- Estimated rent
- $1,532 high interval (Pro) →
- Mortgage (P&I)
- −$970
- Tax from tax record
- −$191 /mo · $2,296/yr
- Insurance
- −$77
- HOA
- −$0
- Vacancy / Maint / Mgmt
- −$322
- Net cashflow
- $-28
Break-even live
UW: 25.0% down · 7.5% · 30yr · 1.5% tax · 5.0% vac · 8.0% maint · 8.0% mgmt
Financing live
Cash to close
- Down payment
- $46,250
- Closing costs
- $5,550
- Reserves months
- —
- Total cash needed
- —
Loan-product check · same deal, 3 products live
Conventional
25% down · 7.5% · 30yr
- Down + closing
- —
- Monthly P&I
- —
- Monthly cashflow
- —
- DSCR
- —
- Eligible?
- —
Personal DTI + credit; lowest rate.
DSCR
20% down · 8.5% · 30yr
- Down + closing
- —
- Monthly P&I
- —
- Monthly cashflow
- —
- DSCR
- —
- Eligible?
- —
No personal income docs; deal must DSCR.
Hard money
10% down · 12.0% · 12mo
- Down + closing
- —
- Monthly P&I
- —
- Monthly cashflow
- —
- DSCR
- —
- Eligible?
- —
Short-term bridge; refi at stabilization.
Rent comps 20 comps
| Address | Beds | Baths | Sqft | Rent | $/sqft | DOM | Units | Dist |
|---|---|---|---|---|---|---|---|---|
| 1408 Spencer Ct Apt A Plant City, FL | 2.0 | 1.0 | 754 | $1,200 | $1.59 | 24d | 1 | 0.09mi |
| 1309 N Franklin St Plant City, FL | 2.0 | 2.0 | 1042 | $1,750 | $1.68 | 5d | 1 | 0.28mi |
| 507 W Baker St Plant City, FL | 2.0 | 1.0 | 1000 | $1,199 | $1.20 | 24d | 1 | 0.85mi |
| 603 N Dort St Unit 1106-E Plant City, FL | 2.0 | 1.5 | 1100 | $1,699 | $1.54 | 24d | 1 | 0.93mi |
| 603 N Dort St Plant City, FL | 1.0–2.0 | 1.0–2.0 | 975 | $1,699 | $1.74 | 1d | 11 | 0.93mi |
| 603 N Dort St Unit 1106-H Plant City, FL | 2.0 | 1.5 | 1100 | $1,699 | $1.54 | 14d | 1 | 0.93mi |
| 603 N Dort St Unit 1306-2B Plant City, FL | 2.0 | 1.0 | 900 | $1,449 | $1.61 | 22d | 1 | 0.93mi |
| 113 S Collins St Apt 2 Plant City, FL | 2.0 | 1.0 | 850 | $1,400 | $1.65 | 24d | 1 | 1.01mi |
| 111 Pearl St Plant City, FL | 2.0 | 1.0 | 850 | $1,500 | $1.76 | 24d | 1 | 1.05mi |
| 1001 Jenkins St Unit A Plant City, FL | 2.0 | 1.0 | 1000 | $2,050 | $2.05 | 24d | 1 | 1.13mi |
| 1802 W House St Unit B Plant City, FL | 2.0 | 1.0 | 800 | $1,640 | $2.05 | 5d | 1 | 1.14mi |
| 1211 Goldfinch Dr Plant City, FL | 1.0–2.0 | 1.0 | 770 | $1,614 | $2.10 | 1d | 12 | 1.16mi |
| 2210 Thonotosassa Rd Unit 8 Plant City, FL | 1.0 | 1.0 | 625 | $950 | $1.52 | 24d | 1 | 1.26mi |
| 809 1/2 W Warren St Plant City, FL | 3.0 | 2.0 | 947 | $1,650 | $1.74 | 24d | 1 | 1.29mi |
| 501 W Ball St Unit War814 Plant City, FL | 2.0 | 1.0 | 614 | $1,499 | $2.44 | 11d | 1 | 1.42mi |
| 501 W Ball St Unit Bal12135 Plant City, FL | 2.0 | 1.0 | 624 | $1,499 | $2.40 | 24d | 1 | 1.42mi |
| 501 W Ball St Unit Hun303 Plant City, FL | 1.0 | 1.0 | 614 | $1,399 | $2.28 | 24d | 1 | 1.42mi |
| 501 W Ball St Unit 609-02 Plant City, FL | 2.0 | 1.0 | 780 | $1,499 | $1.92 | 3d | 1 | 1.42mi |
| 501 W Ball St Unit 705-13 Plant City, FL | 2.0 | 1.0 | 780 | $1,499 | $1.92 | 22d | 1 | 1.42mi |
| 2120 Village Park Rd Plant City, FL | 1.0–3.0 | 1.0–2.0 | 1025 | $1,575 | $1.54 | 1d | 17 | 1.50mi |
Listing history 10 events
-
2026-05-17status Pending 1709-char remark
-
2026-05-12price $185,000 1709-char remark
-
2026-05-11$175,000 Active 1709-char remark
-
2023-04-04soldstatus $179,500 Closed 167-char remark
Show marketing remark (167 chars)
Charming 2 bedroom/2 bath home located in Plant City. Close to I-4 in case you have to commute. Rear entry to the property keeps front of house aesthetically pleasing.
-
2023-03-03status Pending 167-char remark
Show marketing remark (167 chars)
Charming 2 bedroom/2 bath home located in Plant City. Close to I-4 in case you have to commute. Rear entry to the property keeps front of house aesthetically pleasing.
-
2023-02-27$179,500 Active 167-char remark
Show marketing remark (167 chars)
Charming 2 bedroom/2 bath home located in Plant City. Close to I-4 in case you have to commute. Rear entry to the property keeps front of house aesthetically pleasing.
-
2011-10-05soldstatus $80,000
-
2010-11-16historical
-
2009-02-13$79,900
-
1991-09-01soldstatus $51,500
ⓘ Source: listings_history table (triggers on properties + properties_extension) + one-shot
backfill from property_details.listing_events for pre-trigger history.
Tax reassessment forecast FL · Resets to sale price
- Current annual tax
- $2,296 · $191/mo
- Projected year-2 tax
- $2,296 · $191/mo
- Expected delta
- $0/yr ($0/mo · 0.0%)
ⓘ Screening estimate from a state-policy table — verify with the county assessor before closing.
Climate risk First Street
- Flood 1/10 Low FEMA zone X (unshaded) · 0% chance over 30 yrs
- Wildfire 4/10 Moderate
- Heat 8/10 Severe 6 d/yr ≥108°F today · 18 d/yr by 30 yrs out
- Wind 9/10 Extreme 99% chance of damaging wind over 30 yrs
- Air quality 3/10 Moderate 2 unhealthy d/yr today · 3 by 30 yrs out
Nearby sold comps map
Loading sold comps map…
Walkable amenities ~0.75 mi
Loading nearby amenities…
Taxation est. · year 1
- Rental income
- $18,383
- − Mortgage interest
- −$10,363
- − Property taxes
- −$2,296
- − Insurance
- −$925
- − Repairs & maintenance
- −$1,471
- − Management
- −$1,471
- − Depreciation
- −$5,382
- Taxable loss
- −$3,524
- Est. tax savings @ 24.0%
- +$846
- After-tax cash flow
- $505/yr
For passive investors: Depreciation is non-cash, so a rental often shows a tax loss while cash-flowing — sheltering income. Rental losses are passive: they offset passive income freely, and up to $25,000/yr can offset ordinary (W-2) income if you actively participate and your MAGI is under $100k (phasing out to $0 by $150k); unused losses carry forward. On sale, claimed depreciation is recaptured at up to 25%, and gains may owe capital-gains tax (a 1031 exchange can defer both). Figures are a year-1 estimate at your 24.0% rate — not tax advice; consult a CPA.
Schools (NCES district)
- District
- Hillsborough
- NCES district ID
- 1200870
- Math proficiency
- 47% ▼ -8.00%
- Reading proficiency
- 50% ▼ -4.00%
- Median HH income
- $50,622
- Composite
- 41.6/100
- National rank
- #3435
- State rank
- #41 of 73 in FL
Livability — Plant City
- Score
- 76/100
- State rank
- #227
- US rank
- #3587
Category grades
Schools grade is shown separately in the Schools card above.
Census & demographics
- Census place
- Plant City, FL
- County
- Hillsborough County · 1,540,968 people
- City population
- 68,525
- Metro
- Tampa-St. Petersburg-Clearwater, FL
- Population (ZIP)
- 25,896
- Household income
- $60,131
- Rent vs Own
- Severe rent burden
- 932.0
Population outlook (Hillsborough County) Hauer SSP2
- Today (2025)
- 1,607,022 people
- By 2030
- 1,733,968 · +7.9%
- By 2040
- 1,979,565 · +23.2%
- By 2050
- 2,203,427 · +37.1%
- By 2075
- 2,667,893 · +66.0%
- By 2100
- 2,891,558 · +79.9%
Race, ethnicity, and origin ACS 2023
- Neighborhood character
- Diverse neighborhood (Simpson 0.64)
- Race & ethnicity
- White 43% Hispanic / Latino 39% Black 15% Two or more races 15% Native American 2%
- Hispanic origin (detail)
- Mexican 24% Puerto Rican 5% Cuban 1%
- Common ancestry
- Lithuanian 2% Italian 1% Slovak 1%
- Foreign-born
- 16% · Canada, Jamaica
- Languages at home
- 66% English-only · Spanish 34%
Political lean MEDSL · Hillsborough
- 2024 margin
- Toss-up / Even · D 47.8% · R 50.9% · Other 1.3%
- 2008→2024 swing
- -10.2pp toward R · 2008: 7.1pp · 2024: -3.1pp
- All cycles
- 2024: R+3.1 2020: D+6.9 2016: D+6.8 2012: D+6.7 2008: D+7.1
Not yet ingested
- Civics
- —
Market trends
- HPI YoY
- ▼ -103.29%
- Current HPI
- 342.5789
- Rent YoY
- ▼ -0.57%
- Metro
- Tampa-St. Petersburg-Clearwater, FL
- State GDP YoY
- ▲ 3.28%
- F500 in state
- 36
Industry mix (Fortune 500 HQ in FL)
| Industry | F500 HQs | Revenue |
|---|---|---|
| Industrial Technology | 2 | $29B |
|
||
| Insurance | 2 | $17B |
|
||
| Retail | 1 | $60B |
|
||
| Technology Distribution | 1 | $58B |
|
||
| Homebuilding | 1 | $35B |
|
||
| Technology Manufacturing | 1 | $35B |
|
||
Price history
+259.2% since first listed10 events — show timeline
- 2026-05-17 Pending — Stellar MLS as Distributed by MLS Grid
- 2026-05-12 Price Changed $185,000 Stellar MLS as Distributed by MLS Grid
- 2026-05-11 Listed $175,000 Stellar MLS as Distributed by MLS Grid
- 2023-04-04 Sold (MLS) $179,500 Stellar MLS as Distributed by MLS Grid
- 2023-03-03 Pending — Stellar MLS as Distributed by MLS Grid
- 2023-02-27 Listed $179,500 Stellar MLS as Distributed by MLS Grid
- 2011-10-05 Sold (Public Records) $80,000 Public Records
- 2010-11-16 Listing Removed — Stellar MLS as Distributed by MLS Grid
- 2009-02-13 Listed $79,900 Stellar MLS as Distributed by MLS Grid
- 1991-09-01 Sold (Public Records) $51,500 Public Records
Property tax history
+9.9%/yrLatest (2025): $2,296 · +4.6% YoY. Source: county tax records.
Cash-flow waterfall
monthlySold comps — $/sqft
last 12 mo · ≤1 miLoading sold comps…