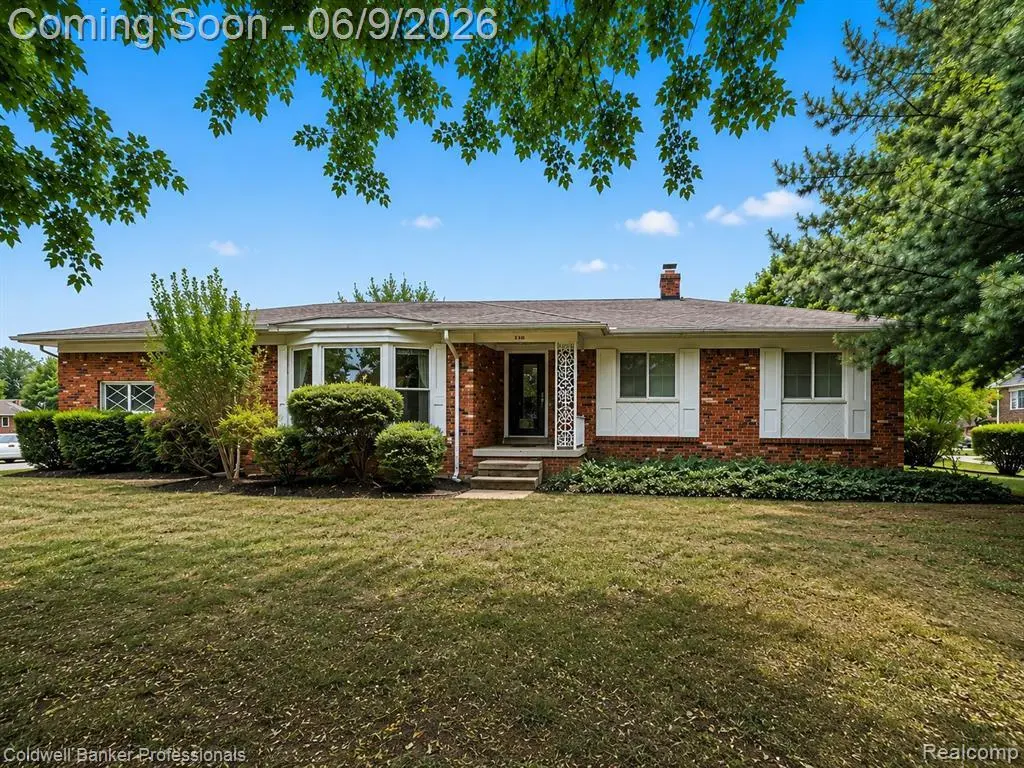
53238 Saturn Dr · Shelby, MI
Flood risk 1/10 · Minimal
- FEMA flood zone
- X (unshaded)
- Chance of flooding over 30 yrs
- 0.0%
- Est. flood insurance / yr
- $473 – $860
Fire risk 1/10 · Minimal
- Est. fire insurance / yr
- $784 – $1,456
Heat risk 3/10 · Minor
- Hot days now (above 97°F)
- 7 days/yr
- Hot days in 30 yrs
- 16 days/yr
Wind risk 1/10 · Minimal
- Chance of severe wind over 30 yrs
- —
Air-quality risk 3/10 · Minor
- Unhealthy air days now
- 2 days/yr
- Unhealthy air days in 30 yrs
- 4 days/yr
Risk factors via First Street. Map © Google.
Why this score? — see what drove the D- grade
The composite is a weighted blend of 9 inputs, each scored 0–100. Each bar is that input's sub-score; the figure is the points it added to the 100-point composite (weight × sub-score).
- ARV discount +9.8/15.0
- Cash flow +8.7/30.0
- Schools +4.1/10.0
- Livability +3.5/5.0
- Rent growth +2.5/5.0
- Condition / age +2.5/5.0
- DSCR +2.4/10.0
- 1% rule +2.0/10.0
- Appreciation +0.0/10.0
$350,000
🖨 Deal sheet 📄 Offer letter ✓ Due diligence
Listing remarks
This is your chance to own a piece of local history! This 1962 Weinberger custom ranch has three bedrooms, two full baths, a large kitchen and dining area, and the Weinberger hallmark step down living and family rooms. The home features countless built ins and shelving, gorgeous wet plaster curved ceilings with hand designed fan shaping on the ceiling in the living room and beams on the ceiling in the family room. It's situated on a large corner lot with a private fenced backyard and mature trees. It has an oversized 2 car garage with newer door and remotes. The large partially finished basement has plenty of storage and possibilities for additional living space, a home gym, or office space
Key facts
- 0.31 acre lot
- 2 garage spots
- Built 1962
Property features AI
Exterior
- Parking: Attached 2-car garage with side loading, garage door opener and electrical in garage
- Utilities: Public water; Septic sewer; Natural gas for heating and water heater; Electric service for appliances and garage
- Home design: Residential single-story home; Built in 1962; Basement foundation; Located in a subdivision (Starlite Meadows)
- Construction: Brick construction; Basement foundation; Year built 1962; Partially finished basement space
- Exterior features: Brick exterior; Deck, porch, and fenced yard; Corner lot; Paved street access
Interior
- Kitchen: Includes dishwasher, range/oven, and refrigerator
- Bedrooms: Three bedrooms on the entry level with wood flooring
- Flooring: Wood flooring in bedrooms; Linoleum and ceramic in bathrooms
- Bathrooms: Two full bathrooms; Bathroom finishes include linoleum and ceramic flooring
- Heating & cooling: Forced air heating (natural gas); Central air conditioning and ceiling fans; Gas water heater
- Interior features: Fireplace (family room, living room; gas and electric options); Total of 5 rooms
- Laundry & utility: Washer and dryer included; Partially finished basement
Neighborhood map
What this means for you Summary
Snapshot
- This is a 3-bed/1.5-bath single-family listed at $350k.
Deal economics
- At list price, monthly cash flow is $-294 ($-4k/yr) — negative.
- To cash-flow at today's rent, offer at most $298k (14.9% below list).
- To meet the 1% rule (rent ≥ 1% of price), the offer needs to be $245k (30.0% below list).
- Recommended offer: $245k (30.0% below list) — sets the bar for 1% rule.
- Cap rate 5.3% vs local median 3.2% in Shelby — top-decile yield for the area; either an underpriced asset or a hidden risk that comps aren't pricing in. Stress-test before assuming the spread holds.
Location & tenants
- Location reads 70/100 on livability (#324 in MI) — a middle-class / working-renter tenant base. Strengths: crime A+, cost of living A+, housing A+; Watch: employment D+, schools F, amenities F.
- Utica Community Schools (suburban): math 38% / reading 53% proficiency, ranked #126 of 540 in MI (top 23%) — families likely to look elsewhere, expect single-tenant / working-renter base with shorter leases.
- Market conditions: 167 active listings in the ZIP; 1 comparable units currently listed for rent nearby; 1,321 units permitted in Macomb County in 2024 (86 in 5+ unit buildings).
Forward outlook
- Local home prices are declining (-3.0%/yr); year-one equity from $2k of loan paydown is wiped out by about $10k of value loss. Plan a longer hold.
- Macomb County population projected at +9% by 2050 — modest demand growth; plan on rents tracking national, not racing it.
Negotiation context
- Only 10 days on market — expect competitive offers; lowballing is unlikely to land.
Questions for the listing agent
- What do current leases actually rent for vs. the listed asking? Can we see a recent rent roll and the last 12 months of T-12 income?
- Built in 1962 — when were the roof, HVAC, electrical panel, plumbing, and water heater last replaced?
- Is there a deadline driving the sale (1031 exchange, divorce, estate, relocation)? That informs how much negotiation room exists.
- Schools are F-rated, which usually means shorter tenancies and higher turnover. Who's the typical renter profile here, and what's been the actual vacancy rate?
- The area grade is low — what's the realistic commute time and amenity access for the typical tenant pool here? Any planned neighborhood developments (good or bad) we should know about?
- What's the average days-on-market for RENTAL listings here right now (not sales)? A rising rental-DOM trend means longer vacancies and softer asking-rent achievability than the comps imply.
- What's the recent tenant-quality profile in this submarket — average credit score on applications, eviction rate, late-payment / NSF rate, and stable-employment percentage? A property-management company in the area should have these aggregated.
- How much new for-sale + rental construction is in the pipeline within 1–3 miles? Heavy new supply typically softens prices + rents 12–24 months out; constrained supply supports both.
Investment metrics
- 1% rule
- 0.70% ✗
- Cap rate
- 5.28%
- Cash-on-cash
- -3.61%
- DSCR
- 0.84
- GRM
- 11.9
CMA / ARV
- ARV (on-the-fly)
- $368,640
- Comps found
- 12
Show comp detail 12 sales within ~0.75 mi
| Address | Dist | Beds/Ba | Sqft | Sold | Price | $/sf | Match |
|---|---|---|---|---|---|---|---|
| 53375 Bunny Ln | 0.39mi | 3/2.5 | 1,870 (-3%) | 2mo | $505,000 | $270 | 72 |
| 5055 Lorin Dr | 0.16mi | 4/2.5 (+1) | 2,088 (+9%) | 2mo | $565,000 | $271 | 67 |
| 5001 Hampshire Dr | 0.44mi | 3/2.0 | 2,000 (+4%) | 9mo | $360,000 | $180 | 63 |
| 53223 Mark Dr | 0.16mi | 3/1.0 | 2,159 (+12%) | 10mo | $360,000 | $167 | 62 |
| 4001 Huhn Cir | 0.58mi | 3/1.5 | 2,103 (+10%) | 1mo | $315,000 | $150 | 56 |
| 54258 Horizon Dr | 0.68mi | 4/1.5 (+1) | 1,879 (-2%) | 5mo | $360,000 | $192 | 56 |
| 6038 Candler Dr | 0.56mi | 3/3.0 | 2,006 (+4%) | 10mo | $410,000 | $204 | 53 |
| 53265 Aulgur Dr | 0.58mi | 3/1.5 | 2,050 (+7%) | 12mo | $334,000 | $163 | 51 |
| 52335 Briggs Ct | 0.62mi | 3/1.5 | 2,072 (+8%) | 12mo | $410,000 | $198 | 47 |
| 52471 Ihla St | 0.67mi | 3/1.5 | 1,724 (-10%) | 9mo | $317,000 | $184 | 44 |
| 53588 Bruce Hill Dr | 0.64mi | 4/1.5 (+1) | 2,125 (+11%) | 6mo | $375,000 | $176 | 42 |
| 6278 Fordham Dr | 0.62mi | 4/2.0 (+1) | 1,751 (-9%) | 15mo | $351,000 | $200 | 37 |
Match score weights: distance 35% · size 25% · config 20% · recency 20%. Top-matched comps best support the ARV.
Projected returns pro-forma
-3.0% appreciation · 3.0% rent growth · sell at horizon
- IRR
- -22.4%
- Equity multiple
- 0.23×
- Total profit
- $-75,546
- Equity at exit
- $52,186
- IRR
- -16.6%
- Equity multiple
- 0.08×
- Total profit
- $-90,252
- Equity at exit
- $30,262
Cash invested: $98,000 (down + closing). Projections, not guarantees.
Landlord ↔ Tenant lean methodology
- Overall (STATE)
- 62 Landlord-Friendly
- State Michigan
- 62 Landlord-Friendly · EVEN
- County
- — inherits STATE
- City
- — inherits STATE
ZIP-level market 48316
- Active inventory
- 167
- Price-to-rent
- 11.9×
Monthly cashflow live
- Estimated rent
- $2,450 medium interval (Pro) →
- Mortgage (P&I)
- −$1,835
- Tax from tax record
- −$249 /mo · $2,984/yr
- Insurance
- −$146
- HOA
- −$0
- Vacancy / Maint / Mgmt
- −$514
- Net cashflow
- $-294
Break-even live
UW: 25.0% down · 7.5% · 30yr · 1.5% tax · 5.0% vac · 8.0% maint · 8.0% mgmt
Financing live
Cash to close
- Down payment
- $87,500
- Closing costs
- $10,500
- Reserves months
- —
- Total cash needed
- —
Loan-product check · same deal, 3 products live
Conventional
25% down · 7.5% · 30yr
- Down + closing
- —
- Monthly P&I
- —
- Monthly cashflow
- —
- DSCR
- —
- Eligible?
- —
Personal DTI + credit; lowest rate.
DSCR
20% down · 8.5% · 30yr
- Down + closing
- —
- Monthly P&I
- —
- Monthly cashflow
- —
- DSCR
- —
- Eligible?
- —
No personal income docs; deal must DSCR.
Hard money
10% down · 12.0% · 12mo
- Down + closing
- —
- Monthly P&I
- —
- Monthly cashflow
- —
- DSCR
- —
- Eligible?
- —
Short-term bridge; refi at stabilization.
Rent comps 1 comps
| Address | Beds | Baths | Sqft | Rent | $/sqft | DOM | Units | Dist |
|---|---|---|---|---|---|---|---|---|
| 6015 Brynthrop Dr Shelby Township, MI | 4.0 | 2.0 | 1800 | $2,450 | $1.36 | 4d | 1 | 0.91mi |
Listing history 10 events
-
2026-06-18days on market $350,000 Active 10 DOM
-
2026-06-17days on market $350,000 Active 9 DOM
-
2026-06-16days on market $350,000 Active 8 DOM
-
2026-06-15days on market $350,000 Active 7 DOM
-
2026-06-13days on market $350,000 Active 5 DOM
-
2026-06-13days on market $350,000 Active 4 DOM
-
2026-06-09statusdays on market $350,000 Active 1 DOM
-
2026-06-08days on market $350,000 Coming Soon 3 DOM
-
2026-06-07remarks 699-char remark
-
2026-06-07$350,000 Coming Soon 2 DOM
ⓘ Source: listings_history table (triggers on properties + properties_extension) + one-shot
backfill from property_details.listing_events for pre-trigger history.
Tax reassessment forecast MI · Partial reset (capped growth)
- Current annual tax
- $2,984 · $249/mo
- Projected year-2 tax
- $4,187 · $349/mo
- Expected delta
- +$1,203/yr (+$100/mo · 40.3%)
ⓘ Screening estimate from a state-policy table — verify with the county assessor before closing.
Climate risk First Street
- Flood 1/10 Low FEMA zone X (unshaded) · 0% chance over 30 yrs
- Wildfire 1/10 Low
- Heat 3/10 Moderate 7 d/yr ≥97°F today · 16 d/yr by 30 yrs out
- Wind 1/10 Low
- Air quality 3/10 Moderate 2 unhealthy d/yr today · 4 by 30 yrs out
Nearby sold comps map
Loading sold comps map…
Walkable amenities ~0.75 mi
Loading nearby amenities…
Taxation est. · year 1
- Rental income
- $29,400
- − Mortgage interest
- −$19,605
- − Property taxes
- −$2,984
- − Insurance
- −$1,750
- − Repairs & maintenance
- −$2,352
- − Management
- −$2,352
- − Depreciation
- −$10,182
- Taxable loss
- −$9,825
- Est. tax savings @ 24.0%
- +$2,358
- After-tax cash flow
- $-1,175/yr
For passive investors: Depreciation is non-cash, so a rental often shows a tax loss while cash-flowing — sheltering income. Rental losses are passive: they offset passive income freely, and up to $25,000/yr can offset ordinary (W-2) income if you actively participate and your MAGI is under $100k (phasing out to $0 by $150k); unused losses carry forward. On sale, claimed depreciation is recaptured at up to 25%, and gains may owe capital-gains tax (a 1031 exchange can defer both). Figures are a year-1 estimate at your 24.0% rate — not tax advice; consult a CPA.
Schools (NCES district)
- District
- Utica Community Schools
- NCES district ID
- 2634470
- Math proficiency
- 38% ▼ -13.00%
- Reading proficiency
- 53% ▼ -7.00%
- Median HH income
- $65,953
- Composite
- 40.52/100
- National rank
- #3709
- State rank
- #126 of 540 in MI
Livability — Shelby
- Score
- 70/100
- State rank
- #324
- US rank
- #7973
Category grades
Schools grade is shown separately in the Schools card above.
Census & demographics
- Population (ZIP)
- 28,355
Population outlook (Macomb County) Hauer SSP2
- Today (2025)
- 925,296 people
- By 2030
- 948,226 · +2.5%
- By 2040
- 983,961 · +6.3%
- By 2050
- 1,010,200 · +9.2%
- By 2075
- 1,076,222 · +16.3%
- By 2100
- 1,077,065 · +16.4%
Race, ethnicity, and origin ACS 2023
- Neighborhood character
- Predominantly White (89%)
- Race & ethnicity
- White 89% Hispanic / Latino 3% Two or more races 3% Asian 3% Black 2%
- Common ancestry
- Romanian 16% Lithuanian 4% Slovak 3%
- Foreign-born
- 12% · Canada, China, South Korea
- Languages at home
- 83% English-only · Other Indo-European 6% Russian/Polish/Slavic 4% Spanish 2%
Political lean MEDSL · Macomb
- 2024 margin
- R (+13.7) · D 42.2% · R 55.9% · Other 1.9%
- 2008→2024 swing
- -22.3pp toward R · 2008: 8.6pp · 2024: -13.7pp
- All cycles
- 2024: R+13.7 2020: R+8.1 2016: R+11.6 2012: D+4.0 2008: D+8.6
Not yet ingested
- Civics
- —
Market trends
- HPI YoY
- ▼ -200.39%
- Current HPI
- 186.8397
- Rent YoY
- —
- Metro
- —
- State GDP YoY
- ▲ 1.37%
- F500 in state
- 28
Industry mix (Fortune 500 HQ in MI)
| Industry | F500 HQs | Revenue |
|---|---|---|
| Automotive Parts | 3 | $48B |
|
||
| Automotive | 2 | $372B |
|
||
| Chemicals | 1 | $45B |
|
||
| Automotive Retail | 1 | $29B |
|
||
| Healthcare / Medical Devices | 1 | $23B |
|
||
| Automotive Technology | 1 | $20B |
|
||
Price history
1 event — show timeline
- 2026-06-05 Coming Soon $350,000 MiRealSource-MiMLS
Property tax history
+2.8%/yrLatest (2025): $2,984 · +2.9% YoY. Source: county tax records.
Cash-flow waterfall
monthlySold comps — $/sqft
last 12 mo · ≤1 miLoading sold comps…