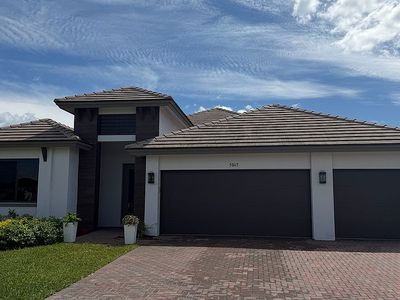
5065 Gambero Way · Ave Maria, FL
Flood risk 1/10 · Minimal
- FEMA flood zone
- AH
- Chance of flooding over 30 yrs
- 0.0%
- Est. flood insurance / yr
- $1,142 – $2,507
Fire risk 5/10 · Moderate
- Est. fire insurance / yr
- $947 – $1,759
Heat risk 9/10 · Severe
- Hot days now (above 111°F)
- 7 days/yr
- Hot days in 30 yrs
- 27 days/yr
Wind risk 10/10 · Severe
- Chance of severe wind over 30 yrs
- 99.0%
Air-quality risk 2/10 · Minimal
- Unhealthy air days now
- 0 days/yr
- Unhealthy air days in 30 yrs
- 1 days/yr
Risk factors via First Street. Map © Google.
Why this score? — see what drove the F grade
The composite is a weighted blend of 9 inputs, each scored 0–100. Each bar is that input's sub-score; the figure is the points it added to the 100-point composite (weight × sub-score).
- ARV discount +7.5/15.0
- Cash flow +6.6/30.0
- Schools +5.0/10.0
- Appreciation +4.5/10.0
- Rent growth +3.2/5.0
- Livability +2.5/5.0
- Condition / age +2.5/5.0
- 1% rule +1.7/10.0
- DSCR +0.9/10.0
$590,000
🖨 Deal sheet (PDF) 📄 Offer letter ✓ Due diligence
Listing remarks
MASSIVE PRICE DROP! $90K Unbeatable price, Own a new 4BR/3BA 3Garage Full Upgrates, floor, kitchen ceilings, lake view, FAMILY SANTUARY FOR JUST $590 In the most espectacular low cost community, the ultimate high value INVESTMENT, and the perfect place to raise your childrens, New Ave Maria Elementary School, 46-acre Collier County public school, is scheduled to open in August 2026, Perfect family secure neighborhood 1:30 Min from Miami, 20 Min to Naples, Sealling by owner so no commission fee! Just take the chance to have an excellent investment for life! Call or text directly to the owner!!!!! I& apos; m happy to assist you.
Key facts
- Built 2023
Neighborhood map
What this means for you Summary
Snapshot
- This is a 4-bed/3.0-bath single-family listed at $590k.
Deal economics
- At list price, monthly cash flow is $-1k ($-13k/yr) — negative.
- To cash-flow at today's rent, offer at most $393k (33.4% below list).
- To meet the 1% rule (rent ≥ 1% of price), the offer needs to be $394k (33.2% below list).
- Recommended offer: $393k (33.4% below list) — sets the bar for cash-flow.
Location & tenants
- Location reads: area grade F — affects rentability + tenant quality, not the cash-flow math above.
- Collier (suburban): math 60% / reading 56% proficiency, ranked #16 of 73 in FL (top 22%) — acceptable for families but not a draw, mixed tenant base, ~2y average lease.
- Zoned schools: Estates Elementary School (math 70% / reading 67%, grade B+, #409 of 2,144 statewide, top 20%, 862 students, 53% FRL); Corkscrew Middle School (math 68% / reading 59%, grade B+, #109 of 571 statewide, top 19%, 958 students, 43% FRL); Palmetto Ridge High School (math 43% / reading 51%, grade D-, #207 of 667 statewide, top 32%, 2,347 students, 38% FRL).
- Market conditions: Rents rising (+3.0%/yr); 453 active listings in the ZIP; 40 comparable units currently listed for rent nearby; rentals at typical pace (median 25d on market — plan ~3-4 weeks tenant-placement turnaround); 3,520 units permitted in Collier County in 2024 (959 in 5+ unit buildings).
- At $3,939/mo this rent would consume 76% of the median local household income ($62k/yr) (locally 1093% of renters already pay >50% of income on rent) — very limited rent-growth headroom before tenants either downsize or default.
Forward outlook
- Local home prices are declining (-1.1%/yr); year-one equity from $4k of loan paydown is wiped out by about $6k of value loss. Plan a longer hold.
- Collier County population projected at +30% by 2050 — long-run rental-demand tailwind backs the buy-and-hold thesis.
Negotiation context
- Only 1 days on market — expect competitive offers; lowballing is unlikely to land.
- 7 sale attempts since 3y ago; this cycle's ask is 18054% above the opening price — seller raised mid-cycle; expect resistance to lowballs.
Risks & watch-outs
- Watch-outs: flood insurance adds $152/mo.
- Climate carrying-cost: in FEMA flood zone AH (mandatory federal flood insurance); severe wind risk, 99% chance of damaging wind over 30y; moderate wildfire risk; extreme-heat days projected 7→27/yr by 2055 (HVAC capex compounding) — expect insurance premiums to compound above CPI over the hold.
Questions for the listing agent
- What do current leases actually rent for vs. the listed asking? Can we see a recent rent roll and the last 12 months of T-12 income?
- What's the actual annual flood-insurance premium (NFIP or private), and is the property in a SFHA with mandatory coverage?
- Is there a deadline driving the sale (1031 exchange, divorce, estate, relocation)? That informs how much negotiation room exists.
- The area grade is low — what's the realistic commute time and amenity access for the typical tenant pool here? Any planned neighborhood developments (good or bad) we should know about?
- What's the average days-on-market for RENTAL listings here right now (not sales)? A rising rental-DOM trend means longer vacancies and softer asking-rent achievability than the comps imply.
- What's the recent tenant-quality profile in this submarket — average credit score on applications, eviction rate, late-payment / NSF rate, and stable-employment percentage? A property-management company in the area should have these aggregated.
- How much new for-sale + rental construction is in the pipeline within 1–3 miles? Heavy new supply typically softens prices + rents 12–24 months out; constrained supply supports both.
Investment metrics
- 1% rule
- 0.67% ✗
- Cap rate
- 4.33%
- Cash-on-cash
- -7.00%
- DSCR
- 0.69
- GRM
- 12.5
CMA / ARV
No comps found within radius.
Projected returns pro-forma
-1.05% appreciation · 2.95% rent growth · sell at horizon
- IRR
- -16.7%
- Equity multiple
- 0.29×
- Total profit
- $-116,791
- Equity at exit
- $141,054
- IRR
- -10.1%
- Equity multiple
- 0.11×
- Total profit
- $-146,630
- Equity at exit
- $146,958
Cash invested: $165,200 (down + closing). Projections, not guarantees.
Landlord ↔ Tenant lean methodology
- Overall (STATE)
- 87 Strongly Landlord-Friendly
- State Florida
- 87 Strongly Landlord-Friendly · R+3
- County
- — inherits STATE
- City
- — inherits STATE
ZIP-level market 34142
- Home prices YoY
- -0.5%
- Rents YoY
- 3.0%
- Active inventory
- 453
- Price-to-rent
- 12.5×
Monthly cashflow live
- Estimated rent
- $3,939 high interval (Pro) →
- Mortgage (P&I)
- −$3,094
- Tax from tax record
- −$735 /mo · $8,822/yr
- Insurance
- −$246
- Flood insurance flood zone
- −$152 /mo · $1,824/yr
- HOA
- −$0
- Vacancy / Maint / Mgmt
- −$827
- Net cashflow
- $-1,115
Break-even live
Sensitivity live
| Price | -10% $-781 | -5% $-948 | +0% $-1,115 | +5% $-1,282 | +10% $-1,449 |
|---|---|---|---|---|---|
| Rent | -10% $-1,427 | -5% $-1,271 | +0% $-1,115 | +5% $-960 | +10% $-804 |
| Rate | -1.0pp $-818 | -0.5pp $-965 | base $-1,115 | +0.5pp $-1,268 | +1.0pp $-1,424 |
UW: 25.0% down · 7.5% · 30yr · 1.5% tax · 5.0% vac · 8.0% maint · 8.0% mgmt
Financing live
Cash to close
- Down payment
- $147,500
- Closing costs
- $17,700
- Reserves months
- —
- Total cash needed
- —
Loan-product check · same deal, 3 products live
Conventional
25% down · 7.5% · 30yr
- Down + closing
- —
- Monthly P&I
- —
- Monthly cashflow
- —
- DSCR
- —
- Eligible?
- —
Personal DTI + credit; lowest rate.
DSCR
20% down · 8.5% · 30yr
- Down + closing
- —
- Monthly P&I
- —
- Monthly cashflow
- —
- DSCR
- —
- Eligible?
- —
No personal income docs; deal must DSCR.
Hard money
10% down · 12.0% · 12mo
- Down + closing
- —
- Monthly P&I
- —
- Monthly cashflow
- —
- DSCR
- —
- Eligible?
- —
Short-term bridge; refi at stabilization.
Rent comps 40 comps
| Address | Beds | Baths | Sqft | Rent | $/sqft | DOM | Units | Dist |
|---|---|---|---|---|---|---|---|---|
| 5065 Gambero Way Ave Maria, FL | 4.0 | 3.0 | 2557 | $3,250 | $1.27 | 22d | 1 | 0.04mi |
| 5039 Frattina St Ave Maria, FL | 3.0 | 3.0 | 2341 | $5,995 | $2.56 | 25d | 1 | 0.06mi |
| 5077 Gambero Way Ave Maria, FL | 4.0 | 3.0 | 2256 | $3,950 | $1.75 | 25d | 1 | 0.07mi |
| 5013 Florence Dr Ave Maria, FL | 3.0 | 2.5 | 2256 | $2,900 | $1.29 | 25d | 1 | 0.13mi |
| 5089 Penella Ave Ave Maria, FL | 3.0 | 2.5 | 2028 | $2,300 | $1.13 | 15d | 1 | 0.19mi |
| 5166 Julienne Rd Ave Maria, FL | 4.0 | 3.0 | 3330 | $3,600 | $1.08 | 25d | 1 | 0.21mi |
| 5114 Penella Ave Ave Maria, FL | 4.0 | 3.0 | 2599 | $3,195 | $1.23 | 22d | 1 | 0.26mi |
| 5243 Nevola Ave Ave Maria, FL | 4.0 | 4.0 | 3522 | $3,800 | $1.08 | 25d | 1 | 0.27mi |
| 5126 Penella Ave Ave Maria, FL | 4.0 | 3.5 | 3522 | $4,000 | $1.14 | 22d | 1 | 0.29mi |
| 4919 Frattina St Ave Maria, FL | 4.0 | 3.0 | 2350 | $3,300 | $1.40 | 25d | 1 | 0.31mi |
| 5285 Marano Dr Ave Maria, FL | 3.0 | 2.5 | 2256 | $2,600 | $1.15 | 25d | 1 | 0.35mi |
| 5120 Nevola Ave Ave Maria, FL | 4.0 | 3.0 | 2273 | $3,500 | $1.54 | 13d | 1 | 0.36mi |
| 5286 Nevola Ave Ave Maria, FL | 3.0 | 2.5 | 3330 | $2,995 | $0.90 | 25d | 1 | 0.37mi |
| 5293 Marano Dr Ave Maria, FL | 3.0 | 2.5 | 2256 | $3,400 | $1.51 | 22d | 1 | 0.37mi |
| 5414 Espada Ct Ave Maria, FL | 3.0 | 3.0 | 2799 | $10,995 | $3.93 | 22d | 1 | 0.38mi |
| 5538 Hampton Links Ct Ave Maria, FL | 3.0 | 3.0 | 2247 | $6,295 | $2.80 | 22d | 1 | 0.40mi |
| 5545 Hampton Links Ct #5545 Ave Maria, FL | 4.0 | 3.0 | 2400 | $9,000 | $3.75 | 25d | 1 | 0.40mi |
| 5545 Hampton Links Ct Ave Maria, FL | 4.0 | 3.0 | 2247 | $8,500 | $3.78 | 25d | 1 | 0.40mi |
| 4881 Gambero Way Ave Maria, FL | 3.0 | 2.5 | 2037 | $2,800 | $1.37 | 12d | 1 | 0.42mi |
| 5412 Fancourt Links Way Ave Maria, FL | 4.0 | 3.0 | 2247 | $8,000 | $3.56 | 22d | 1 | 0.43mi |
| 5322 Nevola Ave Ave Maria, FL | 3.0 | 3.0 | 1918 | $2,700 | $1.41 | 15d | 1 | 0.44mi |
| 4843 Frattina St Ave Maria, FL | 4.0 | 3.0 | 2588 | $3,300 | $1.28 | 25d | 1 | 0.45mi |
| 5428 Fancourt Links Way Ave Maria, FL | 3.0 | 3.0 | 2247 | $7,895 | $3.51 | 22d | 1 | 0.48mi |
| 5104 Salerno St Ave Maria, FL | 4.0 | 3.0 | 2341 | $5,595 | $2.39 | 25d | 1 | 0.50mi |
| 5444 Fancourt Links Way Ave Maria, FL | 3.0 | 3.0 | 2247 | $3,995 | $1.78 | 22d | 1 | 0.52mi |
| 5674 Melbourne Ct Unit 7721 Ave Maria, FL | 3.0 | 2.0 | 2110 | $7,295 | $3.46 | 13d | 1 | 0.54mi |
| 5680 Melbourne Ct #7521 Ave Maria, FL | 3.0 | 2.0 | 2110 | $2,650 | $1.26 | 4d | 1 | 0.56mi |
| 5265 Messina St Ave Maria, FL | 3.0 | 2.5 | 1929 | $4,995 | $2.59 | 25d | 1 | 0.63mi |
| 5226 Ferrari Ave Ave Maria, FL | 3.0 | 2.5 | 3086 | $3,400 | $1.10 | 25d | 1 | 0.63mi |
| 5515 Whistling Straights Ct Ave Maria, FL | 3.0 | 2.5 | 2419 | $6,500 | $2.69 | 22d | 1 | 0.64mi |
| 5728 Oakmont Ct Ave Maria, FL | 3.0 | 2.0 | 2110 | $3,995 | $1.89 | 13d | 1 | 0.69mi |
| 5722 Oakmont Ct Ave Maria, FL | 3.0 | 2.0 | 2110 | $3,995 | $1.89 | 13d | 1 | 0.70mi |
| 5374 Ferris Ave Ave Maria, FL | 3.0 | 2.5 | 1933 | $2,350 | $1.22 | 25d | 1 | 0.71mi |
| 5169 Roma St Ave Maria, FL | 4.0 | 3.0 | 2874 | $5,995 | $2.09 | 25d | 1 | 0.77mi |
| 4546 Battlecreek Way Ave Maria, FL | 3.0 | 2.5 | 2104 | $3,900 | $1.85 | 25d | 1 | 0.83mi |
| 5476 Katia Ct Ave Maria, FL | 3.0 | 2.5 | 1983 | $4,300 | $2.17 | 25d | 1 | 0.86mi |
| 5856 Sunningdale St Ave Maria, FL | 4.0 | 3.0 | 2247 | $8,995 | $4.00 | 25d | 1 | 0.88mi |
| 5309 Beckton Rd Ave Maria, FL | 3.0 | 2.5 | 2051 | $2,395 | $1.17 | 25d | 1 | 0.95mi |
| 5938 Berwick Ln Ave Maria, FL | 3.0 | 3.0 | 2247 | $10,995 | $4.89 | 25d | 1 | 0.97mi |
| 5937 Berwick Ln Ave Maria, FL | 3.0 | 2.0 | 2061 | $4,995 | $2.42 | 25d | 1 | 1.00mi |
Listing history 20 events
-
2026-05-13$3,250
-
2026-04-28soldstatus $531,000
-
2026-03-09historical
-
2026-01-30price $659,900
-
2026-01-22$690,000 Active
-
2024-09-03historical
-
2024-08-28price $670,000
-
2024-08-09price $700,000
-
2024-06-12$730,000 Active
-
2024-02-16historical
-
2024-01-18price $800,000
-
2023-12-28price $830,000
-
2023-12-16$860,000 Active
-
2023-11-13historical
-
2023-10-18price $800,000
-
2023-10-18price $800,000
-
2023-10-18price $800,000
-
2023-08-17$900,000 Active
-
2023-08-17$900,000 Active
-
2023-08-03$900,000 Active
ⓘ Source: listings_history table (triggers on properties + properties_extension) + one-shot
backfill from property_details.listing_events for pre-trigger history.
Tax reassessment forecast FL · Resets to sale price
- Current annual tax
- $8,822 · $735/mo
- Projected year-2 tax
- $8,822 · $735/mo
- Expected delta
- $0/yr ($0/mo · 0.0%)
ⓘ Screening estimate from a state-policy table — verify with the county assessor before closing.
Climate risk First Street
- Flood 1/10 Low FEMA zone AH · 0% chance over 30 yrs
- Wildfire 5/10 Major
- Heat 9/10 Extreme 7 d/yr ≥111°F today · 27 d/yr by 30 yrs out
- Wind 10/10 Extreme 99% chance of damaging wind over 30 yrs
- Air quality 2/10 Low 0 unhealthy d/yr today · 1 by 30 yrs out
Nearby sold comps map
Loading sold comps map…
Walkable amenities ~0.75 mi
Loading nearby amenities…
Taxation est. · year 1
- Rental income
- $47,267
- − Mortgage interest
- −$33,049
- − Property taxes
- −$8,822
- − Insurance
- −$4,774
- − Repairs & maintenance
- −$3,781
- − Management
- −$3,781
- − Depreciation
- −$17,164
- Taxable loss
- −$24,105
- Est. tax savings @ 24.0%
- +$5,785
- After-tax cash flow
- $-7,599/yr
For passive investors: Depreciation is non-cash, so a rental often shows a tax loss while cash-flowing — sheltering income. Rental losses are passive: they offset passive income freely, and up to $25,000/yr can offset ordinary (W-2) income if you actively participate and your MAGI is under $100k (phasing out to $0 by $150k); unused losses carry forward. On sale, claimed depreciation is recaptured at up to 25%, and gains may owe capital-gains tax (a 1031 exchange can defer both). Figures are a year-1 estimate at your 24.0% rate — not tax advice; consult a CPA.
Schools (NCES district)
- District
- Collier
- NCES district ID
- 1200330
- Math proficiency
- 60% ▼ -4.00%
- Reading proficiency
- 56% ▼ -2.00%
- Median HH income
- $58,275
- Composite
- 50.23/100
- National rank
- #1892
- State rank
- #16 of 73 in FL
Livability — Ave Maria
No livability data for this city. (Only ~50 U.S. cities are tracked.)
Census & demographics
- Census place
- Ave Maria, FL
- County
- Collier County · 396,295 people
- Metro
- Naples-Marco Island, FL
- Population (ZIP)
- 35,149
- Household income
- $62,333
- Rent vs Own
- Severe rent burden
- 1093.0
Population outlook (Collier County) Hauer SSP2
- Today (2025)
- 420,858 people
- By 2030
- 450,054 · +6.9%
- By 2040
- 502,232 · +19.3%
- By 2050
- 544,932 · +29.5%
- By 2075
- 627,203 · +49.0%
- By 2100
- 659,015 · +56.6%
Race, ethnicity, and origin ACS 2023
- Neighborhood character
- Majority Hispanic (63%)
- Race & ethnicity
- Hispanic / Latino 63% Two or more races 39% Black 19% White 16% Native American 7%
- Hispanic origin (detail)
- Mexican 43% Puerto Rican 3% Cuban 2% Dominican 1%
- Common ancestry
- Hispanic 8% Slovak 1% Serbian 1%
- Foreign-born
- 32% · Canada, Jamaica
- Languages at home
- 34% English-only · Spanish 53% French/Haitian/Cajun 12%
Political lean MEDSL · Collier
- 2024 margin
- Solid R (+33.1) · D 33.1% · R 66.2%
- 2008→2024 swing
- -10.6pp toward R · 2008: -22.5pp · 2024: -33.1pp
- All cycles
- 2024: R+33.1 2020: R+24.7 2016: R+26.0 2012: R+30.1 2008: R+22.5
Not yet ingested
- Civics
- —
Market trends
- HPI YoY
- ▼ -1.05%
- Current HPI
- 226.9105
- Rent YoY
- ▲ 2.95%
- Metro
- Naples-Marco Island, FL
- State GDP YoY
- ▲ 3.28%
- F500 in state
- 36
Industry mix (Fortune 500 HQ in FL)
| Industry | F500 HQs | Revenue |
|---|---|---|
| Industrial Technology | 2 | $29B |
|
||
| Insurance | 2 | $17B |
|
||
| Retail | 1 | $60B |
|
||
| Technology Distribution | 1 | $58B |
|
||
| Homebuilding | 1 | $35B |
|
||
| Technology Manufacturing | 1 | $35B |
|
||
Price history
-99.6% since first listed20 events — show timeline
- 2026-05-13 Listed for Rent $3,250 NAPLESMLS
- 2026-04-28 Sold (Public Records) $531,000 Public Records
- 2026-03-09 Listing Removed — MARMLS
- 2026-01-30 Price Changed $659,900 MARMLS
- 2026-01-22 Listed $690,000 MARMLS
- 2024-09-03 Listing Removed — NAPLESMLS
- 2024-08-28 Price Changed $670,000 NAPLESMLS
- 2024-08-09 Price Changed $700,000 NAPLESMLS
- 2024-06-12 Listed $730,000 NAPLESMLS
- 2024-02-16 Listing Removed — NAPLESMLS
- 2024-01-18 Price Changed $800,000 NAPLESMLS
- 2023-12-28 Price Changed $830,000 NAPLESMLS
- 2023-12-16 Listed $860,000 NAPLESMLS
- 2023-11-13 Listing Removed — NAPLESMLS
- 2023-10-18 Price Changed $800,000 NAPLESMLS
- 2023-10-18 Price Changed $800,000 MIML
- 2023-10-18 Price Changed $800,000 MARMLS
- 2023-08-17 Listed $900,000 MIML
- 2023-08-17 Listed $900,000 NAPLESMLS
- 2023-08-03 Listed $900,000 MARMLS
Property tax history
+62.2%/yrLatest (2025): $8,822 · +5.2% YoY. Source: county tax records.
Cash-flow waterfall
monthlySold comps — $/sqft
last 12 mo · ≤1 miLoading sold comps…