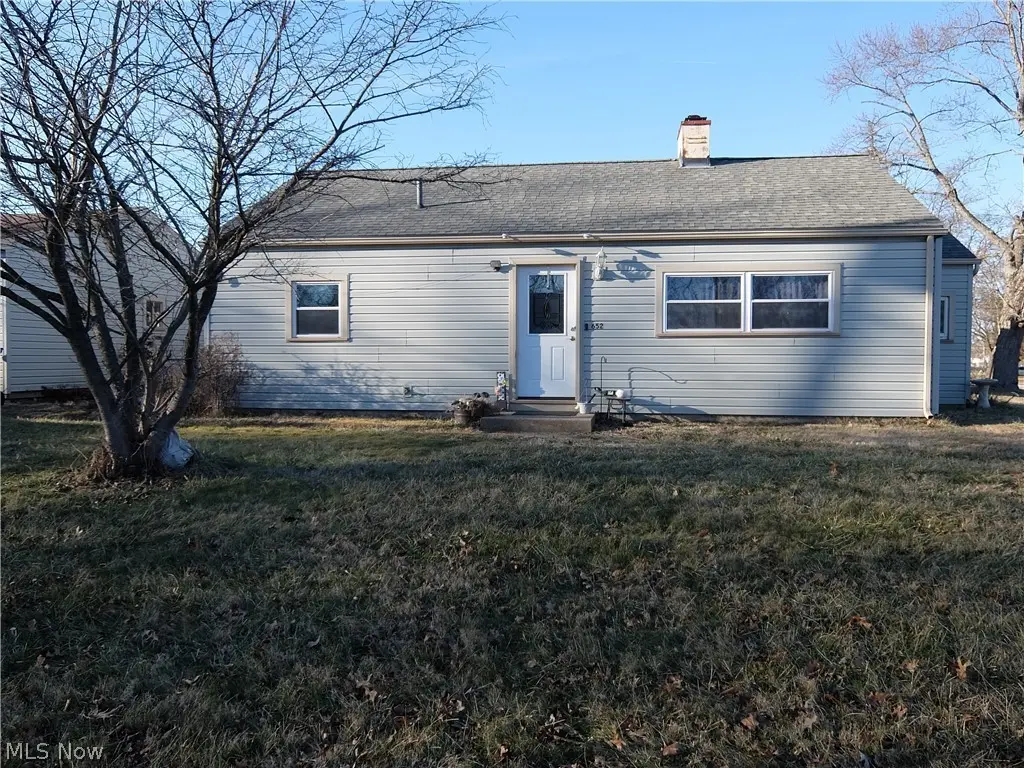
652 Ohio Ave · McDonald, OH
Flood risk 1/10 · Minimal
- FEMA flood zone
- X (unshaded)
- Chance of flooding over 30 yrs
- 0.0%
- Est. flood insurance / yr
- $507 – $1,088
Fire risk 1/10 · Minimal
- Est. fire insurance / yr
- $713 – $1,323
Heat risk 3/10 · Minor
- Hot days now (above 98°F)
- 7 days/yr
- Hot days in 30 yrs
- 18 days/yr
Wind risk 1/10 · Minimal
- Chance of severe wind over 30 yrs
- —
Air-quality risk 3/10 · Minor
- Unhealthy air days now
- 1 days/yr
- Unhealthy air days in 30 yrs
- 4 days/yr
Risk factors via First Street. Map © Google.
Why this score? — see what drove the B+ grade
The composite is a weighted blend of 9 inputs, each scored 0–100. Each bar is that input's sub-score; the figure is the points it added to the 100-point composite (weight × sub-score).
- Cash flow +29.7/30.0
- ARV discount +15.0/15.0
- DSCR +10.0/10.0
- 1% rule +8.2/10.0
- Schools +5.3/10.0
- Livability +3.6/5.0
- Rent growth +2.5/5.0
- Condition / age +2.5/5.0
- Appreciation +0.0/10.0
$89,900
🖨 Deal sheet (PDF) 📄 Offer letter ✓ Due diligence
Listing remarks
Village Living with tons of Potential! Discover the convenience of life in the village with this 3-bedroom ranch. Perfectly situated on a low-maintenance corner lot, this home offers the ease of single-story living. While the interior is ready for your creative repairs and updates, the exterior features durable vinyl siding and a massive 2-car garage—a rare find for a village property! Perfect for those looking to build equity in a charming, established community.
Key facts
- Durable vinyl siding
- Single-story living
- Massive 2-car garage
Tags
Neighborhood map
What this means for you Summary
Snapshot
- This is a 3-bed/1.0-bath single-family listed at $90k.
Deal economics
- At list price, monthly cash flow is $329 ($4k/yr) — positive.
- The deal already cash-flows at list — no discount required.
- Meets the 1% rule at list price ($1k rent vs $90k).
Location & tenants
- Location reads 72/100 on livability (#376 in OH) — a middle-class / working-renter tenant base. Strengths: cost of living A+, housing A+, crime A; Watch: amenities F, commute F, health & safety F.
- Mcdonald Local (suburban): math 57% / reading 67% proficiency, ranked #259 of 656 in OH (top 40%) — acceptable for families but not a draw, mixed tenant base, ~2y average lease.
- Zoned schools: Roosevelt Elementary School (math 58% / reading 65%, grade B, #646 of 1,584 statewide, top 41%, 396 students, 42% FRL); Mcdonald High School (math 57% / reading 67%, grade B-, #202 of 781 statewide, top 29%, 349 students, 64% FRL) — zoned schools average 53% FRL vs 27% district-wide (26 pts higher); higher-poverty schools than district average — tighter screening recommended.
- Market conditions: 23 active listings in the ZIP; 4 comparable units currently listed for rent nearby; rentals at typical pace (median 15d on market — plan ~3-4 weeks tenant-placement turnaround); 129 units permitted in Trumbull County in 2024 (0 in 5+ unit buildings).
Forward outlook
- Local home prices are declining (-3.0%/yr); year-one equity from $622 of loan paydown is wiped out by about $3k of value loss. Plan a longer hold.
- Trumbull County population projected at -22% by 2050 — secular population decline; favor cash flow + early exit over multi-decade hold.
- At projected returns (-3.0% appreciation + 3.0% rent growth), your $25k cash investment doubles in ~8 years — after that, you're playing with house money.
Negotiation context
- Only 2 days on market — expect competitive offers; lowballing is unlikely to land.
- Current owner paid $36k; list at $90k implies a 150% gain — meaningful room to come down on a strong offer.
Risks & watch-outs
- Watch-outs: built in 1950 — expect roof / HVAC / electrical / plumbing capex.
Questions for the listing agent
- Built in 1950 — when were the roof, HVAC, electrical panel, plumbing, and water heater last replaced?
- Is there a deadline driving the sale (1031 exchange, divorce, estate, relocation)? That informs how much negotiation room exists.
- Schools are A-rated — typically a magnet for longer-tenancy family renters. What's the average tenant stay here, and is there a school-zone premium baked into asking?
- What's the average days-on-market for RENTAL listings here right now (not sales)? A rising rental-DOM trend means longer vacancies and softer asking-rent achievability than the comps imply.
- What's the recent tenant-quality profile in this submarket — average credit score on applications, eviction rate, late-payment / NSF rate, and stable-employment percentage? A property-management company in the area should have these aggregated.
- How much new for-sale + rental construction is in the pipeline within 1–3 miles? Heavy new supply typically softens prices + rents 12–24 months out; constrained supply supports both.
Investment metrics
- 1% rule
- 1.32% ✓
- Cap rate
- 10.68%
- Cash-on-cash
- 15.66%
- DSCR
- 1.70
- GRM
- 6.3
CMA / ARV
- ARV (on-the-fly)
- $128,436
- Comps found
- 11
Show comp detail 11 sales within ~0.75 mi
| Address | Dist | Beds/Ba | Sqft | Sold | Price | $/sf | Match |
|---|---|---|---|---|---|---|---|
| 652 Ohio Ave | 0.00mi | 3/1.0 | 924 (0%) | 0mo | $87,250 | $94 | 100 |
| 648 Indiana Ave | 0.06mi | 3/1.0 | 864 (-6%) | 14mo | $120,000 | $139 | 74 |
| 350 Grant St | 0.37mi | 2/1.0 (-1) | 943 (+2%) | 7mo | $134,000 | $142 | 68 |
| 3117 Youngstown Ave | 0.47mi | 2/1.0 (-1) | 900 (-3%) | 8mo | $130,000 | $144 | 62 |
| 719 Ohio Ave | 0.06mi | 3/1.0 | 1,044 (+13%) | 17mo | $174,000 | $167 | 62 |
| 1015 Annabelle St | 0.48mi | 3/1.5 | 960 (+4%) | 12mo | $170,000 | $177 | 59 |
| 1144 Logan Ave | 0.67mi | 3/1.0 | 996 (+8%) | 6mo | $150,000 | $151 | 51 |
| 300 Hayes Ave | 0.48mi | 2/1.0 (-1) | 864 (-6%) | 15mo | $95,000 | $110 | 50 |
| 426 Garfield | 0.37mi | 2/1.0 (-1) | 822 (-11%) | 12mo | $85,000 | $103 | 49 |
| 310 Hayes | 0.46mi | 2/1.0 (-1) | 832 (-10%) | 16mo | $91,600 | $110 | 44 |
| 312 Hayes | 0.46mi | 2/1.0 (-1) | 1,001 (+8%) | 20mo | $95,500 | $95 | 43 |
Match score weights: distance 35% · size 25% · config 20% · recency 20%. Top-matched comps best support the ARV.
Projected returns pro-forma
-3.0% appreciation · 3.0% rent growth · sell at horizon
- IRR
- 6.5%
- Equity multiple
- 1.25×
- Total profit
- $6,365
- Equity at exit
- $13,404
- IRR
- 15.9%
- Equity multiple
- 2.29×
- Total profit
- $32,522
- Equity at exit
- $7,773
Cash invested: $25,172 (down + closing). Projections, not guarantees.
Landlord ↔ Tenant lean methodology
- Overall (STATE)
- 73 Landlord-Friendly
- State Ohio
- 73 Landlord-Friendly · R+6
- County
- — inherits STATE
- City
- — inherits STATE
ZIP-level market 44437
- Home prices YoY
- -7.8%
- Active inventory
- 23
- Price-to-rent
- 6.3×
Monthly cashflow live
- Estimated rent
- $1,185 medium interval (Pro) →
- Mortgage (P&I)
- −$471
- Tax from tax record
- −$98 /mo · $1,181/yr
- Insurance
- −$37
- HOA
- −$0
- Vacancy / Maint / Mgmt
- −$249
- Net cashflow
- $329
Break-even live
Sensitivity live
| Price | -10% $379 | -5% $354 | +0% $329 | +5% $303 | +10% $278 |
|---|---|---|---|---|---|
| Rent | -10% $235 | -5% $282 | +0% $329 | +5% $375 | +10% $422 |
| Rate | -1.0pp $374 | -0.5pp $351 | base $329 | +0.5pp $305 | +1.0pp $282 |
UW: 25.0% down · 7.5% · 30yr · 1.5% tax · 5.0% vac · 8.0% maint · 8.0% mgmt
Financing live
Cash to close
- Down payment
- $22,475
- Closing costs
- $2,697
- Reserves months
- —
- Total cash needed
- —
Loan-product check · same deal, 3 products live
Conventional
25% down · 7.5% · 30yr
- Down + closing
- —
- Monthly P&I
- —
- Monthly cashflow
- —
- DSCR
- —
- Eligible?
- —
Personal DTI + credit; lowest rate.
DSCR
20% down · 8.5% · 30yr
- Down + closing
- —
- Monthly P&I
- —
- Monthly cashflow
- —
- DSCR
- —
- Eligible?
- —
No personal income docs; deal must DSCR.
Hard money
10% down · 12.0% · 12mo
- Down + closing
- —
- Monthly P&I
- —
- Monthly cashflow
- —
- DSCR
- —
- Eligible?
- —
Short-term bridge; refi at stabilization.
Rent comps 4 comps
| Address | Beds | Baths | Sqft | Rent | $/sqft | DOM | Units | Dist |
|---|---|---|---|---|---|---|---|---|
| 701 Summit Ave Niles, OH | 2.0 | 1.0–2.0 | 963 | $1,220 | $1.27 | 15d | 1 | 1.31mi |
| 311 S Market St Girard, OH | 2.0 | 1.0 | 672 | $1,075 | $1.60 | 45d | 1 | 1.33mi |
| 135 E Broadway Ave Girard, OH | 2.0 | 1.0 | 1120 | $995 | $0.89 | 15d | 1 | 1.37mi |
| 848 Lawrence Ave Girard, OH | 3.0 | 1.0 | 950 | $1,400 | $1.47 | 15d | 1 | 1.41mi |
Listing history 4 events
-
2026-04-18status Pending
-
2026-04-15$89,900 Active
-
1992-05-28soldstatus $36,000
-
1988-01-12soldstatus $24,500
ⓘ Source: listings_history table (triggers on properties + properties_extension) + one-shot
backfill from property_details.listing_events for pre-trigger history.
Tax reassessment forecast OH · Partial reset (capped growth)
- Current annual tax
- $1,181 · $98/mo
- Projected year-2 tax
- $1,292 · $108/mo
- Expected delta
- +$111/yr (+$9/mo · 9.4%)
ⓘ Screening estimate from a state-policy table — verify with the county assessor before closing.
Climate risk First Street
- Flood 1/10 Low FEMA zone X (unshaded) · 0% chance over 30 yrs
- Wildfire 1/10 Low
- Heat 3/10 Moderate 7 d/yr ≥98°F today · 18 d/yr by 30 yrs out
- Wind 1/10 Low
- Air quality 3/10 Moderate 1 unhealthy d/yr today · 4 by 30 yrs out
Nearby sold comps map
Loading sold comps map…
Walkable amenities ~0.75 mi
Loading nearby amenities…
Taxation est. · year 1
- Rental income
- $14,215
- − Mortgage interest
- −$5,036
- − Property taxes
- −$1,181
- − Insurance
- −$450
- − Repairs & maintenance
- −$1,137
- − Management
- −$1,137
- − Depreciation
- −$2,615
- Taxable income
- $2,659
- Est. tax owed @ 24.0%
- −$638
- After-tax cash flow
- $3,304/yr
For passive investors: Depreciation is non-cash, so a rental often shows a tax loss while cash-flowing — sheltering income. Rental losses are passive: they offset passive income freely, and up to $25,000/yr can offset ordinary (W-2) income if you actively participate and your MAGI is under $100k (phasing out to $0 by $150k); unused losses carry forward. On sale, claimed depreciation is recaptured at up to 25%, and gains may owe capital-gains tax (a 1031 exchange can defer both). Figures are a year-1 estimate at your 24.0% rate — not tax advice; consult a CPA.
Schools (NCES district)
- District
- Mcdonald Local
- NCES district ID
- 3905022
- Math proficiency
- 57% ▼ -20.00%
- Reading proficiency
- 67% ▼ -11.00%
- Median HH income
- $49,637
- Composite
- 52.66/100
- National rank
- #1554
- State rank
- #259 of 656 in OH
Livability — McDonald
- Score
- 72/100
- State rank
- #376
- US rank
- #6131
Category grades
Schools grade is shown separately in the Schools card above.
Census & demographics
- Census place
- McDonald, OH
- County
- Trumbull · 193,293 people
- City population
- 3,900
- Metro
- Youngstown-Warren, OH
- Population (ZIP)
- 3,900
- Household income
- $72,545
- Rent vs Own
Population outlook (Trumbull County) Hauer SSP2
- Today (2025)
- 191,696 people
- By 2030
- 184,015 · -4.0%
- By 2040
- 166,810 · -13.0%
- By 2050
- 149,857 · -21.8%
- By 2075
- 115,769 · -39.6%
- By 2100
- 83,617 · -56.4%
Race, ethnicity, and origin ACS 2023
- Neighborhood character
- Predominantly White (98%)
- Race & ethnicity
- White 98% Two or more races 2%
- Common ancestry
- Romanian 7% Scotch-Irish 2% Subsaharan African 2%
- Foreign-born
- 1%
- Languages at home
- 96% English-only · Other Indo-European 3% Spanish 1%
Political lean MEDSL · Trumbull
- 2024 margin
- R (+16.8) · D 41.2% · R 58.0%
- 2008→2024 swing
- -39.2pp toward R · 2008: 22.4pp · 2024: -16.8pp
- All cycles
- 2024: R+16.8 2020: R+10.6 2016: R+6.4 2012: D+22.2 2008: D+22.4
Not yet ingested
- Civics
- —
Market trends
- HPI YoY
- ▼ -20.52%
- Current HPI
- 241.8126
- Rent YoY
- —
- Metro
- —
- State GDP YoY
- ▲ 1.98%
- F500 in state
- 48
Industry mix (Fortune 500 HQ in OH)
| Industry | F500 HQs | Revenue |
|---|---|---|
| Insurance | 3 | $145B |
|
||
| Industrial Machinery | 3 | $49B |
|
||
| Financial Services | 3 | $24B |
|
||
| Consumer Goods | 2 | $93B |
|
||
| Aerospace / Defense | 2 | $47B |
|
||
| Utilities | 2 | $33B |
|
||
Price history
+266.9% since first listed4 events — show timeline
- 2026-04-18 Pending — MLSNOW
- 2026-04-15 Listed $89,900 MLSNOW
- 1992-05-28 Sold (Public Records) $36,000 Public Records
- 1988-01-12 Sold (Public Records) $24,500 Public Records
Property tax history
+3.2%/yrLatest (2025): $1,181 · +0.5% YoY. Source: county tax records.
Cash-flow waterfall
monthlySold comps — $/sqft
last 12 mo · ≤1 miLoading sold comps…