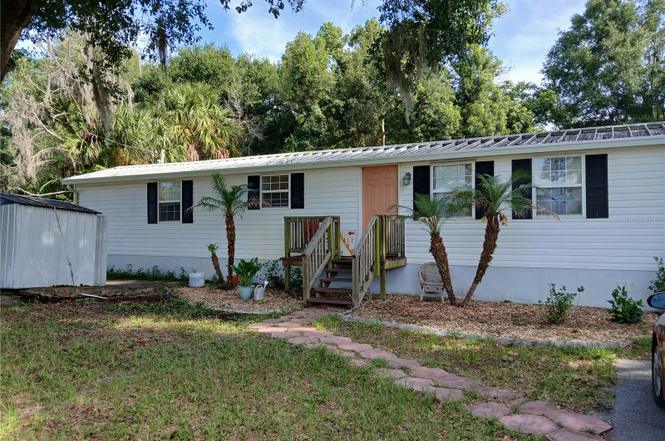
10429 E Victory Ln · Inverness, FL
Flood risk 1/10 · Minimal
- FEMA flood zone
- X (shaded)
- Chance of flooding over 30 yrs
- 0.0%
- Est. flood insurance / yr
- $507 – $1,088
Fire risk 5/10 · Moderate
- Est. fire insurance / yr
- $947 – $1,759
Heat risk 9/10 · Severe
- Hot days now (above 107°F)
- 7 days/yr
- Hot days in 30 yrs
- 23 days/yr
Wind risk 9/10 · Severe
- Chance of severe wind over 30 yrs
- 99.0%
Air-quality risk 2/10 · Minimal
- Unhealthy air days now
- 2 days/yr
- Unhealthy air days in 30 yrs
- 2 days/yr
Risk factors via First Street. Map © Google.
Why this score? — see what drove the C grade
The composite is a weighted blend of 9 inputs, each scored 0–100. Each bar is that input's sub-score; the figure is the points it added to the 100-point composite (weight × sub-score).
- Cash flow +27.6/30.0
- DSCR +9.7/10.0
- 1% rule +7.5/10.0
- Schools +4.1/10.0
- Livability +3.4/5.0
- Rent growth +2.5/5.0
- Condition / age +2.5/5.0
- ARV discount +0.0/15.0
- Appreciation +0.0/10.0
$115,000
🖨 Deal sheet (PDF) 📄 Offer letter ✓ Due diligence
Listing remarks MLS
Come take a look at this cute home with a split floor plan. The home features 2 bedrooms and 2 full bathrooms, with the a/c upgraded to mini splits in 2017, the roof over was done in 2022 all just a few minutes from downtown Inverness where you can find lots of shopping and dining. Lake Henderson is also near downtown Inverness so bring all of your water toys.
Key facts
- Reroof
- Split floor plan
- Shed in backyard
Tags
Property features AI
Finance
- Other: Furnished status negotiable; Zoning: CLRMH
- HOA & community: No association
Exterior
- Utilities: Septic tank; Broadband/high-speed internet available; Cable available; No municipal water (none listed); One well
- Home design: Single wide mobile home; Residential property; One level; Facing south; Homestead eligible
- Construction: Vinyl siding; Metal roof; Other foundation
- Exterior features: Paved road access; Approximately 0.27-acre lot (1/4 to less than 1/2 acre)
Interior
- Kitchen: Range; Refrigerator; Dishwasher
- Bedrooms: 2 bedrooms
- Bathrooms: 2 full bathrooms
- Heating & cooling: Mini-split cooling units; Other heating
- Interior features: Living room and dining room combo; 5 total rooms
- Laundry & utility: Inside laundry; Washer; Dryer
Neighborhood map
What this means for you Summary
Snapshot
- This is a 2-bed/2.0-bath manufactured listed at $115k.
Deal economics
- At list price, monthly cash flow is $342 ($4k/yr) — positive.
- The deal already cash-flows at list — no discount required.
- Meets the 1% rule at list price ($1k rent vs $115k).
- Recommended offer: $105k (9.0% below list) — sets the bar for market timing.
- Cap rate 9.9% vs local median 4.9% in Inverness — top-decile yield for the area; either an underpriced asset or a hidden risk that comps aren't pricing in. Stress-test before assuming the spread holds.
Location & tenants
- Location reads 67/100 on livability (#564 in FL) — a middle-class / working-renter tenant base. Strengths: cost of living A+, housing A-; Watch: health & safety C-, amenities F, commute F.
- Citrus (rural): math 49% / reading 50% proficiency, ranked #44 of 73 in FL (top 60%) — families likely to look elsewhere, expect single-tenant / working-renter base with shorter leases.
- Zoned schools: Inverness Primary School (math 54% / reading 55%, grade C, #892 of 2,144 statewide, top 44%, 683 students, 65% FRL); Inverness Middle School (math 52% / reading 48%, grade C, #254 of 571 statewide, top 45%, 1,017 students, 60% FRL); Citrus High School (math 34% / reading 51%, grade F, #264 of 667 statewide, top 41%, 1,503 students, 54% FRL) — zoned schools at 60% FRL track the district average.
- Market conditions: 211 active listings in the ZIP; 2,443 units permitted in Citrus County in 2024 (0 in 5+ unit buildings).
Forward outlook
- Local home prices are declining (-3.0%/yr); year-one equity from $795 of loan paydown is wiped out by about $3k of value loss. Plan a longer hold.
- Citrus County population projected to shrink 10% by 2050 — rents likely to lag national; underwrite the cash flow, not the appreciation.
- At projected returns (-3.0% appreciation + 3.0% rent growth), your $32k cash investment doubles in ~9 years — after that, you're playing with house money.
Negotiation context
- It's been on market 114 days — a 9% lower offer ($105k) is reasonable based on typical stale-listing flexibility.
- 2 sale attempts with the ask held roughly flat each time — persistent listings suggest the price (not the market) is what's stuck; bring a comps-based counter.
Risks & watch-outs
- Climate carrying-cost: severe wind risk, 99% chance of damaging wind over 30y; moderate wildfire risk; extreme-heat days projected 7→23/yr by 2055 (HVAC capex compounding) — expect insurance premiums to compound above CPI over the hold.
Questions for the listing agent
- It's been on market 114 days. Have you received any prior offers? Is the seller open to a 9% concession, seller financing, or rate buy-down credit?
- Built in 1972 — when were the roof, HVAC, electrical panel, plumbing, and water heater last replaced?
- Why hasn't it sold? Are there any deal-killer items the seller is aware of (foundation, flood, title, zoning, code violations)?
- Is there a deadline driving the sale (1031 exchange, divorce, estate, relocation)? That informs how much negotiation room exists.
- Schools are B-rated — typically a magnet for longer-tenancy family renters. What's the average tenant stay here, and is there a school-zone premium baked into asking?
- What's the average days-on-market for RENTAL listings here right now (not sales)? A rising rental-DOM trend means longer vacancies and softer asking-rent achievability than the comps imply.
- What's the recent tenant-quality profile in this submarket — average credit score on applications, eviction rate, late-payment / NSF rate, and stable-employment percentage? A property-management company in the area should have these aggregated.
- How much new for-sale + rental construction is in the pipeline within 1–3 miles? Heavy new supply typically softens prices + rents 12–24 months out; constrained supply supports both.
Investment metrics
- 1% rule
- 1.25% ✓
- Cap rate
- 9.87%
- Cash-on-cash
- 12.76%
- DSCR
- 1.57
- GRM
- 6.7
CMA / ARV
- ARV (on-the-fly)
- $90,720
- Comps found
- 8
Show comp detail 8 sales within ~0.75 mi
| Address | Dist | Beds/Ba | Sqft | Sold | Price | $/sf | Match |
|---|---|---|---|---|---|---|---|
| 10520 E Faith Ct | 0.20mi | 2/1.0 | 708 (-2%) | 11mo | $73,900 | $104 | 75 |
| 10036 E Perch Ct | 0.59mi | 2/1.5 | 672 (-7%) | 13mo | $105,000 | $156 | 48 |
| 9932 E Perch Ct | 0.68mi | 2/1.0 | 684 (-5%) | 12mo | $90,000 | $132 | 46 |
| 10019 E Bluegill Ct | 0.57mi | 2/1.0 | 672 (-7%) | 16mo | $95,000 | $141 | 45 |
| 10129 E Bass Cir | 0.66mi | 2/1.5 | 672 (-7%) | 16mo | $75,750 | $113 | 42 |
| 10131 E Bass Cir | 0.66mi | 2/1.5 | 672 (-7%) | 16mo | $85,000 | $126 | 42 |
| 10316 E Pike Dr | 0.70mi | 2/1.0 | 660 (-8%) | 16mo | $56,000 | $85 | 36 |
| 10027 E Perch Ct | 0.59mi | 1/1.0 (-1) | 672 (-7%) | 23mo | $66,000 | $98 | 33 |
Match score weights: distance 35% · size 25% · config 20% · recency 20%. Top-matched comps best support the ARV.
Projected returns pro-forma
-3.0% appreciation · 3.0% rent growth · sell at horizon
- IRR
- 2.6%
- Equity multiple
- 1.10×
- Total profit
- $3,192
- Equity at exit
- $17,147
- IRR
- 12.2%
- Equity multiple
- 1.96×
- Total profit
- $30,945
- Equity at exit
- $9,943
Cash invested: $32,200 (down + closing). Projections, not guarantees.
Landlord ↔ Tenant lean methodology
- Overall (STATE)
- 87 Strongly Landlord-Friendly
- State Florida
- 87 Strongly Landlord-Friendly · R+3
- County
- — inherits STATE
- City
- — inherits STATE
ZIP-level market 34450
- Home prices YoY
- -18.7%
- Active inventory
- 211
- Price-to-rent
- 6.7×
Monthly cashflow live
- Estimated rent
- $1,439 medium interval (Pro) →
- Mortgage (P&I)
- −$603
- Tax est. 1.5%
- −$144 /mo · $1,725/yr
- Insurance
- −$48
- HOA
- −$0
- Vacancy / Maint / Mgmt
- −$302
- Net cashflow
- $342
Break-even live
Sensitivity live
| Price | -10% $422 | -5% $382 | +0% $342 | +5% $303 | +10% $263 |
|---|---|---|---|---|---|
| Rent | -10% $229 | -5% $286 | +0% $342 | +5% $399 | +10% $456 |
| Rate | -1.0pp $400 | -0.5pp $372 | base $342 | +0.5pp $313 | +1.0pp $282 |
UW: 25.0% down · 7.5% · 30yr · 1.5% tax · 5.0% vac · 8.0% maint · 8.0% mgmt
Financing live
Cash to close
- Down payment
- $28,750
- Closing costs
- $3,450
- Reserves months
- —
- Total cash needed
- —
Loan-product check · same deal, 3 products live
Conventional
25% down · 7.5% · 30yr
- Down + closing
- —
- Monthly P&I
- —
- Monthly cashflow
- —
- DSCR
- —
- Eligible?
- —
Personal DTI + credit; lowest rate.
DSCR
20% down · 8.5% · 30yr
- Down + closing
- —
- Monthly P&I
- —
- Monthly cashflow
- —
- DSCR
- —
- Eligible?
- —
No personal income docs; deal must DSCR.
Hard money
10% down · 12.0% · 12mo
- Down + closing
- —
- Monthly P&I
- —
- Monthly cashflow
- —
- DSCR
- —
- Eligible?
- —
Short-term bridge; refi at stabilization.
Listing history 24 events
-
2026-06-21days on market $115,000 Active 114 DOM
-
2026-06-19days on market $115,000 Active 112 DOM
-
2026-06-18days on market $115,000 Active 111 DOM
-
2026-06-17days on market $115,000 Active 110 DOM
-
2026-06-17price $115,000 Active 109 DOM
-
2026-06-16days on market $120,000 Active 109 DOM
-
2026-06-15days on market $120,000 Active 108 DOM
-
2026-06-14days on market $120,000 Active 106 DOM
-
2026-06-13days on market $120,000 Active 105 DOM
-
2026-06-09days on market $120,000 Active 102 DOM
-
2026-06-08days on market $120,000 Active 101 DOM
-
2026-06-03days on market $120,000 Active 96 DOM
-
2026-06-02days on market $120,000 Active 95 DOM
-
2026-06-01days on market $120,000 Active 94 DOM
-
2026-05-31days on market $120,000 Active 93 DOM
-
2026-05-30days on market $120,000 Active 92 DOM
-
2026-02-27$120,000 Active
Show marketing remark (363 chars)
Come take a look at this cute home with a split floor plan. The home features 2 bedrooms and 2 full bathrooms, with the a/c upgraded to mini splits in 2017, the roof over was done in 2022 all just a few minutes from downtown Inverness where you can find lots of shopping and dining. Lake Henderson is also near downtown Inverness so bring all of your water toys.
-
2026-02-27$120,000 Active 363-char remark
Show marketing remark (363 chars)
Come take a look at this cute home with a split floor plan. The home features 2 bedrooms and 2 full bathrooms, with the a/c upgraded to mini splits in 2017, the roof over was done in 2022 all just a few minutes from downtown Inverness where you can find lots of shopping and dining. Lake Henderson is also near downtown Inverness so bring all of your water toys.
-
2023-06-21soldstatus $138,000
-
2022-09-23soldstatus $78,000
-
2001-10-16soldstatus $11,000
-
1996-08-01soldstatus $5,800
-
1992-05-01soldstatus $6,000
-
1992-04-01soldstatus $5,800
ⓘ Source: listings_history table (triggers on properties + properties_extension) + one-shot
backfill from property_details.listing_events for pre-trigger history.
Climate risk First Street
- Flood 1/10 Low FEMA zone X (shaded) · 0% chance over 30 yrs
- Wildfire 5/10 Major
- Heat 9/10 Extreme 7 d/yr ≥107°F today · 23 d/yr by 30 yrs out
- Wind 9/10 Extreme 99% chance of damaging wind over 30 yrs
- Air quality 2/10 Low 2 unhealthy d/yr today · 2 by 30 yrs out
Nearby sold comps map
Loading sold comps map…
Walkable amenities ~0.75 mi
Loading nearby amenities…
Taxation est. · year 1
- Rental income
- $17,272
- − Mortgage interest
- −$6,442
- − Property taxes
- −$1,725
- − Insurance
- −$575
- − Repairs & maintenance
- −$1,382
- − Management
- −$1,382
- − Depreciation
- −$3,345
- Taxable income
- $2,422
- Est. tax owed @ 24.0%
- −$581
- After-tax cash flow
- $3,527/yr
For passive investors: Depreciation is non-cash, so a rental often shows a tax loss while cash-flowing — sheltering income. Rental losses are passive: they offset passive income freely, and up to $25,000/yr can offset ordinary (W-2) income if you actively participate and your MAGI is under $100k (phasing out to $0 by $150k); unused losses carry forward. On sale, claimed depreciation is recaptured at up to 25%, and gains may owe capital-gains tax (a 1031 exchange can defer both). Figures are a year-1 estimate at your 24.0% rate — not tax advice; consult a CPA.
Schools (NCES district)
- District
- Citrus
- NCES district ID
- 1200270
- Math proficiency
- 49% ▼ -10.00%
- Reading proficiency
- 50% ▼ -6.00%
- Median HH income
- $38,618
- Composite
- 41.28/100
- National rank
- #3519
- State rank
- #44 of 73 in FL
Livability — Inverness
- Score
- 67/100
- State rank
- #564
- US rank
- #10791
Category grades
Schools grade is shown separately in the Schools card above.
Census & demographics
- City population
- 10,621
- Population (ZIP)
- 10,408
Population outlook (Citrus County) Hauer SSP2
- Today (2025)
- 138,622 people
- By 2030
- 136,886 · -1.3%
- By 2040
- 132,009 · -4.8%
- By 2050
- 125,196 · -9.7%
- By 2075
- 108,570 · -21.7%
- By 2100
- 84,454 · -39.1%
Race, ethnicity, and origin ACS 2023
- Neighborhood character
- Predominantly White (81%)
- Race & ethnicity
- White 81% Two or more races 10% Hispanic / Latino 8% Asian 3% Black 1%
- Hispanic origin (detail)
- Mexican 3% Puerto Rican 3%
- Common ancestry
- Romanian 4% Slovak 3% Lithuanian 2%
- Foreign-born
- 8% · Canada
- Languages at home
- 90% English-only · Spanish 4% Other Indo-European 3% Tagalog/Filipino 1%
Political lean MEDSL · Citrus
- 2024 margin
- Solid R (+45.9) · D 26.8% · R 72.6%
- 2008→2024 swing
- -29.8pp toward R · 2008: -16.1pp · 2024: -45.9pp
- All cycles
- 2024: R+45.9 2020: R+41.0 2016: R+39.7 2012: R+21.9 2008: R+16.1
Not yet ingested
- Civics
- —
Market trends
- HPI YoY
- ▼ -72.56%
- Current HPI
- 315.9725
- Rent YoY
- —
- Metro
- —
- State GDP YoY
- ▲ 3.28%
- F500 in state
- 36
Industry mix (Fortune 500 HQ in FL)
| Industry | F500 HQs | Revenue |
|---|---|---|
| Industrial Technology | 2 | $29B |
|
||
| Insurance | 2 | $17B |
|
||
| Retail | 1 | $60B |
|
||
| Technology Distribution | 1 | $58B |
|
||
| Homebuilding | 1 | $35B |
|
||
| Technology Manufacturing | 1 | $35B |
|
||
Price history
+1969.0% since first listed8 events — show timeline
- 2026-02-27 Listed $120,000 RACC
- 2026-02-27 Listed $120,000 Stellar MLS as Distributed by MLS Grid
- 2023-06-21 Sold (Public Records) $138,000 Public Records
- 2022-09-23 Sold (Public Records) $78,000 Public Records
- 2001-10-16 Sold (Public Records) $11,000 Public Records
- 1996-08-01 Sold (Public Records) $5,800 Public Records
- 1992-05-01 Sold (Public Records) $6,000 Public Records
- 1992-04-01 Sold (Public Records) $5,800 Public Records
Property tax history
+8.5%/yrLatest (2025): $181 · +34.0% YoY. Source: county tax records.
Cash-flow waterfall
monthlySold comps — $/sqft
last 12 mo · ≤1 miLoading sold comps…