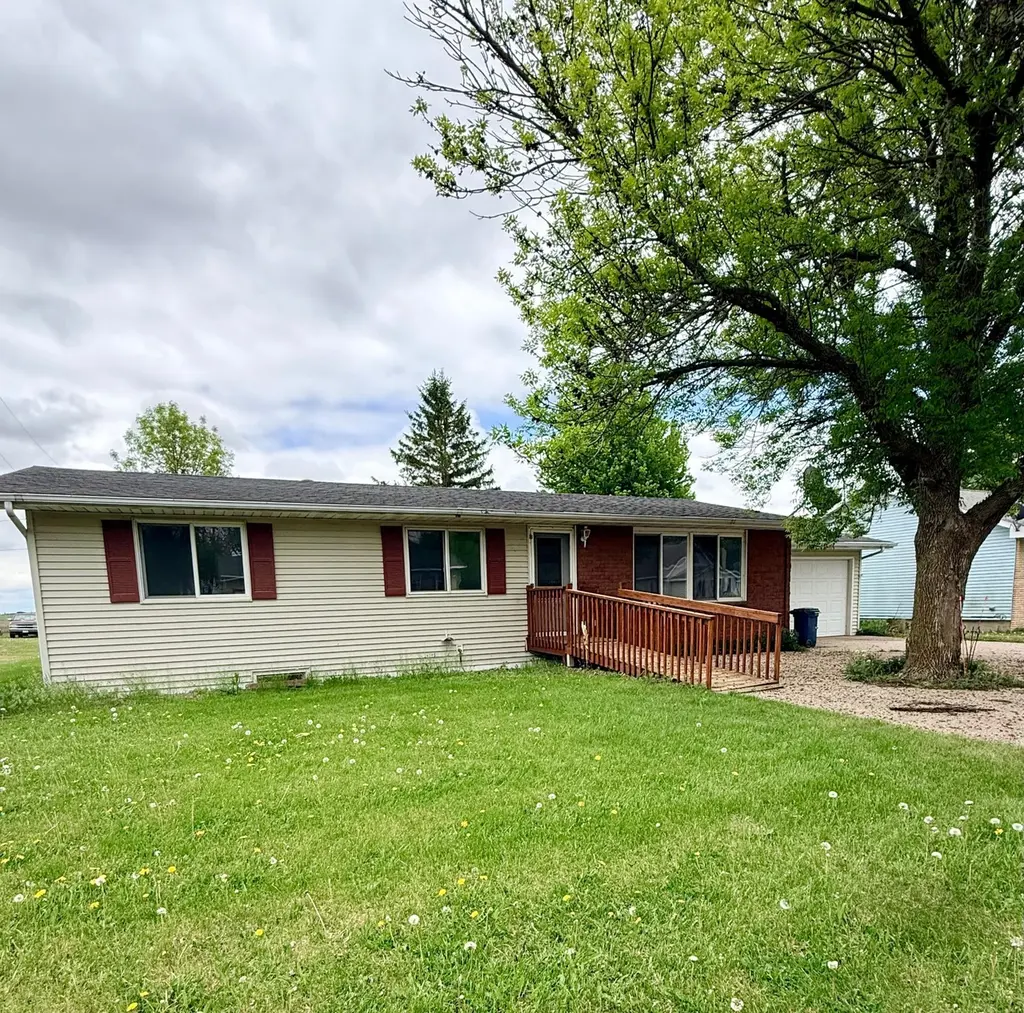
207 N Main St · St. Leo, MN
Flood risk 1/10 · Minimal
- FEMA flood zone
- X (unshaded)
- Chance of flooding over 30 yrs
- 0.0%
- Est. flood insurance / yr
- $473 – $860
Fire risk 1/10 · Minimal
- Est. fire insurance / yr
- $888 – $1,650
Heat risk 2/10 · Minimal
- Hot days now (above 100°F)
- 7 days/yr
- Hot days in 30 yrs
- 13 days/yr
Wind risk 2/10 · Minimal
- Chance of severe wind over 30 yrs
- —
Air-quality risk 2/10 · Minimal
- Unhealthy air days now
- 1 days/yr
- Unhealthy air days in 30 yrs
- 1 days/yr
Risk factors via First Street. Map © Google.
Why this score? — see what drove the C+ grade
The composite is a weighted blend of 9 inputs, each scored 0–100. Each bar is that input's sub-score; the figure is the points it added to the 100-point composite (weight × sub-score).
- Cash flow +26.7/30.0
- DSCR +9.2/10.0
- ARV discount +7.5/15.0
- 1% rule +6.5/10.0
- Schools +4.4/10.0
- Rent growth +2.5/5.0
- Livability +2.5/5.0
- Condition / age +2.5/5.0
- Appreciation +0.0/10.0
$100,000
🖨 Deal sheet (PDF) 📄 Offer letter ✓ Due diligence
Listing remarks
Enjoy small-town living in this charming 3-bedroom, 2-bathroom home located in St. Leo. Designed for convenience, the main floor features all three bedrooms, a full bathroom, laundry room, and a wheelchair ramp leading to the front entrance. Fresh paint throughout the main level gives the home a clean feel and all appliances are included. With plenty of potential to add your personal touch, this home offers comfortable living both inside and out. Relax on the front patio or enjoy the backyard space for outdoor activities and entertaining. An added bonus is the 50x151 lot locate across the street, offering endless possibilities for recreation or future development. This property is being sol
Key facts
- Front patio
- 50x151 lot
- Wheelchair ramp
Tags
Property features AI
Exterior
- Parking: Attached garage (1-car) with concrete flooring; garage roughly 13.4 x 27.10
- Utilities: City water connected; City sewer connected; Propane fuel
- Home design: Residential single-story home; Main entry on the main level; Facing direction not specified
- Construction: Asphalt roof (over 8 years old); Wood foundation; Built area split between above- and below-grade living space
- Exterior features: Vinyl siding; Paved street frontage; Publicly maintained road; Wheelchair ramp(s)
Interior
- Kitchen: Dishwasher; Range; Refrigerator; Kitchen/Dining room layout
- Bedrooms: 3 bedrooms — all on the main level
- Bathrooms: One full bath on the main level; One 3/4 bath in the basement
- Heating & cooling: Forced-air heating; No central air
- Interior features: Ceiling fan(s); Kitchen window; Main-floor primary bedroom; Full basement with sump pump (unfinished)
- Laundry & utility: Main-level laundry with washer and dryer; Unfinished basement utility/storage space
Neighborhood map
What this means for you Summary
Snapshot
- This is a 3-bed/2.0-bath single-family listed at $100k.
Deal economics
- At list price, monthly cash flow is $270 ($3k/yr) — positive.
- The deal already cash-flows at list — no discount required.
- Meets the 1% rule at list price ($1k rent vs $100k).
- Recommended offer: $98k (1.5% below list) — sets the bar for market timing.
Location & tenants
- Location reads: area grade C — affects rentability + tenant quality, not the cash-flow math above.
- Canby Public School District (rural): math 52% / reading 52% proficiency, ranked #99 of 301 in MN (top 33%) — acceptable for families but not a draw, mixed tenant base, ~2y average lease.
- Zoned schools: Canby Elementary (math 67% / reading 62%, grade B, #130 of 857 statewide, top 18%, 304 students, 49% FRL); Canby Secondary (math 37% / reading 42%, grade F, #246 of 471 statewide, top 59%, 303 students, 43% FRL) — zoned schools average 46% FRL vs 22% district-wide (24 pts higher); higher-poverty schools than district average — tighter screening recommended.
- Market conditions: 6 active listings in the ZIP; 7 units permitted in Yellow Medicine County in 2024 (0 in 5+ unit buildings).
Forward outlook
- Local home prices are declining (-3.0%/yr); year-one equity from $691 of loan paydown is wiped out by about $3k of value loss. Plan a longer hold.
- Yellow Medicine County population projected at -26% by 2050 — secular population decline; favor cash flow + early exit over multi-decade hold.
- At projected returns (-3.0% appreciation + 3.0% rent growth), your $28k cash investment doubles in ~10 years — after that, you're playing with house money.
Negotiation context
- It's been on market 25 days — a 2% lower offer ($98k) is reasonable based on typical stale-listing flexibility.
Questions for the listing agent
- Is there a deadline driving the sale (1031 exchange, divorce, estate, relocation)? That informs how much negotiation room exists.
- What's the average days-on-market for RENTAL listings here right now (not sales)? A rising rental-DOM trend means longer vacancies and softer asking-rent achievability than the comps imply.
- What's the recent tenant-quality profile in this submarket — average credit score on applications, eviction rate, late-payment / NSF rate, and stable-employment percentage? A property-management company in the area should have these aggregated.
- How much new for-sale + rental construction is in the pipeline within 1–3 miles? Heavy new supply typically softens prices + rents 12–24 months out; constrained supply supports both.
Investment metrics
- 1% rule
- 1.15% ✓
- Cap rate
- 9.54%
- Cash-on-cash
- 11.59%
- DSCR
- 1.52
- GRM
- 7.3
CMA / ARV
No comps found within radius.
Projected returns pro-forma
-3.0% appreciation · 3.0% rent growth · sell at horizon
- IRR
- 0.9%
- Equity multiple
- 1.04×
- Total profit
- $997
- Equity at exit
- $14,910
- IRR
- 10.6%
- Equity multiple
- 1.82×
- Total profit
- $22,974
- Equity at exit
- $8,646
Cash invested: $28,000 (down + closing). Projections, not guarantees.
Landlord ↔ Tenant lean methodology
- Overall (STATE)
- 46 Balanced
- State Minnesota
- 46 Balanced · D+2
- County
- — inherits STATE
- City
- — inherits STATE
ZIP-level market 56264
- Home prices YoY
- -24.8%
- Active inventory
- 6
- Price-to-rent
- 7.3×
Monthly cashflow live
- Estimated rent
- $1,149 medium interval (Pro) →
- Mortgage (P&I)
- −$524
- Tax from tax record
- −$71 /mo · $856/yr
- Insurance
- −$42
- HOA
- −$0
- Vacancy / Maint / Mgmt
- −$241
- Net cashflow
- $270
Break-even live
Sensitivity live
| Price | -10% $327 | -5% $299 | +0% $270 | +5% $242 | +10% $214 |
|---|---|---|---|---|---|
| Rent | -10% $180 | -5% $225 | +0% $270 | +5% $316 | +10% $361 |
| Rate | -1.0pp $321 | -0.5pp $296 | base $270 | +0.5pp $244 | +1.0pp $218 |
UW: 25.0% down · 7.5% · 30yr · 1.5% tax · 5.0% vac · 8.0% maint · 8.0% mgmt
Financing live
Cash to close
- Down payment
- $25,000
- Closing costs
- $3,000
- Reserves months
- —
- Total cash needed
- —
Loan-product check · same deal, 3 products live
Conventional
25% down · 7.5% · 30yr
- Down + closing
- —
- Monthly P&I
- —
- Monthly cashflow
- —
- DSCR
- —
- Eligible?
- —
Personal DTI + credit; lowest rate.
DSCR
20% down · 8.5% · 30yr
- Down + closing
- —
- Monthly P&I
- —
- Monthly cashflow
- —
- DSCR
- —
- Eligible?
- —
No personal income docs; deal must DSCR.
Hard money
10% down · 12.0% · 12mo
- Down + closing
- —
- Monthly P&I
- —
- Monthly cashflow
- —
- DSCR
- —
- Eligible?
- —
Short-term bridge; refi at stabilization.
Listing history 18 events
-
2026-06-21days on market $100,000 Active 25 DOM
-
2026-06-21days on market $100,000 Active 24 DOM
-
2026-06-18days on market $100,000 Active 22 DOM
-
2026-06-17days on market $100,000 Active 21 DOM
-
2026-06-16days on market $100,000 Active 20 DOM
-
2026-06-15days on market $100,000 Active 19 DOM
-
2026-06-13days on market $100,000 Active 17 DOM
-
2026-06-12days on market $100,000 Active 16 DOM
-
2026-06-09days on market $100,000 Active 13 DOM
-
2026-06-08days on market $100,000 Active 12 DOM
-
2026-06-07days on market $100,000 Active 11 DOM
-
2026-06-05days on market $100,000 Active 9 DOM
-
2026-06-04days on market $100,000 Active 7 DOM
-
2026-06-02days on market $100,000 Active 6 DOM
-
2026-06-01days on market $100,000 Active 5 DOM
-
2026-05-31days on market $100,000 Active 4 DOM
-
2026-05-31days on market $100,000 Active 3 DOM
-
2026-05-26$100,000 Active
ⓘ Source: listings_history table (triggers on properties + properties_extension) + one-shot
backfill from property_details.listing_events for pre-trigger history.
Tax reassessment forecast MN · Partial reset (capped growth)
- Current annual tax
- $856 · $71/mo
- Projected year-2 tax
- $988 · $82/mo
- Expected delta
- +$132/yr (+$11/mo · 15.4%)
ⓘ Screening estimate from a state-policy table — verify with the county assessor before closing.
Climate risk First Street
- Flood 1/10 Low FEMA zone X (unshaded) · 0% chance over 30 yrs
- Wildfire 1/10 Low
- Heat 2/10 Low 7 d/yr ≥100°F today · 13 d/yr by 30 yrs out
- Wind 2/10 Low
- Air quality 2/10 Low 1 unhealthy d/yr today · 1 by 30 yrs out
Nearby sold comps map
Loading sold comps map…
Walkable amenities ~0.75 mi
Loading nearby amenities…
Taxation est. · year 1
- Rental income
- $13,788
- − Mortgage interest
- −$5,602
- − Property taxes
- −$856
- − Insurance
- −$500
- − Repairs & maintenance
- −$1,103
- − Management
- −$1,103
- − Depreciation
- −$2,909
- Taxable income
- $1,716
- Est. tax owed @ 24.0%
- −$412
- After-tax cash flow
- $2,832/yr
For passive investors: Depreciation is non-cash, so a rental often shows a tax loss while cash-flowing — sheltering income. Rental losses are passive: they offset passive income freely, and up to $25,000/yr can offset ordinary (W-2) income if you actively participate and your MAGI is under $100k (phasing out to $0 by $150k); unused losses carry forward. On sale, claimed depreciation is recaptured at up to 25%, and gains may owe capital-gains tax (a 1031 exchange can defer both). Figures are a year-1 estimate at your 24.0% rate — not tax advice; consult a CPA.
Schools (NCES district)
- District
- Canby Public School District
- NCES district ID
- 2707470
- Math proficiency
- 52% ▼ -11.00%
- Reading proficiency
- 52% ▼ -16.00%
- Median HH income
- $48,782
- Composite
- 44.34/100
- National rank
- #2823
- State rank
- #99 of 301 in MN
Livability — St. Leo
No livability data for this city. (Only ~50 U.S. cities are tracked.)
Census & demographics
- Census place
- St. Leo, MN
- Population (ZIP)
- 2,185
Population outlook (Yellow Medicine County) Hauer SSP2
- Today (2025)
- 8,959 people
- By 2030
- 8,451 · -5.7%
- By 2040
- 7,514 · -16.1%
- By 2050
- 6,650 · -25.8%
- By 2075
- 5,306 · -40.8%
- By 2100
- 4,453 · -50.3%
Race, ethnicity, and origin ACS 2023
- Neighborhood character
- Predominantly White (85%)
- Race & ethnicity
- White 85% Hispanic / Latino 12% Two or more races 9%
- Hispanic origin (detail)
- Mexican 12%
- Common ancestry
- Portuguese 24% English 15% Romanian 4%
- Foreign-born
- 4% · Canada
- Languages at home
- 92% English-only · Spanish 7%
Political lean MEDSL · Yellow Medicine
- 2024 margin
- Solid R (+40.6) · D 28.7% · R 69.3% · Other 1.9%
- 2008→2024 swing
- -44.9pp toward R · 2008: 4.3pp · 2024: -40.6pp
- All cycles
- 2024: R+40.6 2020: R+37.0 2016: R+35.4 2012: R+6.3 2008: D+4.3
Not yet ingested
- Civics
- —
Market trends
- HPI YoY
- ▼ -50.69%
- Current HPI
- 153.4077
- Rent YoY
- —
- Metro
- —
- State GDP YoY
- ▲ 2.41%
- F500 in state
- 34
Industry mix (Fortune 500 HQ in MN)
| Industry | F500 HQs | Revenue |
|---|---|---|
| Healthcare | 2 | $407B |
|
||
| Retail | 2 | $150B |
|
||
| Consumer Goods | 2 | $32B |
|
||
| Industrial Machinery | 2 | $6B |
|
||
| Agriculture | 1 | $40B |
|
||
| Healthcare / Medical Devices | 1 | $32B |
|
||
Price history
1 event — show timeline
- 2026-05-26 Listed $100,000 NORTHSTARMLS as Distributed by MLS Grid
Property tax history
+6.1%/yrLatest (2026): $856 · +10.0% YoY. Source: county tax records.
Cash-flow waterfall
monthlySold comps — $/sqft
last 12 mo · ≤1 miLoading sold comps…