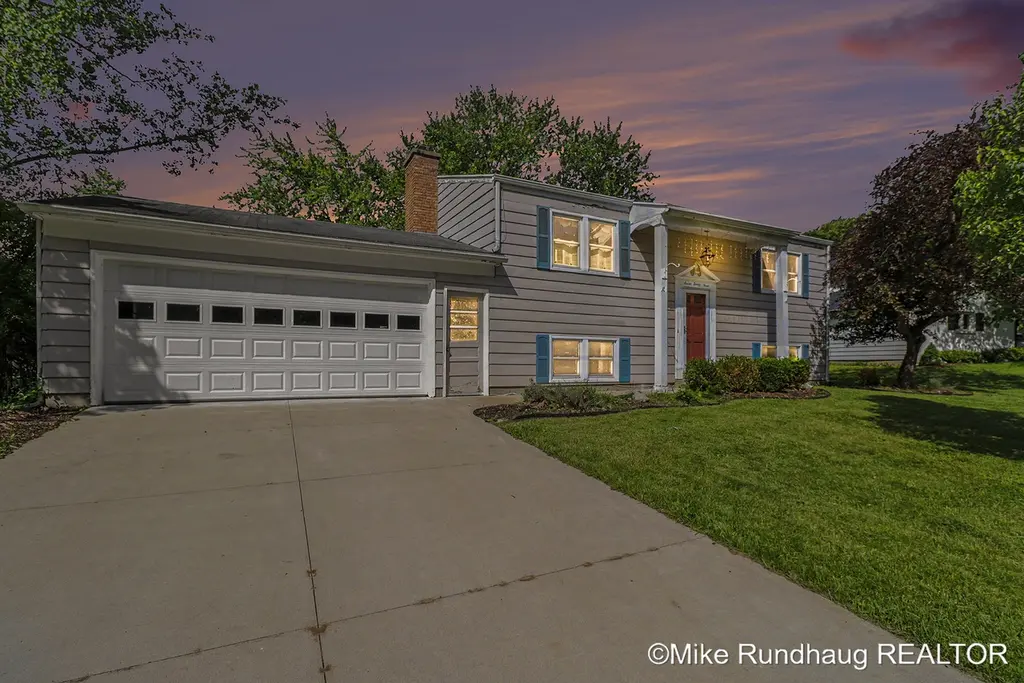
723 Marbury Dr SE · Forest Hills, MI
Flood risk 1/10 · Minimal
- FEMA flood zone
- X (unshaded)
- Chance of flooding over 30 yrs
- 0.0%
- Est. flood insurance / yr
- $507 – $1,088
Fire risk 1/10 · Minimal
- Est. fire insurance / yr
- $784 – $1,456
Heat risk 2/10 · Minimal
- Hot days now (above 96°F)
- 7 days/yr
- Hot days in 30 yrs
- 16 days/yr
Wind risk 2/10 · Minimal
- Chance of severe wind over 30 yrs
- —
Air-quality risk 3/10 · Minor
- Unhealthy air days now
- 3 days/yr
- Unhealthy air days in 30 yrs
- 3 days/yr
Risk factors via First Street. Map © Google.
Why this score? — see what drove the C+ grade
The composite is a weighted blend of 9 inputs, each scored 0–100. Each bar is that input's sub-score; the figure is the points it added to the 100-point composite (weight × sub-score).
- Cash flow +22.0/30.0
- ARV discount +15.0/15.0
- DSCR +7.0/10.0
- Schools +6.3/10.0
- 1% rule +5.3/10.0
- Livability +3.8/5.0
- Rent growth +2.5/5.0
- Condition / age +2.5/5.0
- Appreciation +0.0/10.0
$275,000
🖨 Deal sheet (PDF) 📄 Offer letter ✓ Due diligence
Listing remarks MLS
Location, privacy, and limitless potential--this is the hidden gem you've been waiting for. Tucked away in a highly desirable, established wooded neighborhood, this property offers the rare chance to build equity in one of the area's most sought-after communities. If you have a vision or a trusted contractor, this home is your blank canvas. Step inside and unlock the possibilities. The bones are here, the layout is ready for a modern revival, and the serene, tree-lined lot provides the perfect backdrop for a transformation. Whether you are an investor or homebuyer looking to customize your dream home while forcing instant appreciation, this property delivers. Seller instructs listing broker that they will not review offers until June 4, 2026 at 3pm.
Key facts
- Wooded neighborhood
- Blank canvas
- Tree lined lot
Tags
Property features AI
Finance
- HOA & community: Annual association fee of $100; Has association
Exterior
- Parking: Attached 2-car garage
- Utilities: Public water; Public sewer; Natural gas
- Home design: Single-family residence; Residential property
- Construction: Built in 1970; Vinyl siding; Composition roof; Daylight basement
- Exterior features: Paved road access; 0.26-acre lot
Interior
- Kitchen: Dishwasher; Microwave; Oven; Refrigerator
- Bedrooms: Total of 5 rooms (bedrooms included in room count)
- Bathrooms: 2 full bathrooms
- Heating & cooling: Forced air heating; Central cooling
- Interior features: Garage door opener; Wood-burning fireplace; Screens and window treatments
- Laundry & utility: Washer; Dryer; Natural gas water heater
Neighborhood map
What this means for you Summary
Snapshot
- This is a 4-bed/2.0-bath single-family listed at $275k.
Deal economics
- At list price, monthly cash flow is $438 ($5k/yr) — positive.
- The deal already cash-flows at list — no discount required.
- Meets the 1% rule at list price ($3k rent vs $275k).
- Cap rate 8.2% vs local median 2.8% in Forest Hills — top-decile yield for the area; either an underpriced asset or a hidden risk that comps aren't pricing in. Stress-test before assuming the spread holds.
Location & tenants
- Location reads 76/100 on livability (#139 in MI, #3,404 nationally) — a middle-class / working-renter tenant base. Strengths: schools A+, employment A+, housing A+; Watch: cost of living C-, amenities F, commute F.
- Forest Hills Public Schools (suburban): math 65% / reading 74% proficiency, ranked #11 of 540 in MI (top 2%) — acceptable for families but not a draw, mixed tenant base, ~2y average lease; only 8% free/reduced lunch — higher-income household profile.
- Market conditions: 120 active listings in the ZIP; 2,253 units permitted in Kent County in 2024 (969 in 5+ unit buildings).
Forward outlook
- Local home prices are declining (-3.0%/yr); year-one equity from $2k of loan paydown is wiped out by about $8k of value loss. Plan a longer hold.
- Kent County population projected at +22% by 2050 — long-run rental-demand tailwind backs the buy-and-hold thesis.
Negotiation context
- Only 8 days on market — expect competitive offers; lowballing is unlikely to land.
- 7 sale attempts since 36y ago with the ask held roughly flat each time — persistent listings suggest the price (not the market) is what's stuck; bring a comps-based counter.
- Current owner paid $91k; list at $275k implies a 202% gain — meaningful room to come down on a strong offer.
Questions for the listing agent
- Built in 1970 — when were the roof, HVAC, electrical panel, plumbing, and water heater last replaced?
- What does the HOA fee cover, when was the last increase, and are there any pending special assessments or reserve-fund shortfalls?
- Is there a deadline driving the sale (1031 exchange, divorce, estate, relocation)? That informs how much negotiation room exists.
- Schools are A-rated — typically a magnet for longer-tenancy family renters. What's the average tenant stay here, and is there a school-zone premium baked into asking?
- What's the average days-on-market for RENTAL listings here right now (not sales)? A rising rental-DOM trend means longer vacancies and softer asking-rent achievability than the comps imply.
- What's the recent tenant-quality profile in this submarket — average credit score on applications, eviction rate, late-payment / NSF rate, and stable-employment percentage? A property-management company in the area should have these aggregated.
- How much new for-sale + rental construction is in the pipeline within 1–3 miles? Heavy new supply typically softens prices + rents 12–24 months out; constrained supply supports both.
Investment metrics
- 1% rule
- 1.03% ✓
- Cap rate
- 8.20%
- Cash-on-cash
- 6.83%
- DSCR
- 1.30
- GRM
- 8.1
CMA / ARV
- ARV (on-the-fly)
- $437,184
- Comps found
- 8
Show comp detail 8 sales within ~0.75 mi
| Address | Dist | Beds/Ba | Sqft | Sold | Price | $/sf | Match |
|---|---|---|---|---|---|---|---|
| 715 Marbury Dr SE | 0.02mi | 4/2.0 | 1,820 (+5%) | 11mo | $460,000 | $253 | 81 |
| 745 Adaway Ave SE | 0.21mi | 4/1.5 | 1,753 (+1%) | 9mo | $397,700 | $227 | 78 |
| 410 Adaway Ave SE | 0.36mi | 3/2.5 (-1) | 1,736 (+0%) | 3mo | $467,100 | $269 | 73 |
| 677 Rookway Ave SE | 0.16mi | 3/2.5 (-1) | 1,673 (-3%) | 13mo | $487,000 | $291 | 70 |
| 6150 Winthrop Ct SE | 0.37mi | 4/2.0 | 1,858 (+8%) | 3mo | $465,000 | $250 | 68 |
| 621 Duxbury Ct SE | 0.14mi | 3/2.5 (-1) | 1,673 (-3%) | 17mo | $430,000 | $257 | 67 |
| 6039 Buttonwood Ct SE | 0.36mi | 4/2.0 | 1,800 (+4%) | 17mo | $395,000 | $219 | 62 |
| 446 Adaway Ave SE | 0.31mi | 4/2.0 | 1,940 (+12%) | 5mo | $387,500 | $200 | 61 |
Match score weights: distance 35% · size 25% · config 20% · recency 20%. Top-matched comps best support the ARV.
Projected returns pro-forma
-3.0% appreciation · 3.0% rent growth · sell at horizon
- IRR
- -5.8%
- Equity multiple
- 0.78×
- Total profit
- $-16,676
- Equity at exit
- $41,003
- IRR
- 3.8%
- Equity multiple
- 1.28×
- Total profit
- $21,348
- Equity at exit
- $23,777
Cash invested: $77,000 (down + closing). Projections, not guarantees.
Landlord ↔ Tenant lean methodology
- Overall (STATE)
- 62 Landlord-Friendly
- State Michigan
- 62 Landlord-Friendly · EVEN
- County
- — inherits STATE
- City
- — inherits STATE
ZIP-level market 49301
- Home prices YoY
- -30.8%
- Active inventory
- 120
- Price-to-rent
- 8.1×
Monthly cashflow live
- Estimated rent
- $2,844 medium interval (Pro) →
- Mortgage (P&I)
- −$1,442
- Tax from tax record
- −$244 /mo · $2,930/yr
- Insurance
- −$115
- HOA
- −$8
- Vacancy / Maint / Mgmt
- −$597
- Net cashflow
- $438
Break-even live
Sensitivity live
| Price | -10% $594 | -5% $516 | +0% $438 | +5% $360 | +10% $282 |
|---|---|---|---|---|---|
| Rent | -10% $213 | -5% $326 | +0% $438 | +5% $550 | +10% $663 |
| Rate | -1.0pp $577 | -0.5pp $508 | base $438 | +0.5pp $367 | +1.0pp $294 |
UW: 25.0% down · 7.5% · 30yr · 1.5% tax · 5.0% vac · 8.0% maint · 8.0% mgmt
Financing live
Cash to close
- Down payment
- $68,750
- Closing costs
- $8,250
- Reserves months
- —
- Total cash needed
- —
Loan-product check · same deal, 3 products live
Conventional
25% down · 7.5% · 30yr
- Down + closing
- —
- Monthly P&I
- —
- Monthly cashflow
- —
- DSCR
- —
- Eligible?
- —
Personal DTI + credit; lowest rate.
DSCR
20% down · 8.5% · 30yr
- Down + closing
- —
- Monthly P&I
- —
- Monthly cashflow
- —
- DSCR
- —
- Eligible?
- —
No personal income docs; deal must DSCR.
Hard money
10% down · 12.0% · 12mo
- Down + closing
- —
- Monthly P&I
- —
- Monthly cashflow
- —
- DSCR
- —
- Eligible?
- —
Short-term bridge; refi at stabilization.
HOA detail
- Monthly dues
- $8 · $96/yr
Listing history 16 events
-
2026-06-07statusdays on market $275,000 Pending 8 DOM
-
2026-06-03days on market $275,000 Active 6 DOM
-
2026-06-03days on market $275,000 Active 5 DOM
-
2026-06-01days on market $275,000 Active 4 DOM
-
2026-05-31days on market $275,000 Active 3 DOM
-
2026-05-28$275,000 Active 759-char remark
Show marketing remark (759 chars)
Location, privacy, and limitless potential--this is the hidden gem you've been waiting for. Tucked away in a highly desirable, established wooded neighborhood, this property offers the rare chance to build equity in one of the area's most sought-after communities. If you have a vision or a trusted contractor, this home is your blank canvas. Step inside and unlock the possibilities. The bones are here, the layout is ready for a modern revival, and the serene, tree-lined lot provides the perfect backdrop for a transformation. Whether you are an investor or homebuyer looking to customize your dream home while forcing instant appreciation, this property delivers. Seller instructs listing broker that they will not review offers until June 4, 2026 at 3pm.
-
2026-05-28$275,000 Active
Show marketing remark (759 chars)
Location, privacy, and limitless potential--this is the hidden gem you've been waiting for. Tucked away in a highly desirable, established wooded neighborhood, this property offers the rare chance to build equity in one of the area's most sought-after communities. If you have a vision or a trusted contractor, this home is your blank canvas. Step inside and unlock the possibilities. The bones are here, the layout is ready for a modern revival, and the serene, tree-lined lot provides the perfect backdrop for a transformation. Whether you are an investor or homebuyer looking to customize your dream home while forcing instant appreciation, this property delivers. Seller instructs listing broker that they will not review offers until June 4, 2026 at 3pm.
-
2026-05-28$275,000 Active 759-char remark
Show marketing remark (759 chars)
Location, privacy, and limitless potential--this is the hidden gem you've been waiting for. Tucked away in a highly desirable, established wooded neighborhood, this property offers the rare chance to build equity in one of the area's most sought-after communities. If you have a vision or a trusted contractor, this home is your blank canvas. Step inside and unlock the possibilities. The bones are here, the layout is ready for a modern revival, and the serene, tree-lined lot provides the perfect backdrop for a transformation. Whether you are an investor or homebuyer looking to customize your dream home while forcing instant appreciation, this property delivers. Seller instructs listing broker that they will not review offers until June 4, 2026 at 3pm.
-
2014-09-16historical
-
1991-07-22soldstatus $91,000
-
1991-07-22soldstatus $91,000
-
1991-03-12$95,000
-
1991-03-12$95,000
-
1991-03-07historical
-
1990-09-07$95,000
-
1990-09-07$95,000
ⓘ Source: listings_history table (triggers on properties + properties_extension) + one-shot
backfill from property_details.listing_events for pre-trigger history.
Tax reassessment forecast MI · Partial reset (capped growth)
- Current annual tax
- $2,930 · $244/mo
- Projected year-2 tax
- $3,582 · $299/mo
- Expected delta
- +$653/yr (+$54/mo · 22.3%)
ⓘ Screening estimate from a state-policy table — verify with the county assessor before closing.
Climate risk First Street
- Flood 1/10 Low FEMA zone X (unshaded) · 0% chance over 30 yrs
- Wildfire 1/10 Low
- Heat 2/10 Low 7 d/yr ≥96°F today · 16 d/yr by 30 yrs out
- Wind 2/10 Low
- Air quality 3/10 Moderate 3 unhealthy d/yr today · 3 by 30 yrs out
Nearby sold comps map
Loading sold comps map…
Walkable amenities ~0.75 mi
Loading nearby amenities…
Taxation est. · year 1
- Rental income
- $34,130
- − Mortgage interest
- −$15,404
- − Property taxes
- −$2,930
- − Insurance
- −$1,375
- − Repairs & maintenance
- −$2,730
- − Management
- −$2,730
- − HOA
- −$96
- − Depreciation
- −$8,000
- Taxable income
- $864
- Est. tax owed @ 24.0%
- −$207
- After-tax cash flow
- $5,049/yr
For passive investors: Depreciation is non-cash, so a rental often shows a tax loss while cash-flowing — sheltering income. Rental losses are passive: they offset passive income freely, and up to $25,000/yr can offset ordinary (W-2) income if you actively participate and your MAGI is under $100k (phasing out to $0 by $150k); unused losses carry forward. On sale, claimed depreciation is recaptured at up to 25%, and gains may owe capital-gains tax (a 1031 exchange can defer both). Figures are a year-1 estimate at your 24.0% rate — not tax advice; consult a CPA.
Schools (NCES district)
- District
- Forest Hills Public Schools
- NCES district ID
- 2614610
- Math proficiency
- 65% ▼ -3.00%
- Reading proficiency
- 74% ▲ 1.00%
- Median HH income
- $95,067
- Composite
- 63.23/100
- National rank
- #632
- State rank
- #11 of 540 in MI
Livability — Forest Hills
- Score
- 76/100
- State rank
- #139
- US rank
- #3404
Category grades
Schools grade is shown separately in the Schools card above.
Census & demographics
- Census place
- Forest Hills, MI
- City population
- 53,921
- Population (ZIP)
- 20,492
Population outlook (Kent County) Hauer SSP2
- Today (2025)
- 712,484 people
- By 2030
- 748,618 · +5.1%
- By 2040
- 814,777 · +14.4%
- By 2050
- 868,556 · +21.9%
- By 2075
- 966,487 · +35.7%
- By 2100
- 967,975 · +35.9%
Race, ethnicity, and origin ACS 2023
- Neighborhood character
- Predominantly White (86%)
- Race & ethnicity
- White 86% Two or more races 6% Hispanic / Latino 5% Asian 4%
- Hispanic origin (detail)
- Mexican 2%
- Common ancestry
- Iranian 16% Romanian 6% Italian 4%
- Foreign-born
- 5% · Canada, China, Jamaica
- Languages at home
- 90% English-only · Spanish 4% Korean 1% Other Indo-European 1%
Political lean MEDSL · Kent
- 2024 margin
- Lean D (+5.4) · D 51.8% · R 46.5% · Other 1.7%
- 2008→2024 swing
- +4.8pp toward D · 2008: 0.5pp · 2024: 5.4pp
- All cycles
- 2024: D+5.4 2020: D+6.1 2016: R+3.1 2012: R+7.9 2008: D+0.5
Not yet ingested
- Civics
- —
Market trends
- HPI YoY
- ▼ -118.11%
- Current HPI
- 264.8246
- Rent YoY
- —
- Metro
- —
- State GDP YoY
- ▲ 1.37%
- F500 in state
- 28
Industry mix (Fortune 500 HQ in MI)
| Industry | F500 HQs | Revenue |
|---|---|---|
| Automotive Parts | 3 | $48B |
|
||
| Automotive | 2 | $372B |
|
||
| Chemicals | 1 | $45B |
|
||
| Automotive Retail | 1 | $29B |
|
||
| Healthcare / Medical Devices | 1 | $23B |
|
||
| Automotive Technology | 1 | $20B |
|
||
Price history
+189.5% since first listed11 events — show timeline
- 2026-05-28 Listed $275,000 MiRealSource-MiMLS
- 2026-05-28 Listed $275,000 SW Michigan MLS
- 2026-05-28 Listed $275,000 REALCOMP
- 2014-09-16 Listing Removed — SW Michigan MLS
- 1991-07-22 Sold (MLS) $91,000 REALCOMP
- 1991-07-22 Sold (MLS) $91,000 SW Michigan MLS
- 1991-03-12 Listed $95,000 REALCOMP
- 1991-03-12 Listed $95,000 SW Michigan MLS
- 1991-03-07 Listing Removed — REALCOMP
- 1990-09-07 Listed $95,000 REALCOMP
- 1990-09-07 Listed $95,000 SW Michigan MLS
Property tax history
+2.5%/yrLatest (2025): $2,930 · +1.8% YoY. Source: county tax records.
Cash-flow waterfall
monthlySold comps — $/sqft
last 12 mo · ≤1 miLoading sold comps…