 Duplex
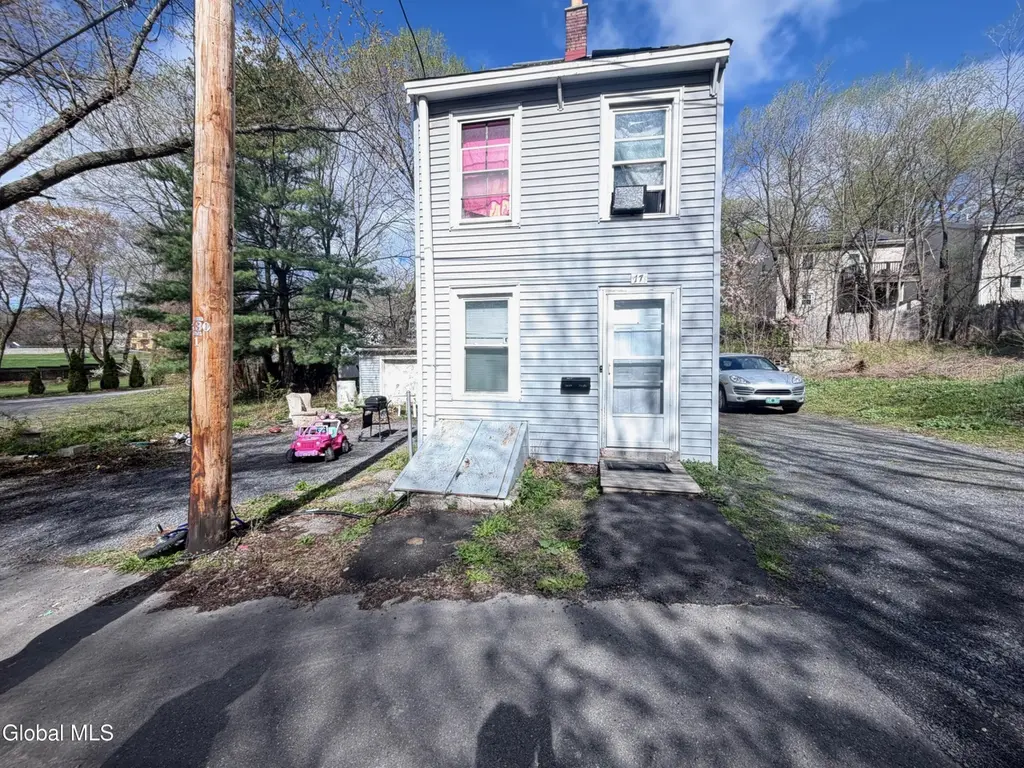
13 Batcher St · Albany, NY
Flood risk 1/10 · Minimal
- FEMA flood zone
- X (unshaded)
- Chance of flooding over 30 yrs
- 0.0%
- Est. flood insurance / yr
- $473 – $860
Fire risk 1/10 · Minimal
- Est. fire insurance / yr
- $691 – $1,283
Heat risk 4/10 · Minor
- Hot days now (above 98°F)
- 7 days/yr
- Hot days in 30 yrs
- 17 days/yr
Wind risk 3/10 · Minor
- Chance of severe wind over 30 yrs
- 6.0%
Air-quality risk 1/10 · Minimal
- Unhealthy air days now
- 0 days/yr
- Unhealthy air days in 30 yrs
- 0 days/yr
Risk factors via First Street. Map © Google.
Why this score? — see what drove the B- grade
The composite is a weighted blend of 9 inputs, each scored 0–100. Each bar is that input's sub-score; the figure is the points it added to the 100-point composite (weight × sub-score).
- Cash flow +21.4/30.0
- Appreciation +10.0/10.0
- ARV discount +7.5/15.0
- DSCR +6.8/10.0
- 1% rule +5.0/10.0
- Rent growth +4.7/5.0
- Livability +4.0/5.0
- Schools +3.2/10.0
- Condition / age +2.5/5.0
$289,900
🖨 Deal sheet (PDF) 📄 Offer letter ✓ Due diligence
Multi-family units
County records classify this as Multi-Family (2-4 Unit). Listing-text estimate: 2 units. confirmed
Listing remarks
Fantastic development opportunity! Package of 8 parcels! Offering a 2 family home with a 2 car detached garage, another 5 bay garage with 8 vacant land parcels. The first floor apartment is renovated in the two family but the 2nd floor needs rehab. Both units are occupied with longer term tenants. The first floor pays $750 and the second floor pays $650 and both are month to month. Enjoy plenty of off street parking and a 2 car detached garage. This property is in the middle of Albany revitalization project of upwards of $177 million of brand new 2 family homes being built all around the South end of Albany. Don't miss this unique opportunity to have instant equity in this great project. Re
Key facts
- 0.88 acre lot
- 7 garage spots
- Built 1880
Property features AI
Finance
- Financial info: Property is a 2-unit multi-family; Tenants pay electricity and gas
Exterior
- Parking: 7 garage spaces; Driveway and garage parking; 6 parking spaces reported
- Security: Smoke detectors; Carbon monoxide detectors
- Utilities: 100 Amp electric service; Public water; Public sewer
- Home design: Duplex; Living area approximately 1,176; Main road frontage of 379 feet
- Construction: Wood siding construction
- Exterior features: Rubber roof; Level, cleared lot; Garage(s) on the property; Other exterior features
Interior
- Kitchen: Unit 1: 1 kitchen on the 1st floor; Unit 2: 1 kitchen on the 1st floor
- Bedrooms: Unit 1: 2 bedrooms (both on the 1st floor); Unit 2: 2 bedrooms (1 on the 1st floor)
- Flooring: Vinyl
- Bathrooms: 2 full bathrooms total; Unit 1: 1 full bathroom (1st floor); Unit 2: 1 full bathroom
- Heating & cooling: Radiant heating
- Interior features: Vinyl flooring; Crawl space basement
- Laundry & utility: Washer hookup; Electric dryer hookup
Neighborhood map
What this means for you Summary
Snapshot
- This is a 2 × 2-bed/1.0-bath units multifamily listed at $290k.
Deal economics
- At list price, monthly cash flow is $431 ($5k/yr) — positive. Per door: $215/mo.
- The deal already cash-flows at list — no discount required.
- To meet the 1% rule (rent ≥ 1% of price), the offer needs to be $290k (0.1% below list).
- Recommended offer: $281k (3.0% below list) — sets the bar for market timing.
- Cap rate 8.1% vs local median 5.7% in Albany — top-decile yield for the area; either an underpriced asset or a hidden risk that comps aren't pricing in. Stress-test before assuming the spread holds.
Location & tenants
- Location reads 79/100 on livability (#129 in NY, #2,083 nationally) — a middle-class / working-renter tenant base. Strengths: amenities A+, commute A+, housing A+; Watch: employment C-, crime F.
- Albany City School District (urban): math 37% / reading 40% proficiency, ranked #543 of 590 in NY (top 92%) — families likely to look elsewhere, expect single-tenant / working-renter base with shorter leases; 66% free/reduced lunch — lower-income household profile, screen leases tightly.
- Zoned schools: Albany High School (math 74% / reading 67%, grade B+, #710 of 1,100 statewide, top 65%, 2,676 students, 69% FRL) — zoned schools at 69% FRL track the district average.
- Zoned-school proficiency averages 70% at this address vs 38% district-wide (+32 pts) — the actual schools serving this property are materially stronger than the Albany City School District average implies; a family-tenant draw the district grade alone would hide.
- Market conditions: Rents rising fast (+8.7%/yr); 58 active listings in the ZIP; 16 comparable units currently listed for rent nearby; rentals at typical pace (median 25d on market — plan ~3-4 weeks tenant-placement turnaround); 675 units permitted in Albany County in 2024 (451 in 5+ unit buildings).
- At $2,895/mo this rent would consume 66% of the median local household income ($53k/yr) (locally 935% of renters already pay >50% of income on rent) — very limited rent-growth headroom before tenants either downsize or default.
Forward outlook
- In year one you build about $31k of equity ($2k loan paydown + $29k appreciation (10.0% local appreciation)).
- Albany County population projected at +9% by 2050 — modest demand growth; plan on rents tracking national, not racing it.
- At projected returns (10.0% appreciation + 8.0% rent growth), your $81k cash investment doubles in ~3 years — after that, you're playing with house money.
- By year 2, paydown + projected appreciation supports a ~$50k cash-out refi (75% LTV) — recoverable capital for the next deal without selling this one.
Negotiation context
- It's been on market 46 days — a 3% lower offer ($281k) is reasonable based on typical stale-listing flexibility.
Risks & watch-outs
- Watch-outs: built in 1880 — expect roof / HVAC / electrical / plumbing capex.
Questions for the listing agent
- It's been on market 46 days. Have you received any prior offers? Is the seller open to a 3% concession, seller financing, or rate buy-down credit?
- Can we see the unit-by-unit rent roll, current vacancy, and any below-market leases? What's the average tenancy length?
- What capital expenditures (roof, boiler, parking lot, exteriors) have been made in the last 5 years, and what's planned in the next 2?
- Built in 1880 — when were the roof, HVAC, electrical panel, plumbing, and water heater last replaced?
- Is there a deadline driving the sale (1031 exchange, divorce, estate, relocation)? That informs how much negotiation room exists.
- Crime grade is F in this area — have there been break-ins, vandalism, or insurance claims at this property in the last 3 years? What carrier currently insures it and at what premium?
- What's the average days-on-market for RENTAL listings here right now (not sales)? A rising rental-DOM trend means longer vacancies and softer asking-rent achievability than the comps imply.
- What's the recent tenant-quality profile in this submarket — average credit score on applications, eviction rate, late-payment / NSF rate, and stable-employment percentage? A property-management company in the area should have these aggregated.
- How much new apartment / multifamily construction is in the pipeline within 1–3 miles? Heavy new supply (>2% of stock underway) typically softens rents 12–24 months out; light construction supports rent growth.
Investment metrics
- 1% rule
- 1.00% ✗
- Cap rate
- 8.08%
- Cash-on-cash
- 6.37%
- DSCR
- 1.28
- GRM
- 8.3
CMA / ARV
- ARV (on-the-fly)
- $138,768
- Comps found
- 5
Show comp detail 5 sales within ~0.75 mi
| Address | Dist | Beds/Ba | Sqft | Sold | Price | $/sf | Match |
|---|---|---|---|---|---|---|---|
| 113 Clinton St | 0.19mi | 4/2.0 | 1,200 (+2%) | 7mo | $142,000 | $118 | 82 |
| 120 2nd Ave | 0.18mi | 4/2.0 | 1,200 (+2%) | 20mo | $130,000 | $108 | 71 |
| 6 Sloan St | 0.19mi | 4/2.0 | 1,200 (+2%) | 23mo | $145,000 | $121 | 68 |
| 3 Regent St | 0.34mi | 4/2.0 | 1,309 (+11%) | 13mo | $142,000 | $108 | 55 |
| 62 Catherine St | 0.36mi | 5/2.5 (+1) | 1,320 (+12%) | 13mo | $319,000 | $242 | 45 |
Match score weights: distance 35% · size 25% · config 20% · recency 20%. Top-matched comps best support the ARV.
Projected returns pro-forma
10.0% appreciation · 8.0% rent growth · sell at horizon
- IRR
- 30.8%
- Equity multiple
- 3.47×
- Total profit
- $200,588
- Equity at exit
- $261,165
- IRR
- 28.2%
- Equity multiple
- 8.48×
- Total profit
- $606,921
- Equity at exit
- $563,212
Cash invested: $81,172 (down + closing). Projections, not guarantees.
Landlord ↔ Tenant lean methodology
- Overall (STATE)
- 15 Strongly Tenant-Friendly
- State New York
- 15 Strongly Tenant-Friendly · D+10
- County
- — inherits STATE
- City
- — inherits STATE
ZIP-level market 12202
- Home prices YoY
- 14.3%
- Rents YoY
- 8.7%
- Active inventory
- 58
- Price-to-rent
- 16.7×
Monthly cashflow live
- Estimated rent
- $2,895 high interval (Pro) →
- Mortgage (P&I)
- −$1,520
- Tax from tax record
- −$215 /mo · $2,580/yr
- Insurance
- −$121
- HOA
- −$0
- Vacancy / Maint / Mgmt
- −$608
- Net cashflow
- $431
Break-even live
Sensitivity live
| Price | -10% $595 | -5% $513 | +0% $431 | +5% $349 | +10% $267 |
|---|---|---|---|---|---|
| Rent | -10% $202 | -5% $317 | +0% $431 | +5% $545 | +10% $660 |
| Rate | -1.0pp $577 | -0.5pp $505 | base $431 | +0.5pp $356 | +1.0pp $279 |
2-unit breakdown (identical units grouped — click to expand)
| Units | Beds | Baths | Est. rent |
|---|---|---|---|
| 2× units | 2 | 1 | $2,896 |
| #1 | 2 | 1 | $1,448 |
| #2 | 2 | 1 | $1,448 |
| Total (2 units) | $2,895 | ||
UW: 25.0% down · 7.5% · 30yr · 1.5% tax · 5.0% vac · 8.0% maint · 8.0% mgmt
Financing live
Cash to close
- Down payment
- $72,475
- Closing costs
- $8,697
- Reserves months
- —
- Total cash needed
- —
Loan-product check · same deal, 3 products live
Conventional
25% down · 7.5% · 30yr
- Down + closing
- —
- Monthly P&I
- —
- Monthly cashflow
- —
- DSCR
- —
- Eligible?
- —
Personal DTI + credit; lowest rate.
DSCR
20% down · 8.5% · 30yr
- Down + closing
- —
- Monthly P&I
- —
- Monthly cashflow
- —
- DSCR
- —
- Eligible?
- —
No personal income docs; deal must DSCR.
Hard money
10% down · 12.0% · 12mo
- Down + closing
- —
- Monthly P&I
- —
- Monthly cashflow
- —
- DSCR
- —
- Eligible?
- —
Short-term bridge; refi at stabilization.
Rent comps 16 comps
| Address | Beds | Baths | Sqft | Rent | $/sqft | DOM | Units | Dist |
|---|---|---|---|---|---|---|---|---|
| 475 S Pearl St #3 Albany, NY | 4.0 | 2.0 | 1200 | $1,850 | $1.54 | 15d | 1 | 0.15mi |
| 475 S Pearl St #3 Albany, NY | 4.0 | 2.0 | 1200 | $1,850 | $1.54 | 22d | 1 | 0.15mi |
| 132 4th Ave Albany, NY | 3.0 | 1.0 | 770 | $1,800 | $2.34 | 22d | 1 | 0.25mi |
| 168 S Pearl St Albany, NY | 3.0 | 1.5 | 1044 | $1,800 | $1.72 | 25d | 1 | 0.67mi |
| 22 Hurlbut St Albany, NY | 3.0 | 1.0 | 1209 | $2,050 | $1.70 | 45d | 1 | 0.75mi |
| 31 Bertha St Albany, NY | 4.0 | 1.0 | 1116 | $2,000 | $1.79 | 25d | 1 | 0.79mi |
| 4 Irving St Unit 2nd Floor Albany, NY | 3.0 | 1.0 | 1000 | $1,695 | $1.70 | 45d | 1 | 0.81mi |
| 346 Madison Ave Unit 3 Albany, NY | 3.0 | 2.0 | 1110 | $2,725 | $2.45 | 45d | 1 | 0.93mi |
| 346 Madison Ave Albany, NY | 3.0 | 2.0 | 1500 | $2,495 | $1.66 | 25d | 1 | 0.93mi |
| 502 Second Ave #3 Albany, NY | 3.0 | 1.0 | 1100 | $1,800 | $1.64 | 45d | 1 | 1.06mi |
| 50 Southern Blvd Albany, NY | 3.0 | 1.0 | 1200 | $1,650 | $1.38 | 15d | 1 | 1.07mi |
| 88 Willett St Albany, NY | 3.0 | 1.0 | 825 | $2,080 | $2.52 | 15d | 10 | 1.16mi |
| 520 Madison Ave Unit 1 Albany, NY | 3.0 | 1.0 | 1080 | $1,700 | $1.57 | 45d | 1 | 1.23mi |
| 199 Lark St Albany, NY | 3.0 | 1.0 | 1000 | $1,800 | $1.80 | 45d | 1 | 1.33mi |
| 254 Sheridan Ave Unit 2 Albany, NY | 3.0 | 1.0 | 900 | $1,300 | $1.44 | 25d | 1 | 1.49mi |
| 945 Broadway Rensselaer, NY | 3.0 | 1.0 | 1200 | $1,650 | $1.38 | 25d | 1 | 1.50mi |
Listing history 15 events
-
2026-06-21days on market $289,900 Active 46 DOM
-
2026-06-18days on market $289,900 Active 43 DOM
-
2026-06-17days on market $289,900 Active 42 DOM
-
2026-06-16days on market $289,900 Active 41 DOM
-
2026-06-15days on market $289,900 Active 40 DOM
-
2026-06-14days on market $289,900 Active 38 DOM
-
2026-06-10days on market $289,900 Active 35 DOM
-
2026-06-08days on market $289,900 Active 33 DOM
-
2026-06-07days on market $289,900 Active 32 DOM
-
2026-06-03days on market $289,900 Active 28 DOM
-
2026-06-02days on market $289,900 Active 27 DOM
-
2026-06-01days on market $289,900 Active 26 DOM
-
2026-05-31days on market $289,900 Active 25 DOM
-
2026-05-31days on market $289,900 Active 24 DOM
-
2026-05-05$289,900 Active
ⓘ Source: listings_history table (triggers on properties + properties_extension) + one-shot
backfill from property_details.listing_events for pre-trigger history.
Tax reassessment forecast NY · Partial reset (capped growth)
- Current annual tax
- $2,580 · $215/mo
- Projected year-2 tax
- $3,740 · $312/mo
- Expected delta
- +$1,159/yr (+$97/mo · 44.9%)
ⓘ Screening estimate from a state-policy table — verify with the county assessor before closing.
Climate risk First Street
- Flood 1/10 Low FEMA zone X (unshaded) · 0% chance over 30 yrs
- Wildfire 1/10 Low
- Heat 4/10 Moderate 7 d/yr ≥98°F today · 17 d/yr by 30 yrs out
- Wind 3/10 Moderate 6% chance of damaging wind over 30 yrs
- Air quality 1/10 Low 0 unhealthy d/yr today · 0 by 30 yrs out
Nearby sold comps map
Loading sold comps map…
Walkable amenities ~0.75 mi
Loading nearby amenities…
Taxation est. · year 1
- Rental income
- $34,740
- − Mortgage interest
- −$16,239
- − Property taxes
- −$2,580
- − Insurance
- −$1,450
- − Repairs & maintenance
- −$2,779
- − Management
- −$2,779
- − Depreciation
- −$8,433
- Taxable income
- $479
- Est. tax owed @ 24.0%
- −$115
- After-tax cash flow
- $5,056/yr
For passive investors: Depreciation is non-cash, so a rental often shows a tax loss while cash-flowing — sheltering income. Rental losses are passive: they offset passive income freely, and up to $25,000/yr can offset ordinary (W-2) income if you actively participate and your MAGI is under $100k (phasing out to $0 by $150k); unused losses carry forward. On sale, claimed depreciation is recaptured at up to 25%, and gains may owe capital-gains tax (a 1031 exchange can defer both). Figures are a year-1 estimate at your 24.0% rate — not tax advice; consult a CPA.
Schools (NCES district)
- District
- Albany City School District
- NCES district ID
- 3602460
- Math proficiency
- 37% ▲ 6.00%
- Reading proficiency
- 40% ▲ 7.00%
- Median HH income
- $40,568
- Composite
- 32.34/100
- National rank
- #5744
- State rank
- #543 of 590 in NY
Livability — Albany
- Score
- 79/100
- State rank
- #129
- US rank
- #2083
Category grades
Schools grade is shown separately in the Schools card above.
Census & demographics
- Census place
- Albany, NY
- County
- Albany County · 196,626 people
- City population
- 116,921
- Metro
- Albany-Schenectady-Troy, NY
- Population (ZIP)
- 10,166
- Household income
- $52,868
- Rent vs Own
- Severe rent burden
- 935.0
Population outlook (Albany County) Hauer SSP2
- Today (2025)
- 320,794 people
- By 2030
- 327,401 · +2.1%
- By 2040
- 338,218 · +5.4%
- By 2050
- 348,467 · +8.6%
- By 2075
- 381,693 · +19.0%
- By 2100
- 393,809 · +22.8%
Race, ethnicity, and origin ACS 2023
- Neighborhood character
- Highly diverse neighborhood (Simpson 0.73)
- Race & ethnicity
- Black 40% White 28% Hispanic / Latino 15% Two or more races 14% Asian 7%
- Hispanic origin (detail)
- Mexican 3% Puerto Rican 5% Dominican 5%
- Common ancestry
- Iranian 2% Romanian 1% Serbian 1%
- Foreign-born
- 14% · Canada, Philippines, China
- Languages at home
- 80% English-only · Spanish 10% Other Asian/Pacific 4% Arabic 1%
Political lean MEDSL · Albany
- 2024 margin
- Strong D (+25.8) · D 62.9% · R 37.1%
- 2008→2024 swing
- -3.6pp toward R · 2008: 29.4pp · 2024: 25.8pp
- All cycles
- 2024: D+25.8 2020: D+31.4 2016: D+24.3 2012: D+31.0 2008: D+29.4
Not yet ingested
- Civics
- —
Market trends
- HPI YoY
- ▲ 38.05%
- Current HPI
- 303.8939
- Rent YoY
- ▲ 8.70%
- Metro
- Albany-Schenectady-Troy, NY
- State GDP YoY
- ▲ 2.60%
- F500 in state
- 92
Industry mix (Fortune 500 HQ in NY)
| Industry | F500 HQs | Revenue |
|---|---|---|
| Financial Services | 10 | $950B |
|
||
| Consumer Goods | 9 | $162B |
|
||
| Insurance | 4 | $225B |
|
||
| Telecommunications | 2 | $144B |
|
||
| Pharmaceuticals | 2 | $112B |
|
||
| Media / Entertainment | 2 | $69B |
|
||
Price history
1 event — show timeline
- 2026-05-05 Listed $289,900 Global MLS
Property tax history
+19.3%/yrLatest (2025): $2,580 · +7.5% YoY. Source: county tax records.
Cash-flow waterfall
monthlySold comps — $/sqft
last 12 mo · ≤1 miLoading sold comps…