 Triplex
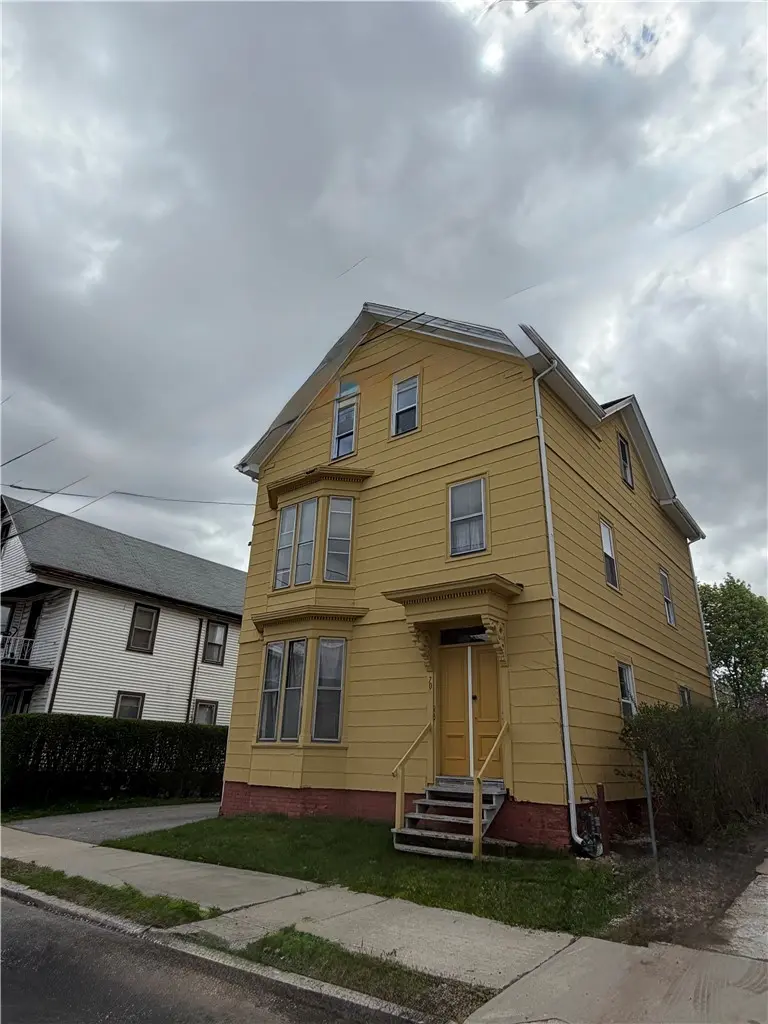
70 Whittier Ave · Providence, RI
Flood risk 1/10 · Minimal
- FEMA flood zone
- X (unshaded)
- Chance of flooding over 30 yrs
- 0.0%
- Est. flood insurance / yr
- $473 – $860
Fire risk 1/10 · Minimal
- Est. fire insurance / yr
- $835 – $1,551
Heat risk 6/10 · Moderate
- Hot days now (above 96°F)
- 7 days/yr
- Hot days in 30 yrs
- 16 days/yr
Wind risk 6/10 · Moderate
- Chance of severe wind over 30 yrs
- 71.0%
Air-quality risk 2/10 · Minimal
- Unhealthy air days now
- 1 days/yr
- Unhealthy air days in 30 yrs
- 2 days/yr
Risk factors via First Street. Map © Google.
Why this score? — see what drove the C- grade
The composite is a weighted blend of 9 inputs, each scored 0–100. Each bar is that input's sub-score; the figure is the points it added to the 100-point composite (weight × sub-score).
- Cash flow +23.6/30.0
- DSCR +7.6/10.0
- ARV discount +7.5/15.0
- 1% rule +5.1/10.0
- Livability +4.2/5.0
- Rent growth +3.4/5.0
- Condition / age +2.5/5.0
- Schools +1.0/10.0
- Appreciation +0.0/10.0
$669,900
🖨 Deal sheet (PDF) 📄 Offer letter ✓ Due diligence
Multi-family units
County records classify this as Multi-Family (2-4 Unit). Listing-text estimate: 3 units. confirmed
Listing remarks MLS
nvestor Special Total Renovation Opportunity! Attention investors: This property is a full rehab inside and out ideal for cash or hard money buyers only. Incredible potential awaits the right buyer. Please do not walk the property, one unit is still occupied. No interior photos available due to the current condition. Showings by appointment only. Bring your offers, this is your chance to unlock serious value!
Key facts
- Large lot
- Updated bathrooms
- Updated kitchens
Tags
Property features AI
Finance
- Financial info: Tenant pays hot water
- HOA & community: Community amenities nearby: golf, marina, pool, public transportation, recreation area, restaurants, shopping, sidewalks, highway access, near hospital and schools
Exterior
- Parking: No garage; 8 total parking spaces
- Utilities: Public water (connected); Public sewer (connected); Electrical service: 100 amps
- Home design: 3-story building; Single building with multiple units
- Construction: Drywall and plaster interior walls; Shingle siding; Combination foundation; Above-grade finished area listed
- Exterior features: Paved driveway; Fenced yard
Interior
- Kitchen: Oven; Range; Refrigerator
- Bedrooms: Three 2-bedroom units (each unit includes 2 bedrooms)
- Flooring: Hardwood flooring; Vinyl flooring
- Bathrooms: Total of 3 full bathrooms (one full bath in each unit)
- Heating & cooling: Gas heating; Baseboard heat; Space heaters
- Interior features: Thermal windows; Bathtub; Stall shower; Tub/shower combination; Interior steps; Full unfinished basement (storage/utility space)
- Laundry & utility: Gas water heater; Water heater (additional listed); Utility room
Neighborhood map
What this means for you Summary
Snapshot
- This is a 3 × 2-bed/1.0-bath units multifamily listed at $670k.
Deal economics
- At list price, monthly cash flow is $1k ($15k/yr) — positive. Per door: $421/mo.
- The deal already cash-flows at list — no discount required.
- Meets the 1% rule at list price ($7k rent vs $670k).
- Recommended offer: $650k (3.0% below list) — sets the bar for market timing.
- Cap rate 8.6% vs local median 4.0% in Providence — top-decile yield for the area; either an underpriced asset or a hidden risk that comps aren't pricing in. Stress-test before assuming the spread holds.
Location & tenants
- Location reads 84/100 on livability (#2 in RI, #794 nationally) — a professional / high-income tenant draw. Strengths: amenities A+, commute A+, housing A+; Watch: employment C-.
- Providence (urban): math 8% / reading 16% proficiency, ranked #34 of 39 in RI (top 87%) — low school quality limits family demand, transient renter base, plan for 1-2y turnover; 79% free/reduced lunch — lower-income household profile, screen leases tightly.
- Zoned schools: George J. West El. School (math 7% / reading 13%, grade F, #148 of 167 statewide, top 90%, 601 students, 84% FRL); Nathanael Greene Middle (math 10% / reading 23%, grade F, #37 of 57 statewide, top 64%, 808 students, 85% FRL); Central High School (math 2% / reading 12%, grade F, #53 of 58 statewide, top 96%, 1,302 students, 87% FRL).
- Market conditions: Rents rising (+3.7%/yr); 134 active listings in the ZIP; 1 comparable units currently listed for rent nearby; 776 units permitted in Providence County in 2024 (229 in 5+ unit buildings).
- At $6,768/mo this rent would consume 126% of the median local household income ($65k/yr) (locally 2000% of renters already pay >50% of income on rent) — very limited rent-growth headroom before tenants either downsize or default.
Forward outlook
- Local home prices are declining (-3.0%/yr); year-one equity from $5k of loan paydown is wiped out by about $20k of value loss. Plan a longer hold.
- Providence County population projected at +5% by 2050 — modest demand growth; plan on rents tracking national, not racing it.
Negotiation context
- It's been on market 34 days — a 3% lower offer ($650k) is reasonable based on typical stale-listing flexibility.
- 2 sale attempts with the ask held roughly flat each time — persistent listings suggest the price (not the market) is what's stuck; bring a comps-based counter.
- Current owner paid $350k; list at $670k implies a 91% gain — meaningful room to come down on a strong offer.
Risks & watch-outs
- Watch-outs: built in 1910 — expect roof / HVAC / electrical / plumbing capex.
- Climate carrying-cost: major wind risk, 71% chance of damaging wind over 30y; extreme-heat days projected 7→16/yr by 2055 (HVAC capex compounding) — expect insurance premiums to compound above CPI over the hold.
Questions for the listing agent
- It's been on market 34 days. Have you received any prior offers? Is the seller open to a 3% concession, seller financing, or rate buy-down credit?
- Can we see the unit-by-unit rent roll, current vacancy, and any below-market leases? What's the average tenancy length?
- What capital expenditures (roof, boiler, parking lot, exteriors) have been made in the last 5 years, and what's planned in the next 2?
- Built in 1910 — when were the roof, HVAC, electrical panel, plumbing, and water heater last replaced?
- Is there a deadline driving the sale (1031 exchange, divorce, estate, relocation)? That informs how much negotiation room exists.
- Schools are F-rated, which usually means shorter tenancies and higher turnover. Who's the typical renter profile here, and what's been the actual vacancy rate?
- What's the average days-on-market for RENTAL listings here right now (not sales)? A rising rental-DOM trend means longer vacancies and softer asking-rent achievability than the comps imply.
- What's the recent tenant-quality profile in this submarket — average credit score on applications, eviction rate, late-payment / NSF rate, and stable-employment percentage? A property-management company in the area should have these aggregated.
- How much new apartment / multifamily construction is in the pipeline within 1–3 miles? Heavy new supply (>2% of stock underway) typically softens rents 12–24 months out; light construction supports rent growth.
Investment metrics
- 1% rule
- 1.01% ✓
- Cap rate
- 8.56%
- Cash-on-cash
- 8.09%
- DSCR
- 1.36
- GRM
- 8.2
CMA / ARV
No comps found within radius.
Projected returns pro-forma
-3.0% appreciation · 3.68% rent growth · sell at horizon
- IRR
- -3.3%
- Equity multiple
- 0.87×
- Total profit
- $-23,600
- Equity at exit
- $99,884
- IRR
- 7.0%
- Equity multiple
- 1.54×
- Total profit
- $101,583
- Equity at exit
- $57,921
Cash invested: $187,572 (down + closing). Projections, not guarantees.
Landlord ↔ Tenant lean methodology
- Overall (STATE)
- 31 Tenant-Leaning
- State Rhode Island
- 31 Tenant-Leaning · D+8
- County
- — inherits STATE
- City
- — inherits STATE
ZIP-level market 02909
- Home prices YoY
- -13.3%
- Rents YoY
- 3.7%
- Active inventory
- 134
- Price-to-rent
- 24.7×
Monthly cashflow live
- Estimated rent
- $6,768 high interval (Pro) →
- Mortgage (P&I)
- −$3,513
- Tax from tax record
- −$290 /mo · $3,483/yr
- Insurance
- −$279
- HOA
- −$0
- Lot rent
- −$0
- Vacancy / Maint / Mgmt
- −$1,421
- Net cashflow
- $1,264
Break-even live
Sensitivity live
| Price | -10% $1,644 | -5% $1,454 | +0% $1,264 | +5% $1,075 | +10% $885 |
|---|---|---|---|---|---|
| Rent | -10% $730 | -5% $997 | +0% $1,264 | +5% $1,532 | +10% $1,799 |
| Rate | -1.0pp $1,602 | -0.5pp $1,435 | base $1,264 | +0.5pp $1,091 | +1.0pp $914 |
3-unit breakdown (identical units grouped — click to expand)
| Units | Beds | Baths | Est. rent |
|---|---|---|---|
| 3× units | 2 | 1 | $6,768 |
| #1 | 2 | 1 | $2,256 |
| #2 | 2 | 1 | $2,256 |
| #3 | 2 | 1 | $2,256 |
| Total (3 units) | $6,768 | ||
UW: 25.0% down · 7.5% · 30yr · 1.5% tax · 5.0% vac · 8.0% maint · 8.0% mgmt
Financing live
Cash to close
- Down payment
- $167,475
- Closing costs
- $20,097
- Reserves months
- —
- Total cash needed
- —
Loan-product check · same deal, 3 products live
Conventional
25% down · 7.5% · 30yr
- Down + closing
- —
- Monthly P&I
- —
- Monthly cashflow
- —
- DSCR
- —
- Eligible?
- —
Personal DTI + credit; lowest rate.
DSCR
20% down · 8.5% · 30yr
- Down + closing
- —
- Monthly P&I
- —
- Monthly cashflow
- —
- DSCR
- —
- Eligible?
- —
No personal income docs; deal must DSCR.
Hard money
10% down · 12.0% · 12mo
- Down + closing
- —
- Monthly P&I
- —
- Monthly cashflow
- —
- DSCR
- —
- Eligible?
- —
Short-term bridge; refi at stabilization.
Rent comps 1 comps
| Address | Beds | Baths | Sqft | Rent | $/sqft | DOM | Units | Dist |
|---|---|---|---|---|---|---|---|---|
| 14 Calef St Unit 16 Cranston, RI | 5.0 | 3.0 | 3000 | $3,500 | $1.17 | 19d | 1 | 1.28mi |
Listing history 20 events
-
2026-06-22days on market $669,900 Active 34 DOM
-
2026-06-21days on market $669,900 Active 33 DOM
-
2026-06-18days on market $669,900 Active 30 DOM
-
2026-06-17days on market $669,900 Active 29 DOM
-
2026-06-16days on market $669,900 Active 28 DOM
-
2026-06-15days on market $669,900 Active 27 DOM
-
2026-06-13days on market $669,900 Active 25 DOM
-
2026-06-09days on market $669,900 Active 21 DOM
-
2026-06-08days on market $669,900 Active 20 DOM
-
2026-06-07days on market $669,900 Active 19 DOM
-
2026-06-05days on market $669,900 Active 16 DOM
-
2026-06-03days on market $669,900 Active 15 DOM
-
2026-06-02days on market $669,900 Active 14 DOM
-
2026-06-01days on market $669,900 Active 13 DOM
-
2026-05-31days on market $669,900 Active 12 DOM
-
2026-05-19$669,900 Active
-
2025-11-21soldstatus $350,000 Closed 419-char remark
Show marketing remark (419 chars)
nvestor Special Total Renovation Opportunity! Attention investors: This property is a full rehab inside and out ideal for cash or hard money buyers only. Incredible potential awaits the right buyer. Please do not walk the property, one unit is still occupied. No interior photos available due to the current condition. Showings by appointment only. Bring your offers, this is your chance to unlock serious value!
-
2025-11-21soldstatus $350,000
Show marketing remark (419 chars)
nvestor Special Total Renovation Opportunity! Attention investors: This property is a full rehab inside and out ideal for cash or hard money buyers only. Incredible potential awaits the right buyer. Please do not walk the property, one unit is still occupied. No interior photos available due to the current condition. Showings by appointment only. Bring your offers, this is your chance to unlock serious value!
-
2025-10-26status Pending 419-char remark
Show marketing remark (419 chars)
nvestor Special Total Renovation Opportunity! Attention investors: This property is a full rehab inside and out ideal for cash or hard money buyers only. Incredible potential awaits the right buyer. Please do not walk the property, one unit is still occupied. No interior photos available due to the current condition. Showings by appointment only. Bring your offers, this is your chance to unlock serious value!
-
2025-10-21$225,000 Active 419-char remark
Show marketing remark (419 chars)
nvestor Special Total Renovation Opportunity! Attention investors: This property is a full rehab inside and out ideal for cash or hard money buyers only. Incredible potential awaits the right buyer. Please do not walk the property, one unit is still occupied. No interior photos available due to the current condition. Showings by appointment only. Bring your offers, this is your chance to unlock serious value!
ⓘ Source: listings_history table (triggers on properties + properties_extension) + one-shot
backfill from property_details.listing_events for pre-trigger history.
Tax reassessment forecast RI · Partial reset (capped growth)
- Current annual tax
- $3,483 · $290/mo
- Projected year-2 tax
- $7,201 · $600/mo
- Expected delta
- +$3,718/yr (+$310/mo · 106.8%)
ⓘ Screening estimate from a state-policy table — verify with the county assessor before closing.
Climate risk First Street
- Flood 1/10 Low FEMA zone X (unshaded) · 0% chance over 30 yrs
- Wildfire 1/10 Low
- Heat 6/10 Major 7 d/yr ≥96°F today · 16 d/yr by 30 yrs out
- Wind 6/10 Major 71% chance of damaging wind over 30 yrs
- Air quality 2/10 Low 1 unhealthy d/yr today · 2 by 30 yrs out
Nearby sold comps map
Loading sold comps map…
Walkable amenities ~0.75 mi
Loading nearby amenities…
Taxation est. · year 1
- Rental income
- $81,216
- − Mortgage interest
- −$37,525
- − Property taxes
- −$3,483
- − Insurance
- −$3,350
- − Repairs & maintenance
- −$6,497
- − Management
- −$6,497
- − Depreciation
- −$19,488
- Taxable income
- $4,376
- Est. tax owed @ 24.0%
- −$1,050
- After-tax cash flow
- $14,122/yr
For passive investors: Depreciation is non-cash, so a rental often shows a tax loss while cash-flowing — sheltering income. Rental losses are passive: they offset passive income freely, and up to $25,000/yr can offset ordinary (W-2) income if you actively participate and your MAGI is under $100k (phasing out to $0 by $150k); unused losses carry forward. On sale, claimed depreciation is recaptured at up to 25%, and gains may owe capital-gains tax (a 1031 exchange can defer both). Figures are a year-1 estimate at your 24.0% rate — not tax advice; consult a CPA.
Schools (NCES district)
- District
- Providence
- NCES district ID
- 4400900
- Math proficiency
- 8% ▼ -4.00%
- Reading proficiency
- 16% ▼ -2.00%
- Median HH income
- $38,197
- Composite
- 10.12/100
- National rank
- #9803
- State rank
- #34 of 39 in RI
Livability — Providence
- Score
- 84/100
- State rank
- #2
- US rank
- #794
Category grades
Schools grade is shown separately in the Schools card above.
Census & demographics
- Census place
- Providence, RI
- County
- Providence County · 548,917 people
- City population
- 212,734
- Metro
- Providence-Warwick, RI-MA
- Population (ZIP)
- 46,014
- Household income
- $64,649
- Rent vs Own
- Severe rent burden
- 2000.0
Population outlook (Providence County) Hauer SSP2
- Today (2025)
- 653,469 people
- By 2030
- 660,819 · +1.1%
- By 2040
- 672,747 · +3.0%
- By 2050
- 683,741 · +4.6%
- By 2075
- 720,435 · +10.2%
- By 2100
- 741,582 · +13.5%
Race, ethnicity, and origin ACS 2023
- Neighborhood character
- Diverse neighborhood (Simpson 0.57)
- Race & ethnicity
- Hispanic / Latino 60% Two or more races 23% White 22% Black 12% Asian 2% Native American 2%
- Hispanic origin (detail)
- Puerto Rican 12% Dominican 23%
- Common ancestry
- Lithuanian 2% Russian 1% Romanian 1%
- Foreign-born
- 35% · Canada, Jamaica
- Languages at home
- 43% English-only · Spanish 50% Other Indo-European 2% Other Asian/Pacific 1%
Political lean MEDSL · Providence
- 2024 margin
- D (+14.4) · D 56.1% · R 41.7% · Other 2.2%
- 2008→2024 swing
- -20.0pp toward R · 2008: 34.4pp · 2024: 14.4pp
- All cycles
- 2024: D+14.4 2020: D+22.9 2016: D+21.2 2012: D+34.9 2008: D+34.4
Not yet ingested
- Civics
- —
Market trends
- HPI YoY
- ▼ -72.78%
- Current HPI
- 474.9956
- Rent YoY
- ▲ 3.68%
- Metro
- Providence-Warwick, RI-MA
- State GDP YoY
- ▲ 2.25%
- F500 in state
- 10
Industry mix (Fortune 500 HQ in RI)
| Industry | F500 HQs | Revenue |
|---|---|---|
| Healthcare | 1 | $373B |
|
||
| Food Distribution | 1 | $31B |
|
||
| Aerospace / Defense | 1 | $14B |
|
||
| Financial Services | 1 | $8B |
|
||
| Consumer Goods | 1 | $4B |
|
||
Price history
+197.7% since first listed5 events — show timeline
- 2026-05-19 Listed $669,900 RIS
- 2025-11-21 Sold (Public Records) $350,000 Public Records
- 2025-11-21 Sold (MLS) $350,000 RIS
- 2025-10-26 Pending — RIS
- 2025-10-21 Listed $225,000 RIS
Property tax history
-0.4%/yrLatest (2025): $3,483 · -38.7% YoY. Source: county tax records.
Cash-flow waterfall
monthlySold comps — $/sqft
last 12 mo · ≤1 miLoading sold comps…