17071 SW 127th Ave · Archer, FL
Flood risk 1/10 · Minimal
- FEMA flood zone
- X (unshaded)
- Chance of flooding over 30 yrs
- 0.0%
- Est. flood insurance / yr
- $507 – $1,088
Fire risk 7/10 · Major
- Est. fire insurance / yr
- $947 – $1,759
Heat risk 8/10 · Major
- Hot days now (above 108°F)
- 6 days/yr
- Hot days in 30 yrs
- 19 days/yr
Wind risk 9/10 · Severe
- Chance of severe wind over 30 yrs
- 99.0%
Air-quality risk 3/10 · Minor
- Unhealthy air days now
- 4 days/yr
- Unhealthy air days in 30 yrs
- 4 days/yr
Risk factors via First Street. Map © Google.
Why this score? — see what drove the B+ grade
The composite is a weighted blend of 9 inputs, each scored 0–100. Each bar is that input's sub-score; the figure is the points it added to the 100-point composite (weight × sub-score).
- Cash flow +30.0/30.0
- 1% rule +10.0/10.0
- DSCR +10.0/10.0
- ARV discount +7.5/15.0
- Appreciation +5.3/10.0
- Schools +4.3/10.0
- Livability +3.2/5.0
- Rent growth +2.5/5.0
- Condition / age +2.5/5.0
$159,900
🖨 Deal sheet (PDF) 📄 Offer letter ✓ Due diligence
Listing remarks
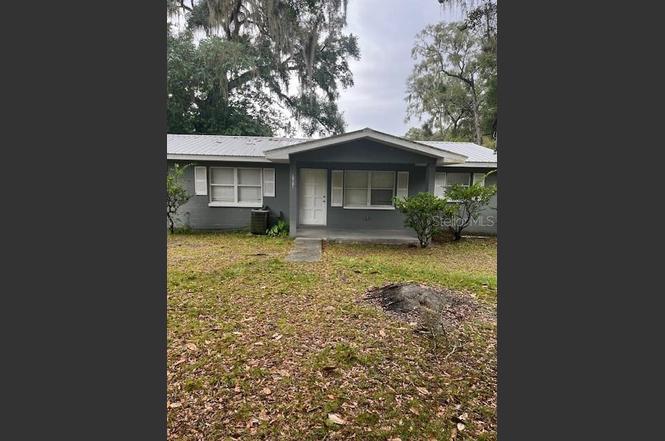
Under contract-accepting backup offers. Professionally renovated 5 years ago. Home in excellent condition. Block home with a metal roof
Key facts
- Metal roof
- 0.24 acre lot
- Parking
Tags
Property features AI
Finance
- Other: Located in the Archer Woods development
- HOA & community: No HOA/association
Exterior
- Parking: Carport (1 space)
- Utilities: Public water; Public sewer; Electricity available and connected
- Home design: Single family residence; One story; Faces east
- Construction: Block construction; Metal roof; Slab foundation; Built on a 0.24-acre lot
- Exterior features: Other exterior features; Paved road access
Interior
- Kitchen: Range; Range hood; Refrigerator
- Bedrooms: 3 bedrooms
- Flooring: Laminate flooring
- Bathrooms: 1 full bathroom
- Heating & cooling: Electric heating; Central air conditioning
- Interior features: Other interior features
- Laundry & utility: Electric dryer hookup; Outside laundry hookup; Electric water heater
Neighborhood map
What this means for you Summary
Snapshot
- This is a 3-bed/2.0-bath single-family listed at $160k.
Deal economics
- At list price, monthly cash flow is $819 ($10k/yr) — positive.
- The deal already cash-flows at list — no discount required.
- Meets the 1% rule at list price ($2k rent vs $160k).
- Recommended offer: $141k (12.0% below list) — sets the bar for market timing.
Location & tenants
- Location reads 64/100 on livability (#676 in FL) — a middle-class / working-renter tenant base. Strengths: crime A+, cost of living A+, housing A-; Watch: employment D+, health & safety D, amenities F.
- Alachua (urban): math 49% / reading 54% proficiency, ranked #30 of 73 in FL (top 41%) — acceptable for families but not a draw, mixed tenant base, ~2y average lease.
- Zoned schools: Archer Elementary (math 61% / reading 60%, grade B-, #664 of 2,144 statewide, top 32%, 457 students, 58% FRL); Oak View Middle School (math 58% / reading 59%, grade B, #148 of 571 statewide, top 26%, 964 students, 49% FRL); Newberry High School (math 35% / reading 54%, grade F, #237 of 667 statewide, top 36%, 728 students, 50% FRL) — zoned schools at 52% FRL track the district average.
- Market conditions: 135 active listings in the ZIP; 1 comparable units currently listed for rent nearby; 1,774 units permitted in Alachua County in 2024 (984 in 5+ unit buildings).
Forward outlook
- In year one you build about $2k of equity ($1k loan paydown + $959 appreciation (0.6% local appreciation)).
- Alachua County population projected at +26% by 2050 — long-run rental-demand tailwind backs the buy-and-hold thesis.
- At projected returns (0.6% appreciation + 3.0% rent growth), your $45k cash investment doubles in ~4 years — after that, you're playing with house money.
Negotiation context
- It's been on market 152 days — a 12% lower offer ($141k) is reasonable based on typical stale-listing flexibility.
- 5 sale attempts since 7y ago with the ask held roughly flat each time — persistent listings suggest the price (not the market) is what's stuck; bring a comps-based counter.
- Current owner paid $46k; list at $160k implies a 251% gain — meaningful room to come down on a strong offer.
Risks & watch-outs
- Climate carrying-cost: severe wind risk, 99% chance of damaging wind over 30y; major wildfire risk; extreme-heat days projected 6→19/yr by 2055 (HVAC capex compounding) — expect insurance premiums to compound above CPI over the hold.
Questions for the listing agent
- It's been on market 152 days. Have you received any prior offers? Is the seller open to a 12% concession, seller financing, or rate buy-down credit?
- Built in 1973 — when were the roof, HVAC, electrical panel, plumbing, and water heater last replaced?
- Why hasn't it sold? Are there any deal-killer items the seller is aware of (foundation, flood, title, zoning, code violations)?
- Is there a deadline driving the sale (1031 exchange, divorce, estate, relocation)? That informs how much negotiation room exists.
- What's the average days-on-market for RENTAL listings here right now (not sales)? A rising rental-DOM trend means longer vacancies and softer asking-rent achievability than the comps imply.
- What's the recent tenant-quality profile in this submarket — average credit score on applications, eviction rate, late-payment / NSF rate, and stable-employment percentage? A property-management company in the area should have these aggregated.
- How much new for-sale + rental construction is in the pipeline within 1–3 miles? Heavy new supply typically softens prices + rents 12–24 months out; constrained supply supports both.
Investment metrics
- 1% rule
- 1.56% ✓
- Cap rate
- 12.44%
- Cash-on-cash
- 21.95%
- DSCR
- 1.98
- GRM
- 5.3
CMA / ARV
No comps found within radius.
Projected returns pro-forma
0.6% appreciation · 3.0% rent growth · sell at horizon
- IRR
- 23.2%
- Equity multiple
- 2.16×
- Total profit
- $52,119
- Equity at exit
- $51,281
- IRR
- 26.6%
- Equity multiple
- 4.11×
- Total profit
- $139,104
- Equity at exit
- $65,660
Cash invested: $44,772 (down + closing). Projections, not guarantees.
Landlord ↔ Tenant lean methodology
- Overall (STATE)
- 87 Strongly Landlord-Friendly
- State Florida
- 87 Strongly Landlord-Friendly · R+3
- County
- — inherits STATE
- City
- — inherits STATE
ZIP-level market 32618
- Home prices YoY
- 0.2%
- Active inventory
- 135
- Price-to-rent
- 5.3×
Monthly cashflow live
- Estimated rent
- $2,500 medium interval (Pro) →
- Mortgage (P&I)
- −$839
- Tax from tax record
- −$251 /mo · $3,009/yr
- Insurance
- −$67
- HOA
- −$0
- Vacancy / Maint / Mgmt
- −$525
- Net cashflow
- $819
Break-even live
Sensitivity live
| Price | -10% $910 | -5% $864 | +0% $819 | +5% $774 | +10% $729 |
|---|---|---|---|---|---|
| Rent | -10% $622 | -5% $720 | +0% $819 | +5% $918 | +10% $1,017 |
| Rate | -1.0pp $900 | -0.5pp $860 | base $819 | +0.5pp $778 | +1.0pp $735 |
UW: 25.0% down · 7.5% · 30yr · 1.5% tax · 5.0% vac · 8.0% maint · 8.0% mgmt
Financing live
Cash to close
- Down payment
- $39,975
- Closing costs
- $4,797
- Reserves months
- —
- Total cash needed
- —
Loan-product check · same deal, 3 products live
Conventional
25% down · 7.5% · 30yr
- Down + closing
- —
- Monthly P&I
- —
- Monthly cashflow
- —
- DSCR
- —
- Eligible?
- —
Personal DTI + credit; lowest rate.
DSCR
20% down · 8.5% · 30yr
- Down + closing
- —
- Monthly P&I
- —
- Monthly cashflow
- —
- DSCR
- —
- Eligible?
- —
No personal income docs; deal must DSCR.
Hard money
10% down · 12.0% · 12mo
- Down + closing
- —
- Monthly P&I
- —
- Monthly cashflow
- —
- DSCR
- —
- Eligible?
- —
Short-term bridge; refi at stabilization.
Rent comps 1 comps
| Address | Beds | Baths | Sqft | Rent | $/sqft | DOM | Units | Dist |
|---|---|---|---|---|---|---|---|---|
| 13002 SW 174th St Archer, FL | 3.0 | 2.0 | 1224 | $2,500 | $2.04 | 23d | 1 | 0.27mi |
Listing history 13 events
-
2026-05-06status Pending
-
2026-04-16status Active
-
2026-03-31status Pending
-
2026-03-18status Active
-
2026-03-04status Pending
-
2026-02-19price $159,900
-
2026-02-05price $161,900
-
2025-11-05$164,900 Active
-
2021-09-02historical
-
2021-05-07$139,999
-
2019-06-21historical
-
2019-05-28$77,000
-
2019-05-22soldstatus $45,500
ⓘ Source: listings_history table (triggers on properties + properties_extension) + one-shot
backfill from property_details.listing_events for pre-trigger history.
Tax reassessment forecast FL · Resets to sale price
- Current annual tax
- $3,009 · $251/mo
- Projected year-2 tax
- $3,009 · $251/mo
- Expected delta
- $0/yr ($0/mo · 0.0%)
ⓘ Screening estimate from a state-policy table — verify with the county assessor before closing.
Climate risk First Street
- Flood 1/10 Low FEMA zone X (unshaded) · 0% chance over 30 yrs
- Wildfire 7/10 Severe
- Heat 8/10 Severe 6 d/yr ≥108°F today · 19 d/yr by 30 yrs out
- Wind 9/10 Extreme 99% chance of damaging wind over 30 yrs
- Air quality 3/10 Moderate 4 unhealthy d/yr today · 4 by 30 yrs out
Nearby sold comps map
Loading sold comps map…
Walkable amenities ~0.75 mi
Loading nearby amenities…
Taxation est. · year 1
- Rental income
- $30,000
- − Mortgage interest
- −$8,957
- − Property taxes
- −$3,009
- − Insurance
- −$800
- − Repairs & maintenance
- −$2,400
- − Management
- −$2,400
- − Depreciation
- −$4,652
- Taxable income
- $7,783
- Est. tax owed @ 24.0%
- −$1,868
- After-tax cash flow
- $7,961/yr
For passive investors: Depreciation is non-cash, so a rental often shows a tax loss while cash-flowing — sheltering income. Rental losses are passive: they offset passive income freely, and up to $25,000/yr can offset ordinary (W-2) income if you actively participate and your MAGI is under $100k (phasing out to $0 by $150k); unused losses carry forward. On sale, claimed depreciation is recaptured at up to 25%, and gains may owe capital-gains tax (a 1031 exchange can defer both). Figures are a year-1 estimate at your 24.0% rate — not tax advice; consult a CPA.
Schools (NCES district)
- District
- Alachua
- NCES district ID
- 1200030
- Math proficiency
- 49% ▼ -9.00%
- Reading proficiency
- 54% ▼ -3.00%
- Median HH income
- $42,683
- Composite
- 43.31/100
- National rank
- #3038
- State rank
- #30 of 73 in FL
Livability — Archer
- Score
- 64/100
- State rank
- #676
- US rank
- #13964
Category grades
Schools grade is shown separately in the Schools card above.
Census & demographics
- Census place
- Archer, FL
- City population
- 7,340
- Population (ZIP)
- 7,340
Population outlook (Alachua County) Hauer SSP2
- Today (2025)
- 289,834 people
- By 2030
- 305,873 · +5.5%
- By 2040
- 335,246 · +15.7%
- By 2050
- 364,719 · +25.8%
- By 2075
- 436,665 · +50.7%
- By 2100
- 482,920 · +66.6%
Race, ethnicity, and origin ACS 2023
- Neighborhood character
- Predominantly White (65%)
- Race & ethnicity
- White 65% Black 19% Two or more races 10% Hispanic / Latino 7%
- Hispanic origin (detail)
- Mexican 5% Puerto Rican 2%
- Common ancestry
- Serbian 4% Slovak 4% Lithuanian 3%
- Foreign-born
- 7% · Canada
- Languages at home
- 93% English-only · Spanish 5% Other Asian/Pacific 1%
Political lean MEDSL · Alachua
- 2024 margin
- Strong D (+21.0) · D 59.7% · R 38.8% · Other 1.5%
- 2008→2024 swing
- -0.6pp no change · 2008: 21.6pp · 2024: 21.0pp
- All cycles
- 2024: D+21.0 2020: D+27.2 2016: D+22.5 2012: D+17.3 2008: D+21.6
Not yet ingested
- Civics
- —
Market trends
- HPI YoY
- ▲ 0.60%
- Current HPI
- 321.3332
- Rent YoY
- —
- Metro
- —
- State GDP YoY
- ▲ 3.28%
- F500 in state
- 36
Industry mix (Fortune 500 HQ in FL)
| Industry | F500 HQs | Revenue |
|---|---|---|
| Industrial Technology | 2 | $29B |
|
||
| Insurance | 2 | $17B |
|
||
| Retail | 1 | $60B |
|
||
| Technology Distribution | 1 | $58B |
|
||
| Homebuilding | 1 | $35B |
|
||
| Technology Manufacturing | 1 | $35B |
|
||
Price history
+251.4% since first listed13 events — show timeline
- 2026-05-06 Pending — Stellar MLS as Distributed by MLS Grid
- 2026-04-16 Relisted — Stellar MLS as Distributed by MLS Grid
- 2026-03-31 Pending — Stellar MLS as Distributed by MLS Grid
- 2026-03-18 Relisted — Stellar MLS as Distributed by MLS Grid
- 2026-03-04 Pending — Stellar MLS as Distributed by MLS Grid
- 2026-02-19 Price Changed $159,900 Stellar MLS as Distributed by MLS Grid
- 2026-02-05 Price Changed $161,900 Stellar MLS as Distributed by MLS Grid
- 2025-11-05 Listed $164,900 Stellar MLS as Distributed by MLS Grid
- 2021-09-02 Listing Removed — Stellar MLS as Distributed by MLS Grid
- 2021-05-07 Listed $139,999 Stellar MLS as Distributed by MLS Grid
- 2019-06-21 Listing Removed — Stellar MLS as Distributed by MLS Grid
- 2019-05-28 Listed $77,000 Stellar MLS as Distributed by MLS Grid
- 2019-05-22 Sold (Public Records) $45,500 Public Records
Property tax history
+14.1%/yrLatest (2025): $3,009 · +10.3% YoY. Source: county tax records.
Cash-flow waterfall
monthlySold comps — $/sqft
last 12 mo · ≤1 miLoading sold comps…