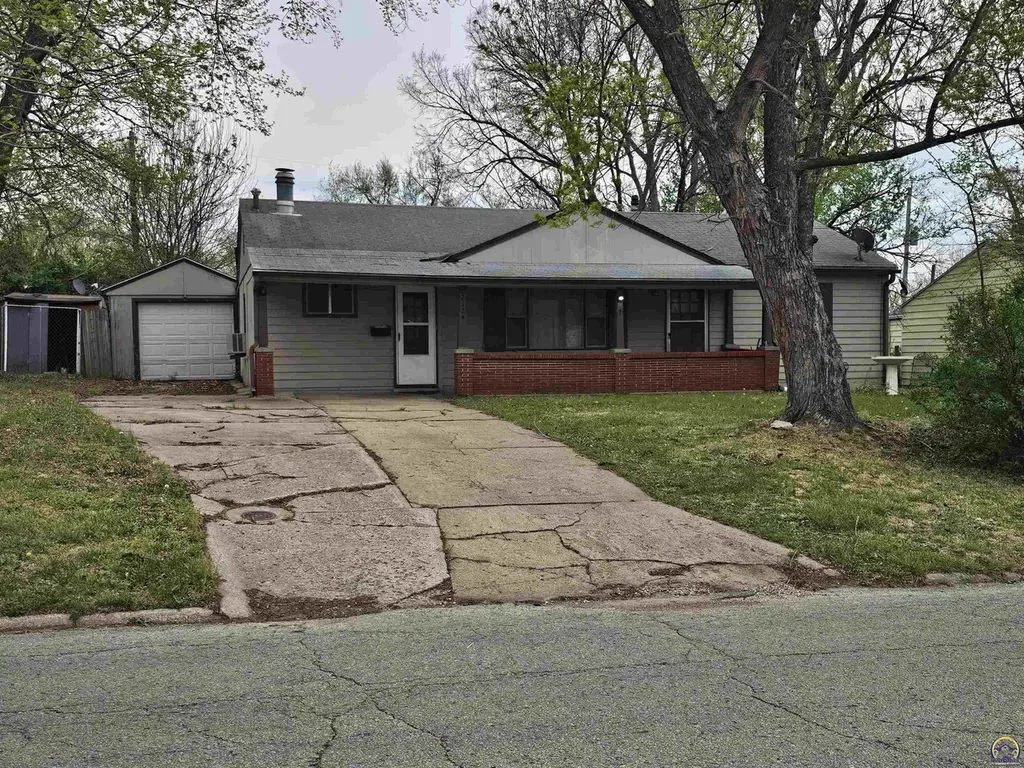
2124 SW Morningside Rd · Topeka, KS
Flood risk 1/10 · Minimal
- FEMA flood zone
- X (unshaded)
- Chance of flooding over 30 yrs
- 0.0%
- Est. flood insurance / yr
- $507 – $1,088
Fire risk 1/10 · Minimal
- Est. fire insurance / yr
- $1,154 – $2,142
Heat risk 4/10 · Minor
- Hot days now (above 107°F)
- 7 days/yr
- Hot days in 30 yrs
- 17 days/yr
Wind risk 2/10 · Minimal
- Chance of severe wind over 30 yrs
- —
Air-quality risk 3/10 · Minor
- Unhealthy air days now
- 3 days/yr
- Unhealthy air days in 30 yrs
- 4 days/yr
Risk factors via First Street. Map © Google.
Why this score? — see what drove the D+ grade
The composite is a weighted blend of 9 inputs, each scored 0–100. Each bar is that input's sub-score; the figure is the points it added to the 100-point composite (weight × sub-score).
- Cash flow +19.2/30.0
- ARV discount +7.5/15.0
- DSCR +6.0/10.0
- Rent growth +5.0/5.0
- 1% rule +4.4/10.0
- Livability +3.5/5.0
- Condition / age +2.5/5.0
- Schools +1.7/10.0
- Appreciation +0.0/10.0
$162,820
🖨 Deal sheet 📄 Offer letter ✓ Due diligence
Listing remarks
Nice ranch style home with garage near Topeka West High School. Recently installed interior paint. Also includes a working wood burning fireplace with blower. Seller is licensed real estate agent in Kansas. This property is being sold as is and is one of six properties being sold in a package. Other properties are: 107 SW Taylor St. , 713 SW Clay St. , 922 SW Cambridge Ave. , 2323 SW Huntoon St. and 400 SW Orchard St. All properties estimated value by CMA of $799,342. We will consider all reasonable serious offers.
Key facts
- Ranch style home
- 7,405 sq ft lot
- Garage
Tags
Property features AI
Exterior
- Parking: Detached 1-car garage
- Utilities: Public water; Public sewer
- Home design: Single family residence; Residential property
- Construction: Frame construction; Composition roof
- Exterior features: Partial fenced yard
Interior
- Flooring: Vinyl flooring; Carpet
- Bathrooms: 2 full bathrooms
- Heating & cooling: Window unit(s) for cooling
- Interior features: Pantry
- Laundry & utility: Laundry on main level; Gas water heater
Neighborhood map
What this means for you Summary
Snapshot
- This is a 3-bed/2.0-bath single-family listed at $163k.
Deal economics
- At list price, monthly cash flow is $175 ($2k/yr) — positive.
- The deal already cash-flows at list — no discount required.
- To meet the 1% rule (rent ≥ 1% of price), the offer needs to be $154k (5.7% below list).
- Recommended offer: $154k (5.7% below list) — sets the bar for 1% rule.
- Cap rate 7.6% vs local median 4.3% in Topeka — top-decile yield for the area; either an underpriced asset or a hidden risk that comps aren't pricing in. Stress-test before assuming the spread holds.
Location & tenants
- Location reads 69/100 on livability (#195 in KS) — a middle-class / working-renter tenant base. Strengths: cost of living A+, housing A+, health & safety A+; Watch: employment C-, crime F, commute F.
- Topeka Public Schools (urban): math 17% / reading 23% proficiency, ranked #158 of 169 in KS (top 94%) — low school quality limits family demand, transient renter base, plan for 1-2y turnover; 69% free/reduced lunch — lower-income household profile, screen leases tightly.
- Zoned schools: Marjorie French Middle School (math 23% / reading 30%, grade F, #98 of 219 statewide, top 44%, 436 students, 70% FRL); Topeka West High (math 13% / reading 20%, grade F, #244 of 327 statewide, top 75%, 1,085 students, 59% FRL) — zoned schools at 64% FRL track the district average.
- Market conditions: Rents rising fast (+9.9%/yr); 137 active listings in the ZIP; 9 comparable units currently listed for rent nearby; rentals at typical pace (median 21d on market — plan ~3-4 weeks tenant-placement turnaround); 219 units permitted in Shawnee County in 2024 (25 in 5+ unit buildings).
Forward outlook
- Local home prices are declining (-3.0%/yr); year-one equity from $1k of loan paydown is wiped out by about $5k of value loss. Plan a longer hold.
- Shawnee County population projected to shrink 7% by 2050 — rents likely to lag national; underwrite the cash flow, not the appreciation.
- At projected returns (-3.0% appreciation + 8.0% rent growth), your $46k cash investment doubles in ~10 years — after that, you're playing with house money.
Negotiation context
- It's been on market 30 days — a 2% lower offer ($160k) is reasonable based on typical stale-listing flexibility.
- Current owner paid $42k; list at $163k implies a 292% gain — meaningful room to come down on a strong offer.
Risks & watch-outs
- Watch-outs: built in 1952 — expect roof / HVAC / electrical / plumbing capex.
Questions for the listing agent
- Built in 1952 — when were the roof, HVAC, electrical panel, plumbing, and water heater last replaced?
- Is there a deadline driving the sale (1031 exchange, divorce, estate, relocation)? That informs how much negotiation room exists.
- Schools are D-rated, which usually means shorter tenancies and higher turnover. Who's the typical renter profile here, and what's been the actual vacancy rate?
- Crime grade is F in this area — have there been break-ins, vandalism, or insurance claims at this property in the last 3 years? What carrier currently insures it and at what premium?
- The area grade is low — what's the realistic commute time and amenity access for the typical tenant pool here? Any planned neighborhood developments (good or bad) we should know about?
- What's the average days-on-market for RENTAL listings here right now (not sales)? A rising rental-DOM trend means longer vacancies and softer asking-rent achievability than the comps imply.
- What's the recent tenant-quality profile in this submarket — average credit score on applications, eviction rate, late-payment / NSF rate, and stable-employment percentage? A property-management company in the area should have these aggregated.
- How much new for-sale + rental construction is in the pipeline within 1–3 miles? Heavy new supply typically softens prices + rents 12–24 months out; constrained supply supports both.
Investment metrics
- 1% rule
- 0.94% ✗
- Cap rate
- 7.58%
- Cash-on-cash
- 4.60%
- DSCR
- 1.20
- GRM
- 8.8
CMA / ARV
- ARV (on-the-fly)
- $96,120
- Comps found
- 1
Show comp detail 1 sale within ~0.75 mi
| Address | Dist | Beds/Ba | Sqft | Sold | Price | $/sf | Match |
|---|---|---|---|---|---|---|---|
| 2612 SW Morningside Rd | 0.55mi | 3/1.0 | 1,152 (-14%) | 19mo | $83,337 | $72 | 32 |
Match score weights: distance 35% · size 25% · config 20% · recency 20%. Top-matched comps best support the ARV.
Projected returns pro-forma
-3.0% appreciation · 8.0% rent growth · sell at horizon
- IRR
- -4.0%
- Equity multiple
- 0.84×
- Total profit
- $-7,171
- Equity at exit
- $24,277
- IRR
- 10.4%
- Equity multiple
- 1.98×
- Total profit
- $44,902
- Equity at exit
- $14,078
Cash invested: $45,590 (down + closing). Projections, not guarantees.
Landlord ↔ Tenant lean methodology
- Overall (STATE)
- 83 Strongly Landlord-Friendly
- State Kansas
- 83 Strongly Landlord-Friendly · R+10
- County
- — inherits STATE
- City
- — inherits STATE
ZIP-level market 66614
- Rents YoY
- 9.9%
- Active inventory
- 137
- Price-to-rent
- 8.8×
Monthly cashflow live
- Estimated rent
- $1,536 high interval (Pro) →
- Mortgage (P&I)
- −$854
- Tax from tax record
- −$117 /mo · $1,403/yr
- Insurance
- −$68
- HOA
- −$0
- Vacancy / Maint / Mgmt
- −$323
- Net cashflow
- $175
Break-even live
UW: 25.0% down · 7.5% · 30yr · 1.5% tax · 5.0% vac · 8.0% maint · 8.0% mgmt
Financing live
Cash to close
- Down payment
- $40,705
- Closing costs
- $4,885
- Reserves months
- —
- Total cash needed
- —
Loan-product check · same deal, 3 products live
Conventional
25% down · 7.5% · 30yr
- Down + closing
- —
- Monthly P&I
- —
- Monthly cashflow
- —
- DSCR
- —
- Eligible?
- —
Personal DTI + credit; lowest rate.
DSCR
20% down · 8.5% · 30yr
- Down + closing
- —
- Monthly P&I
- —
- Monthly cashflow
- —
- DSCR
- —
- Eligible?
- —
No personal income docs; deal must DSCR.
Hard money
10% down · 12.0% · 12mo
- Down + closing
- —
- Monthly P&I
- —
- Monthly cashflow
- —
- DSCR
- —
- Eligible?
- —
Short-term bridge; refi at stabilization.
Rent comps 9 comps
| Address | Beds | Baths | Sqft | Rent | $/sqft | DOM | Units | Dist |
|---|---|---|---|---|---|---|---|---|
| 2320 SW Valley Brook Ln Topeka, KS | 3.0 | 1.0 | 1200 | $1,500 | $1.25 | 21d | 1 | 0.27mi |
| 2310 SW Fairlawn Rd Topeka, KS | 2.0 | 1.0 | 912 | $1,095 | $1.20 | 21d | 1 | 0.33mi |
| 2211 SW Burnett Rd Topeka, KS | 3.0 | 1.0 | 1239 | $1,595 | $1.29 | 21d | 1 | 0.35mi |
| 5237 SW 20th Ter Topeka, KS | 2.0 | 2.0 | 1050 | $1,205 | $1.15 | 21d | 1 | 0.39mi |
| 1700 SW Amhurst Rd Topeka, KS | 3.0 | 1.5 | 1118 | $1,350 | $1.21 | 21d | 1 | 0.66mi |
| 5733 SW 20th St Topeka, KS | 3.0 | 2.0 | 1450 | $1,395 | $0.96 | 21d | 1 | 0.76mi |
| 2920 SW Gage Blvd Topeka, KS | 2.0 | 2.0 | 925 | $850 | $0.92 | 21d | 1 | 1.22mi |
| 4110 SW Twilight Dr Topeka, KS | 2.0 | 1.5 | 1746 | $1,150 | $0.66 | 21d | 1 | 1.35mi |
| 3211 SW Twilight Ct Topeka, KS | 1.0–3.0 | 1.0–2.0 | 965 | $1,245 | $1.29 | 21d | 6 | 1.38mi |
Listing history 18 events
-
2026-06-19days on market $162,820 Active 30 DOM
-
2026-06-18days on market $162,820 Active 29 DOM
-
2026-06-17days on market $162,820 Active 28 DOM
-
2026-06-16days on market $162,820 Active 27 DOM
-
2026-06-15days on market $162,820 Active 26 DOM
-
2026-06-14days on market $162,820 Active 24 DOM
-
2026-06-13days on market $162,820 Active 23 DOM
-
2026-06-10days on market $162,820 Active 21 DOM
-
2026-06-09days on market $162,820 Active 20 DOM
-
2026-06-08days on market $162,820 Active 19 DOM
-
2026-06-07days on market $162,820 Active 18 DOM
-
2026-06-02days on market $162,820 Active 13 DOM
-
2026-06-01days on market $162,820 Active 12 DOM
-
2026-05-31days on market $162,820 Active 11 DOM
-
2026-05-30days on market $162,820 Active 10 DOM
-
2026-05-20$162,820 Active
-
2022-11-01soldstatus
-
1987-07-01soldstatus $41,500
ⓘ Source: listings_history table (triggers on properties + properties_extension) + one-shot
backfill from property_details.listing_events for pre-trigger history.
Tax reassessment forecast KS · Resets to sale price
- Current annual tax
- $1,403 · $117/mo
- Projected year-2 tax
- $2,296 · $191/mo
- Expected delta
- +$893/yr (+$74/mo · 63.6%)
ⓘ Screening estimate from a state-policy table — verify with the county assessor before closing.
Climate risk First Street
- Flood 1/10 Low FEMA zone X (unshaded) · 0% chance over 30 yrs
- Wildfire 1/10 Low
- Heat 4/10 Moderate 7 d/yr ≥107°F today · 17 d/yr by 30 yrs out
- Wind 2/10 Low
- Air quality 3/10 Moderate 3 unhealthy d/yr today · 4 by 30 yrs out
Nearby sold comps map
Loading sold comps map…
Walkable amenities ~0.75 mi
Loading nearby amenities…
Taxation est. · year 1
- Rental income
- $18,430
- − Mortgage interest
- −$9,120
- − Property taxes
- −$1,403
- − Insurance
- −$814
- − Repairs & maintenance
- −$1,474
- − Management
- −$1,474
- − Depreciation
- −$4,737
- Taxable loss
- −$593
- Est. tax savings @ 24.0%
- +$142
- After-tax cash flow
- $2,239/yr
For passive investors: Depreciation is non-cash, so a rental often shows a tax loss while cash-flowing — sheltering income. Rental losses are passive: they offset passive income freely, and up to $25,000/yr can offset ordinary (W-2) income if you actively participate and your MAGI is under $100k (phasing out to $0 by $150k); unused losses carry forward. On sale, claimed depreciation is recaptured at up to 25%, and gains may owe capital-gains tax (a 1031 exchange can defer both). Figures are a year-1 estimate at your 24.0% rate — not tax advice; consult a CPA.
Schools (NCES district)
- District
- Topeka Public Schools
- NCES district ID
- 2012260
- Math proficiency
- 17% ▼ -8.00%
- Reading proficiency
- 23% ▼ -2.00%
- Median HH income
- $37,405
- Composite
- 16.69/100
- National rank
- #9167
- State rank
- #158 of 169 in KS
Livability — Topeka
- Score
- 69/100
- State rank
- #195
- US rank
- #8848
Category grades
Schools grade is shown separately in the Schools card above.
Census & demographics
- Census place
- Topeka, KS
- County
- Shawnee County · 118,130 people
- City population
- 118,130
- Metro
- Topeka, KS
- Population (ZIP)
- 32,538
- Household income
- $71,377
- Rent vs Own
- Severe rent burden
- 852.0
Population outlook (Shawnee County) Hauer SSP2
- Today (2025)
- 179,277 people
- By 2030
- 177,762 · -0.8%
- By 2040
- 172,341 · -3.9%
- By 2050
- 166,330 · -7.2%
- By 2075
- 152,417 · -15.0%
- By 2100
- 134,782 · -24.8%
Race, ethnicity, and origin ACS 2023
- Neighborhood character
- Predominantly White (79%)
- Race & ethnicity
- White 79% Hispanic / Latino 9% Two or more races 7% Black 4% Asian 3%
- Hispanic origin (detail)
- Mexican 8%
- Common ancestry
- Italian 3% Slovak 2% Romanian 2%
- Foreign-born
- 5% · Canada, China
- Languages at home
- 94% English-only · Spanish 3% Other Asian/Pacific 1% Other Indo-European 1%
Political lean MEDSL · Shawnee
- 2024 margin
- Toss-up / Even · D 49.3% · R 48.8% · Other 2.0%
- 2008→2024 swing
- +0.8pp no change · 2008: -0.3pp · 2024: 0.5pp
- All cycles
- 2024: D+0.5 2020: D+3.0 2016: R+2.8 2012: R+1.7 2008: R+0.3
Not yet ingested
- Civics
- —
Market trends
- HPI YoY
- ▼ -160.56%
- Current HPI
- 225.5592
- Rent YoY
- ▲ 9.88%
- Metro
- Topeka, KS
- State GDP YoY
- —
- F500 in state
- 0
Price history
+292.3% since first listed3 events — show timeline
- 2026-05-20 Listed $162,820 Sunflower MLS as distributed by MLS GRID
- 2022-11-01 Sold (Public Records) — Public Records
- 1987-07-01 Sold (Public Records) $41,500 Public Records
Property tax history
+1.7%/yrLatest (2025): $1,403 · +10.9% YoY. Source: county tax records.
Cash-flow waterfall
monthlySold comps — $/sqft
last 12 mo · ≤1 miLoading sold comps…