 🏗️ New Construction
Cibola Plan · San Antonio, TX
Flood risk 1/10 · Minimal
- FEMA flood zone
- X (unshaded)
- Chance of flooding over 30 yrs
- 0.0%
- Est. flood insurance / yr
- $507 – $1,088
Fire risk 2/10 · Minimal
- Est. fire insurance / yr
- $1,222 – $2,270
Heat risk 8/10 · Major
- Hot days now (above 109°F)
- 7 days/yr
- Hot days in 30 yrs
- 23 days/yr
Wind risk 8/10 · Major
- Chance of severe wind over 30 yrs
- 80.0%
Air-quality risk 1/10 · Minimal
- Unhealthy air days now
- 0 days/yr
- Unhealthy air days in 30 yrs
- 0 days/yr
Risk factors via First Street. Map © Google.
Why this score? — see what drove the F grade
The composite is a weighted blend of 9 inputs, each scored 0–100. Each bar is that input's sub-score; the figure is the points it added to the 100-point composite (weight × sub-score).
- ARV discount +7.5/15.0
- Cash flow +5.4/30.0
- Condition / age +5.0/5.0
- Livability +4.0/5.0
- Schools +1.9/10.0
- Rent growth +1.7/5.0
- 1% rule +1.0/10.0
- DSCR +0.0/10.0
- Appreciation +0.0/10.0
$176,999
🖨 Deal sheet (PDF) 📄 Offer letter ✓ Due diligence
Listing remarks MLS
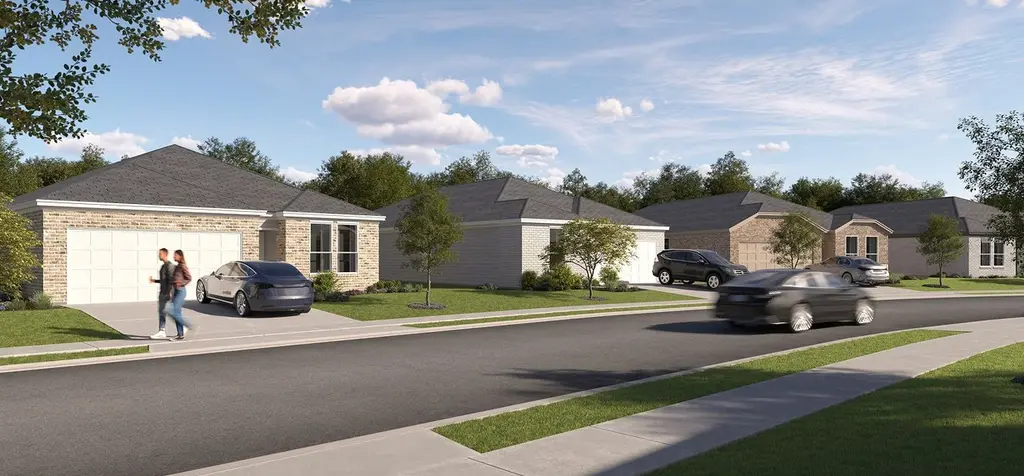
The Wellton Collection is a new series of single-family homes in the Grace Gardens masterplan in San Antonio, TX, offering affordable new home options with a variety of floorplan designs. Residents will enjoy proximity to Loop 410 for easy access to local shopping, dining and entertainment options. Outdoor recreation is a short drive away on Calaveras Lake, and the community is located near Brooks City Base, perfect for military families and personnel.
Key facts
- Access to dining
- Garage
- Listed 121 days
Tags
Neighborhood map
What this means for you Summary
Snapshot
- This is a 4-bed/2.5-bath single-family listed at $177k. Condition is rated excellent.
Deal economics
- At list price, monthly cash flow is $-623 ($-7k/yr) — negative.
- The deal already cash-flows at list — no discount required.
- To meet the 1% rule (rent ≥ 1% of price), the offer needs to be $170k (3.8% below list).
- Recommended offer: $156k (12.0% below list) — sets the bar for market timing.
Location & tenants
- Location reads 80/100 on livability (#31 in TX, #1,616 nationally) — a professional / high-income tenant draw. Strengths: amenities A+, commute A+, cost of living A+; Watch: crime F.
- East Central ISD (rural): math 16% / reading 25% proficiency, ranked #758 of 826 in TX (top 92%) — low school quality limits family demand, transient renter base, plan for 1-2y turnover; 61% free/reduced lunch — lower-income household profile, screen leases tightly.
- Zoned schools: Harmony El (math 21% / reading 17%, grade F, #3,739 of 4,322 statewide, top 87%, 684 students, 75% FRL); Legacy Middle (math 13% / reading 24%, grade F, #1,478 of 1,662 statewide, top 90%, 1,137 students, 58% FRL); East Central H S (math 21% / reading 28%, grade F, #1,264 of 1,632 statewide, top 82%, 3,252 students, 52% FRL) — zoned schools at 62% FRL track the district average.
- Market conditions: Rents falling (-3.4%/yr); 329 active listings in the ZIP; 11 comparable units currently listed for rent nearby; rentals at typical pace (median 26d on market — plan ~3-4 weeks tenant-placement turnaround); 8,308 units permitted in Bexar County in 2024 (2,506 in 5+ unit buildings).
- This rent runs 39% of the median local income ($52k/yr) — at the standard rent-burdened threshold; future hikes will face affordability resistance.
Forward outlook
- Local home prices are declining (-3.0%/yr); year-one equity from $2k of loan paydown is wiped out by about $9k of value loss. Plan a longer hold.
- Bexar County population projected at +50% by 2050 — long-run rental-demand tailwind backs the buy-and-hold thesis.
Negotiation context
- It's been on market 121 days — a 12% lower offer ($156k) is reasonable based on typical stale-listing flexibility.
Risks & watch-outs
- Climate carrying-cost: severe wind risk, 80% chance of damaging wind over 30y; extreme-heat days projected 7→23/yr by 2055 (HVAC capex compounding) — expect insurance premiums to compound above CPI over the hold.
Questions for the listing agent
- What do current leases actually rent for vs. the listed asking? Can we see a recent rent roll and the last 12 months of T-12 income?
- It's been on market 121 days. Have you received any prior offers? Is the seller open to a 12% concession, seller financing, or rate buy-down credit?
- Why hasn't it sold? Are there any deal-killer items the seller is aware of (foundation, flood, title, zoning, code violations)?
- Is there a deadline driving the sale (1031 exchange, divorce, estate, relocation)? That informs how much negotiation room exists.
- Crime grade is F in this area — have there been break-ins, vandalism, or insurance claims at this property in the last 3 years? What carrier currently insures it and at what premium?
- The area grade is low — what's the realistic commute time and amenity access for the typical tenant pool here? Any planned neighborhood developments (good or bad) we should know about?
- What's the average days-on-market for RENTAL listings here right now (not sales)? A rising rental-DOM trend means longer vacancies and softer asking-rent achievability than the comps imply.
- What's the recent tenant-quality profile in this submarket — average credit score on applications, eviction rate, late-payment / NSF rate, and stable-employment percentage? A property-management company in the area should have these aggregated.
- How much new for-sale + rental construction is in the pipeline within 1–3 miles? Heavy new supply typically softens prices + rents 12–24 months out; constrained supply supports both.
Investment metrics
- 1% rule
- 0.60% ✗
- Cap rate
- 3.67%
- Cash-on-cash
- -9.37%
- DSCR
- 0.58
- GRM
- 13.9
CMA / ARV
- ARV (median comp)
- $284,732
- List price
- $176,999
- Delta
- -37.84%
- Verdict
- UNDERPRICED
- Comps
- 20 within 1.0 mi
Show comp detail 12 sales within ~0.75 mi
| Address | Dist | Beds/Ba | Sqft | Sold | Price | $/sf | Match |
|---|---|---|---|---|---|---|---|
| 8404 Aloe Vera Trce | 0.22mi | 3/2.0 (-1) | 1,485 (-3%) | 1mo | $279,990 | $189 | 76 |
| 8507 Aloe Vera Trce | 0.14mi | 3/2.0 (-1) | 1,642 (+7%) | 3mo | $273,990 | $167 | 72 |
| 8441 Roadrunner Psge | 0.18mi | 4/2.0 | 1,687 (+10%) | 1mo | $304,990 | $181 | 72 |
| 8420 Roadrunner Psge | 0.21mi | 4/2.0 | 1,687 (+10%) | 2mo | $288,990 | $171 | 70 |
| 8224 Foxtail Frk | 0.27mi | 3/2.0 (-1) | 1,642 (+7%) | 1mo | $274,990 | $167 | 68 |
| 5007 Agave Blue Ln | 0.33mi | 3/2.0 (-1) | 1,642 (+7%) | 1mo | $289,990 | $177 | 65 |
| 5035 Cacti Orch | 0.27mi | 3/2.0 (-1) | 1,687 (+10%) | 1mo | $287,990 | $171 | 63 |
| 8216 Foxtail Frk | 0.28mi | 3/2.0 (-1) | 1,687 (+10%) | 1mo | $294,990 | $175 | 63 |
| 5051 Agave Blue Ln | 0.34mi | 3/2.0 (-1) | 1,687 (+10%) | 2mo | $299,990 | $178 | 59 |
| 8867 Osprey Trl | 0.72mi | 4/2.0 | 1,600 (+4%) | 2mo | $213,999 | $134 | 55 |
| 4834 Sahara Vlys | 0.46mi | 3/2.0 (-1) | 1,388 (-10%) | 1mo | $262,385 | $189 | 55 |
| 8875 Osprey Trl | 0.72mi | 3/2.0 (-1) | 1,402 (-9%) | 3mo | $191,999 | $137 | 43 |
Match score weights: distance 35% · size 25% · config 20% · recency 20%. Top-matched comps best support the ARV.
Projected returns pro-forma
-3.0% appreciation · 0.0% rent growth · sell at horizon
- IRR
- -36.3%
- Equity multiple
- -0.14×
- Total profit
- $-90,763
- Equity at exit
- $42,454
- IRR
- -73.4%
- Equity multiple
- -0.87×
- Total profit
- $-149,281
- Equity at exit
- $24,618
Cash invested: $79,725 (down + closing). Projections, not guarantees.
Landlord ↔ Tenant lean methodology
- Overall (STATE)
- 87 Strongly Landlord-Friendly
- State Texas
- 87 Strongly Landlord-Friendly · R+5
- County
- — inherits STATE
- City
- — inherits STATE
ZIP-level market 78223
- Home prices YoY
- -16.4%
- Rents YoY
- -3.4%
- Active inventory
- 329
- Price-to-rent
- 8.7×
Monthly cashflow live
- Estimated rent
- $1,703 high interval (Pro) →
- Mortgage (P&I)
- −$1,493
- Tax est. 1.5%
- −$356 /mo · $4,271/yr
- Insurance
- −$119
- HOA
- −$0
- Vacancy / Maint / Mgmt
- −$358
- Net cashflow
- $-623
Break-even live
Sensitivity live
| Price | -10% $-426 | -5% $-524 | +0% $-623 | +5% $-721 | +10% $-819 |
|---|---|---|---|---|---|
| Rent | -10% $-757 | -5% $-690 | +0% $-623 | +5% $-555 | +10% $-488 |
| Rate | -1.0pp $-479 | -0.5pp $-550 | base $-623 | +0.5pp $-696 | +1.0pp $-772 |
UW: 25.0% down · 7.5% · 30yr · 1.5% tax · 5.0% vac · 8.0% maint · 8.0% mgmt
Financing live
Cash to close
- Down payment
- $71,183
- Closing costs
- $8,542
- Reserves months
- —
- Total cash needed
- —
Loan-product check · same deal, 3 products live
Conventional
25% down · 7.5% · 30yr
- Down + closing
- —
- Monthly P&I
- —
- Monthly cashflow
- —
- DSCR
- —
- Eligible?
- —
Personal DTI + credit; lowest rate.
DSCR
20% down · 8.5% · 30yr
- Down + closing
- —
- Monthly P&I
- —
- Monthly cashflow
- —
- DSCR
- —
- Eligible?
- —
No personal income docs; deal must DSCR.
Hard money
10% down · 12.0% · 12mo
- Down + closing
- —
- Monthly P&I
- —
- Monthly cashflow
- —
- DSCR
- —
- Eligible?
- —
Short-term bridge; refi at stabilization.
Rent comps 11 comps
| Address | Beds | Baths | Sqft | Rent | $/sqft | DOM | Units | Dist |
|---|---|---|---|---|---|---|---|---|
| 8563 Redhawk Loop San Antonio, TX | 3.0 | 2.5 | 1788 | $1,800 | $1.01 | 16d | 1 | 0.41mi |
| 7814 Annex St San Antonio, TX | 3.0 | 2.0 | 1459 | $1,600 | $1.10 | 25d | 1 | 0.72mi |
| 7722 Blue Gulf Dr San Antonio, TX | 3.0 | 2.0 | 1464 | $1,575 | $1.08 | 25d | 1 | 0.84mi |
| 5727 Coopers Xing San Antonio, TX | 3.0 | 2.0 | 1127 | $2,400 | $2.13 | 23d | 1 | 0.87mi |
| 7246 Meadow Acres San Antonio, TX | 3.0 | 2.0 | 1450 | $1,470 | $1.01 | 25d | 1 | 0.91mi |
| 7822 Bur Oak Way San Antonio, TX | 3.0 | 2.0 | 1910 | $1,900 | $0.99 | 45d | 1 | 1.39mi |
| 5107 Moni Rock Dr San Antonio, TX | 3.0 | 2.5 | 1529 | $1,585 | $1.04 | 25d | 1 | 1.41mi |
| 10319 Clearwater Way San Antonio, TX | 3.0 | 2.5 | 1529 | $1,500 | $0.98 | 6d | 1 | 1.42mi |
| 6818 Fort Bnd San Antonio, TX | 3.0 | 2.0 | 1866 | $1,895 | $1.02 | 25d | 1 | 1.47mi |
| 3618 Booker Trl San Antonio, TX | 3.0 | 2.0 | 1217 | $1,475 | $1.21 | 45d | 1 | 1.49mi |
| 10366 Clearwater Way San Antonio, TX | 3.0 | 2.5 | 1529 | $1,550 | $1.01 | 12d | 1 | 1.50mi |
Listing history 16 events
-
2026-06-21days on market $176,999 Active 121 DOM
-
2026-06-18days on market $176,999 Active 118 DOM
-
2026-06-17days on market $176,999 Active 117 DOM
-
2026-06-16days on market $176,999 Active 116 DOM
-
2026-06-15days on market $176,999 Active 115 DOM
-
2026-06-13days on market $176,999 Active 113 DOM
-
2026-06-09days on market $176,999 Active 109 DOM
-
2026-06-08days on market $176,999 Active 108 DOM
-
2026-06-07days on market $176,999 Active 107 DOM
-
2026-06-04days on market $176,999 Active 104 DOM
-
2026-06-03days on market $176,999 Active 103 DOM
-
2026-06-02pricedays on market $176,999 Active 102 DOM
-
2026-06-01days on market $177,999 Active 101 DOM
-
2026-05-31days on market $177,999 Active 100 DOM
-
2026-05-08price $177,999 456-char remark
Show marketing remark (456 chars)
The Wellton Collection is a new series of single-family homes in the Grace Gardens masterplan in San Antonio, TX, offering affordable new home options with a variety of floorplan designs. Residents will enjoy proximity to Loop 410 for easy access to local shopping, dining and entertainment options. Outdoor recreation is a short drive away on Calaveras Lake, and the community is located near Brooks City Base, perfect for military families and personnel.
-
2026-02-20$178,999 Active 456-char remark
Show marketing remark (456 chars)
The Wellton Collection is a new series of single-family homes in the Grace Gardens masterplan in San Antonio, TX, offering affordable new home options with a variety of floorplan designs. Residents will enjoy proximity to Loop 410 for easy access to local shopping, dining and entertainment options. Outdoor recreation is a short drive away on Calaveras Lake, and the community is located near Brooks City Base, perfect for military families and personnel.
ⓘ Source: listings_history table (triggers on properties + properties_extension) + one-shot
backfill from property_details.listing_events for pre-trigger history.
Climate risk First Street
- Flood 1/10 Low FEMA zone X (unshaded) · 0% chance over 30 yrs
- Wildfire 2/10 Low
- Heat 8/10 Severe 7 d/yr ≥109°F today · 23 d/yr by 30 yrs out
- Wind 8/10 Severe 80% chance of damaging wind over 30 yrs
- Air quality 1/10 Low 0 unhealthy d/yr today · 0 by 30 yrs out
Nearby sold comps map
Loading sold comps map…
Walkable amenities ~0.75 mi
Loading nearby amenities…
Taxation est. · year 1
- Rental income
- $20,431
- − Mortgage interest
- −$15,949
- − Property taxes
- −$4,271
- − Insurance
- −$1,424
- − Repairs & maintenance
- −$1,634
- − Management
- −$1,634
- − Depreciation
- −$8,283
- Taxable loss
- −$12,765
- Est. tax savings @ 24.0%
- +$3,064
- After-tax cash flow
- $-4,409/yr
For passive investors: Depreciation is non-cash, so a rental often shows a tax loss while cash-flowing — sheltering income. Rental losses are passive: they offset passive income freely, and up to $25,000/yr can offset ordinary (W-2) income if you actively participate and your MAGI is under $100k (phasing out to $0 by $150k); unused losses carry forward. On sale, claimed depreciation is recaptured at up to 25%, and gains may owe capital-gains tax (a 1031 exchange can defer both). Figures are a year-1 estimate at your 24.0% rate — not tax advice; consult a CPA.
Condition & rehab AI · 1 photo
This single-family home in San Antonio, TX, is in excellent condition with no visible repairs or maintenance needed. It offers a great opportunity for investors looking to maximize both resale and rental value through minor updates.
Value-add opportunities
- Both Painting exterior and interior — Enhances curb appeal and interior aesthetics
- Both Landscaping improvements — Enhances curb appeal and adds value
- Both New flooring in bathrooms and kitchen — Improves functionality and aesthetics
- Both New paint in interior walls — Enhances interior aesthetics and value
Renovation cost estimate screening
Value-add ROI direction
- Both Painting exterior and interior — Enhances curb appeal and interior aesthetics ↑
- Both Landscaping improvements — Enhances curb appeal and adds value ↑
- Both New flooring in bathrooms and kitchen — Improves functionality and aesthetics ↑
- Both New paint in interior walls — Enhances interior aesthetics and value ↑
ⓘ Cost ranges are severity-bucket heuristics (US national rule-of-thumb). Get contractor quotes + a written scope before underwriting a rehab budget.
Schools (NCES district)
- District
- East Central ISD
- NCES district ID
- 4817850
- Math proficiency
- 16% ▼ -12.00%
- Reading proficiency
- 25% ▼ -6.00%
- Median HH income
- $53,941
- Composite
- 18.67/100
- National rank
- #8887
- State rank
- #758 of 826 in TX
Livability — San Antonio
- Score
- 80/100
- State rank
- #31
- US rank
- #1616
Category grades
Schools grade is shown separately in the Schools card above.
Census & demographics
- County
- Bexar County · 1,990,555 people
- City population
- 1,806,925
- Metro
- San Antonio-New Braunfels, TX
- Population (ZIP)
- 58,983
- Household income
- $52,088
- Rent vs Own
- Severe rent burden
- 2809.0
Population outlook (Bexar County) Hauer SSP2
- Today (2025)
- 2,336,851 people
- By 2030
- 2,560,728 · +9.6%
- By 2040
- 3,020,569 · +29.3%
- By 2050
- 3,493,522 · +49.5%
- By 2075
- 4,668,459 · +99.8%
- By 2100
- 5,533,242 · +136.8%
Race, ethnicity, and origin ACS 2023
- Neighborhood character
- Predominantly Hispanic (76%)
- Race & ethnicity
- Hispanic / Latino 76% Two or more races 28% White 16% Black 5% Asian 2% Native American 1%
- Hispanic origin (detail)
- Mexican 67%
- Common ancestry
- Lithuanian 2% Romanian 1% Slovak 1%
- Foreign-born
- 10% · Canada, Vietnam
- Languages at home
- 63% English-only · Spanish 36%
Political lean MEDSL · Bexar
- 2024 margin
- Lean D (+9.8) · D 54.3% · R 44.6% · Other 1.1%
- 2008→2024 swing
- +4.2pp toward D · 2008: 5.6pp · 2024: 9.8pp
- All cycles
- 2024: D+9.8 2020: D+18.2 2016: D+13.5 2012: D+4.6 2008: D+5.6
Not yet ingested
- Civics
- —
Market trends
- HPI YoY
- ▼ -52.06%
- Current HPI
- 265.2235
- Rent YoY
- ▼ -3.36%
- Metro
- San Antonio-New Braunfels, TX
- State GDP YoY
- ▲ 3.95%
- F500 in state
- 110
Industry mix (Fortune 500 HQ in TX)
| Industry | F500 HQs | Revenue |
|---|---|---|
| Energy | 16 | $1,198B |
|
||
| Technology | 5 | $198B |
|
||
| Engineering / Construction | 4 | $72B |
|
||
| Energy Services | 3 | $60B |
|
||
| Utilities | 3 | $41B |
|
||
| Healthcare | 2 | $330B |
|
||
Price history
-0.6% since first listed2 events — show timeline
- 2026-05-08 Price Changed $177,999 Zillow
- 2026-02-20 Listed $178,999 Zillow
Cash-flow waterfall
monthlySold comps — $/sqft
last 12 mo · ≤1 miLoading sold comps…