211 Bertinot Rd · Opelousas, LA
Flood risk No data
- FEMA flood zone
- —
- Chance of flooding over 30 yrs
- —
- Est. flood insurance / yr
- —
Fire risk No data
- Est. fire insurance / yr
- —
Heat risk No data
- Hot days now (above threshold)
- —
- Hot days in 30 yrs
- —
Wind risk No data
- Chance of severe wind over 30 yrs
- —
Air-quality risk No data
- Unhealthy air days now
- —
- Unhealthy air days in 30 yrs
- —
Risk factors via First Street. Map © Google.
Why this score? — see what drove the B- grade
The composite is a weighted blend of 9 inputs, each scored 0–100. Each bar is that input's sub-score; the figure is the points it added to the 100-point composite (weight × sub-score).
- Cash flow +30.0/30.0
- 1% rule +10.0/10.0
- DSCR +10.0/10.0
- ARV discount +7.5/15.0
- Livability +3.2/5.0
- Rent growth +2.5/5.0
- Schools +2.2/10.0
- Condition / age +1.0/5.0
- Appreciation +0.0/10.0
$55,900
🖨 Deal sheet 📄 Offer letter ✓ Due diligence
Listing remarks MLS
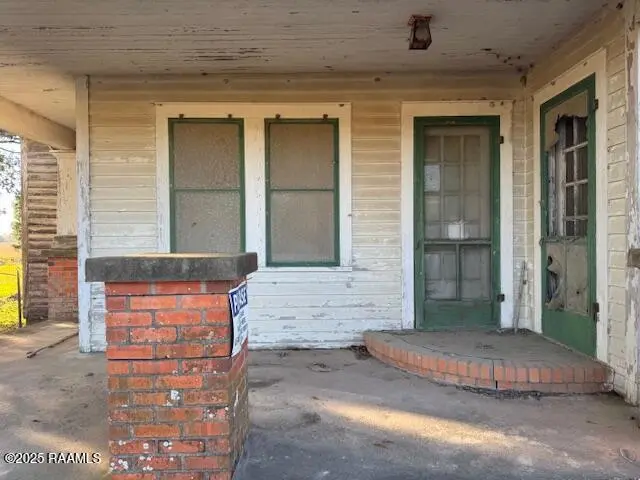
1930 Bungalow in the country on over an acre with beautiful live Oaks. Property needs work however has strong bones. Three year old roof. Land ripe for building. NO RESTRICTIONS! Want a small farm this is it!
Key facts
- No restrictions
- Three year old roof
- Over an acre
Tags
Neighborhood map
What this means for you Summary
Snapshot
- This is a 3-bed/2.0-bath single-family listed at $56k. Condition is rated poor.
Deal economics
- At list price, monthly cash flow is $475 ($6k/yr) — positive.
- The deal already cash-flows at list — no discount required.
- Meets the 1% rule at list price ($1k rent vs $56k).
- Recommended offer: $49k (12.0% below list) — sets the bar for market timing.
- Cap rate 16.5% vs local median 4.0% in Opelousas — top-decile yield for the area; either an underpriced asset or a hidden risk that comps aren't pricing in. Stress-test before assuming the spread holds.
Location & tenants
- Location reads 63/100 on livability (#187 in LA) — a middle-class / working-renter tenant base. Strengths: cost of living A+, housing A+, health & safety A+; Watch: crime F, amenities F, commute F.
- St. Landry Parish (town): math 20% / reading 33% proficiency, ranked #54 of 98 in LA (top 55%) — low school quality limits family demand, transient renter base, plan for 1-2y turnover; 73% free/reduced lunch — lower-income household profile, screen leases tightly.
- Market conditions: 309 active listings in the ZIP; 142 units permitted in St. Landry Parish in 2024 (0 in 5+ unit buildings).
Forward outlook
- Local home prices are declining (-3.0%/yr); year-one equity from $386 of loan paydown is wiped out by about $2k of value loss. Plan a longer hold.
- St. Landry County population projected to shrink 9% by 2050 — rents likely to lag national; underwrite the cash flow, not the appreciation.
- At projected returns (-3.0% appreciation + 3.0% rent growth), your $16k cash investment doubles in ~4 years — after that, you're playing with house money.
Negotiation context
- It's been on market 171 days — a 12% lower offer ($49k) is reasonable based on typical stale-listing flexibility.
Risks & watch-outs
- Watch-outs: built in 1930 — expect roof / HVAC / electrical / plumbing capex.
Questions for the listing agent
- It's been on market 171 days. Have you received any prior offers? Is the seller open to a 12% concession, seller financing, or rate buy-down credit?
- Have any recent inspections been done? Can we get a copy of the seller's disclosures and any deferred-maintenance estimates?
- Built in 1930 — when were the roof, HVAC, electrical panel, plumbing, and water heater last replaced?
- Why hasn't it sold? Are there any deal-killer items the seller is aware of (foundation, flood, title, zoning, code violations)?
- Is there a deadline driving the sale (1031 exchange, divorce, estate, relocation)? That informs how much negotiation room exists.
- Crime grade is F in this area — have there been break-ins, vandalism, or insurance claims at this property in the last 3 years? What carrier currently insures it and at what premium?
- What's the average days-on-market for RENTAL listings here right now (not sales)? A rising rental-DOM trend means longer vacancies and softer asking-rent achievability than the comps imply.
- What's the recent tenant-quality profile in this submarket — average credit score on applications, eviction rate, late-payment / NSF rate, and stable-employment percentage? A property-management company in the area should have these aggregated.
- How much new for-sale + rental construction is in the pipeline within 1–3 miles? Heavy new supply typically softens prices + rents 12–24 months out; constrained supply supports both.
Investment metrics
- 1% rule
- 1.95% ✓
- Cap rate
- 16.48%
- Cash-on-cash
- 36.38%
- DSCR
- 2.62
- GRM
- 4.3
CMA / ARV
- ARV (median comp)
- $121,169
- List price
- $55,900
- Delta
- -53.87%
- Verdict
- UNDERPRICED
- Comps
- 1 within 2.0 mi
Projected returns pro-forma
-3.0% appreciation · 3.0% rent growth · sell at horizon
- IRR
- 32.2%
- Equity multiple
- 2.35×
- Total profit
- $21,180
- Equity at exit
- $8,335
- IRR
- 39.2%
- Equity multiple
- 4.67×
- Total profit
- $57,424
- Equity at exit
- $4,833
Cash invested: $15,652 (down + closing). Projections, not guarantees.
Landlord ↔ Tenant lean methodology
- Overall (STATE)
- 90 Strongly Landlord-Friendly
- State Louisiana
- 90 Strongly Landlord-Friendly · R+12
- County
- — inherits STATE
- City
- — inherits STATE
ZIP-level market 70570
- Home prices YoY
- -34.7%
- Active inventory
- 309
- Price-to-rent
- 4.3×
Monthly cashflow live
- Estimated rent
- $1,090 medium interval (Pro) →
- Mortgage (P&I)
- −$293
- Tax est. 1.5%
- −$70 /mo · $838/yr
- Insurance
- −$23
- HOA
- −$0
- Vacancy / Maint / Mgmt
- −$229
- Net cashflow
- $475
Break-even live
UW: 25.0% down · 7.5% · 30yr · 1.5% tax · 5.0% vac · 8.0% maint · 8.0% mgmt
Financing live
Cash to close
- Down payment
- $13,975
- Closing costs
- $1,677
- Reserves months
- —
- Total cash needed
- —
Loan-product check · same deal, 3 products live
Conventional
25% down · 7.5% · 30yr
- Down + closing
- —
- Monthly P&I
- —
- Monthly cashflow
- —
- DSCR
- —
- Eligible?
- —
Personal DTI + credit; lowest rate.
DSCR
20% down · 8.5% · 30yr
- Down + closing
- —
- Monthly P&I
- —
- Monthly cashflow
- —
- DSCR
- —
- Eligible?
- —
No personal income docs; deal must DSCR.
Hard money
10% down · 12.0% · 12mo
- Down + closing
- —
- Monthly P&I
- —
- Monthly cashflow
- —
- DSCR
- —
- Eligible?
- —
Short-term bridge; refi at stabilization.
Listing history 17 events
-
2026-06-18days on market $55,900 Active 171 DOM
-
2026-06-17days on market $55,900 Active 170 DOM
-
2026-06-16days on market $55,900 Active 169 DOM
-
2026-06-15days on market $55,900 Active 168 DOM
-
2026-06-13days on market $55,900 Active 166 DOM
-
2026-06-12days on market $55,900 Active 165 DOM
-
2026-06-09days on market $55,900 Active 162 DOM
-
2026-06-08days on market $55,900 Active 161 DOM
-
2026-06-07days on market $55,900 Active 160 DOM
-
2026-06-07days on market $55,900 Active 159 DOM
-
2026-06-04days on market $55,900 Active 156 DOM
-
2026-06-02days on market $55,900 Active 155 DOM
-
2026-06-01days on market $55,900 Active 154 DOM
-
2026-05-31days on market $55,900 Active 153 DOM
-
2026-05-31days on market $55,900 Active 152 DOM
-
2026-05-20price $55,900 208-char remark
Show marketing remark (208 chars)
1930 Bungalow in the country on over an acre with beautiful live Oaks. Property needs work however has strong bones. Three year old roof. Land ripe for building. NO RESTRICTIONS! Want a small farm this is it!
-
2025-12-19$59,000 Active 208-char remark
Show marketing remark (208 chars)
1930 Bungalow in the country on over an acre with beautiful live Oaks. Property needs work however has strong bones. Three year old roof. Land ripe for building. NO RESTRICTIONS! Want a small farm this is it!
ⓘ Source: listings_history table (triggers on properties + properties_extension) + one-shot
backfill from property_details.listing_events for pre-trigger history.
Nearby sold comps map
Loading sold comps map…
Walkable amenities ~0.75 mi
Loading nearby amenities…
Taxation est. · year 1
- Rental income
- $13,076
- − Mortgage interest
- −$3,131
- − Property taxes
- −$838
- − Insurance
- −$280
- − Repairs & maintenance
- −$1,046
- − Management
- −$1,046
- − Depreciation
- −$1,626
- Taxable income
- $5,108
- Est. tax owed @ 24.0%
- −$1,226
- After-tax cash flow
- $4,468/yr
For passive investors: Depreciation is non-cash, so a rental often shows a tax loss while cash-flowing — sheltering income. Rental losses are passive: they offset passive income freely, and up to $25,000/yr can offset ordinary (W-2) income if you actively participate and your MAGI is under $100k (phasing out to $0 by $150k); unused losses carry forward. On sale, claimed depreciation is recaptured at up to 25%, and gains may owe capital-gains tax (a 1031 exchange can defer both). Figures are a year-1 estimate at your 24.0% rate — not tax advice; consult a CPA.
Condition & rehab AI · 12 photos
This property requires extensive renovations and repairs to bring it up to a livable condition. The current state is poor, with major issues in the kitchen, bathrooms, exterior, and landscaping. Significant updates are needed to increase its resale and rental value.
Repairs flagged
- Major Kitchen cabinets — Dirty and old, need replacement.
- Major Bathroom fixtures — Dirty and old, need replacement.
- Major Windows — Broken and dirty, need replacement.
- Major HVAC system — Old and dirty, needs replacement.
- Major Landscaping — Overgrown and unkempt, needs trimming and planting.
- Major Exterior siding — Weathered and peeling, needs repainting and repair.
Value-add opportunities
- Both Painting and repainting — Improves appearance and value.
- Both Landscaping and yard work — Enhances curb appeal and property value.
- Both Kitchen and bathroom renovations — Updates the outdated and dirty spaces, increasing both resale and rental value.
- Both HVAC system replacement — Improves comfort and energy efficiency, attracting buyers and renters.
- Both Windows replacement — Enhances energy efficiency and safety, attracting buyers and renters.
- Both Exterior siding repair and repainting — Improves curb appeal and property value, attracting buyers and renters.
Renovation cost estimate screening
| Repair item | Severity | Est. cost |
|---|---|---|
| Kitchen cabinets · Dirty and old, need replacement. | Major | $15,000–50,000 |
| Bathroom fixtures · Dirty and old, need replacement. | Major | $15,000–50,000 |
| Windows · Broken and dirty, need replacement. | Major | $15,000–50,000 |
| HVAC system · Old and dirty, needs replacement. | Major | $15,000–50,000 |
| Landscaping · Overgrown and unkempt, needs trimming and planting. | Major | $15,000–50,000 |
| Exterior siding · Weathered and peeling, needs repainting and repair. | Major | $15,000–50,000 |
| Total estimated repair cost · 6 items | $90,000–300,000 |
Value-add ROI direction
- Both Painting and repainting — Improves appearance and value. ↑
- Both Landscaping and yard work — Enhances curb appeal and property value. ↑
- Both Kitchen and bathroom renovations — Updates the outdated and dirty spaces, increasing both resale and rental value. ↑
- Both HVAC system replacement — Improves comfort and energy efficiency, attracting buyers and renters. ↑
- Both Windows replacement — Enhances energy efficiency and safety, attracting buyers and renters. ↑
- Both Exterior siding repair and repainting — Improves curb appeal and property value, attracting buyers and renters. ↑
ⓘ Cost ranges are severity-bucket heuristics (US national rule-of-thumb). Get contractor quotes + a written scope before underwriting a rehab budget.
Schools (NCES district)
- District
- St. Landry Parish
- NCES district ID
- 2201560
- Math proficiency
- 20% ▼ -43.00%
- Reading proficiency
- 33% ▼ -35.00%
- Median HH income
- $32,635
- Composite
- 21.59/100
- National rank
- #8303
- State rank
- #54 of 98 in LA
Livability — Opelousas
- Score
- 63/100
- State rank
- #187
- US rank
- #14928
Category grades
Schools grade is shown separately in the Schools card above.
Census & demographics
- Population (ZIP)
- 37,188
Population outlook (St. Landry County) Hauer SSP2
- Today (2025)
- 83,114 people
- By 2030
- 82,110 · -1.2%
- By 2040
- 79,445 · -4.4%
- By 2050
- 75,855 · -8.7%
- By 2075
- 65,684 · -21.0%
- By 2100
- 51,739 · -37.7%
Race, ethnicity, and origin ACS 2023
- Neighborhood character
- Diverse neighborhood (Simpson 0.56)
- Race & ethnicity
- Black 55% White 37% Two or more races 4% Hispanic / Latino 4%
- Common ancestry
- Lithuanian 8%
- Foreign-born
- 1% · Canada
- Languages at home
- 92% English-only · French/Haitian/Cajun 5% Spanish 3%
Political lean MEDSL · St. Landry
- 2024 margin
- R (+18.8) · D 40.0% · R 58.9% · Other 1.1%
- 2008→2024 swing
- -15.6pp toward R · 2008: -3.2pp · 2024: -18.8pp
- All cycles
- 2024: R+18.8 2020: R+14.1 2016: R+11.9 2012: R+4.3 2008: R+3.2
Not yet ingested
- Civics
- —
Market trends
- HPI YoY
- ▼ -52.38%
- Current HPI
- 98.4256
- Rent YoY
- —
- Metro
- —
- State GDP YoY
- ▲ 3.29%
- F500 in state
- 10
Industry mix (Fortune 500 HQ in LA)
| Industry | F500 HQs | Revenue |
|---|---|---|
| Telecommunications | 2 | $23B |
|
||
| Utilities | 1 | $12B |
|
||
| Wholesale / Distribution | 1 | $5B |
|
||
| Advertising | 1 | $2B |
|
||
Price history
-5.3% since first listed2 events — show timeline
- 2026-05-20 Price Changed $55,900 AcadianaMLS
- 2025-12-19 Listed $59,000 AcadianaMLS
Cash-flow waterfall
monthlySold comps — $/sqft
last 12 mo · ≤1 miLoading sold comps…