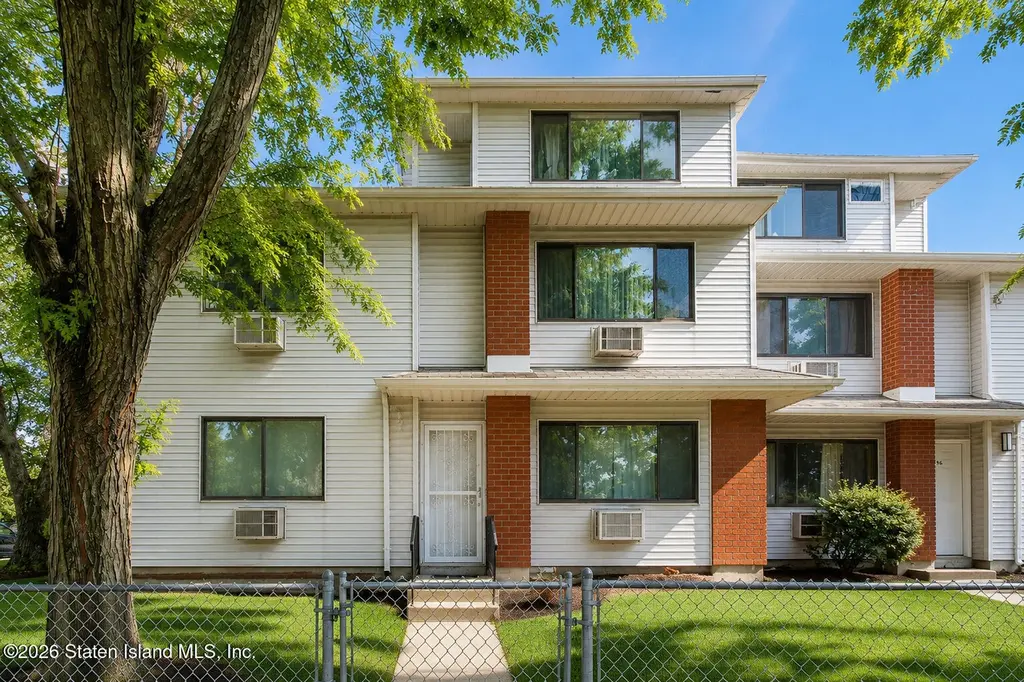
3192 Richmond Ter Unit 11b · New York, NY
Flood risk 3/10 · Minor
- FEMA flood zone
- X (unshaded)
- Chance of flooding over 30 yrs
- 0.09%
- Est. flood insurance / yr
- $507 – $1,088
Fire risk 1/10 · Minimal
- Est. fire insurance / yr
- $691 – $1,283
Heat risk 7/10 · Major
- Hot days now (above 98°F)
- 7 days/yr
- Hot days in 30 yrs
- 15 days/yr
Wind risk 6/10 · Moderate
- Chance of severe wind over 30 yrs
- 27.0%
Air-quality risk 4/10 · Minor
- Unhealthy air days now
- 5 days/yr
- Unhealthy air days in 30 yrs
- 6 days/yr
Risk factors via First Street. Map © Google.
Why this score? — see what drove the B grade
The composite is a weighted blend of 9 inputs, each scored 0–100. Each bar is that input's sub-score; the figure is the points it added to the 100-point composite (weight × sub-score).
- Cash flow +28.2/30.0
- ARV discount +15.0/15.0
- DSCR +10.0/10.0
- 1% rule +7.8/10.0
- Schools +5.0/10.0
- Livability +3.8/5.0
- Condition / age +2.8/5.0
- Rent growth +2.5/5.0
- Appreciation +0.0/10.0
$324,900
🖨 Deal sheet 📄 Offer letter ✓ Due diligence
Listing remarks
Why rent when you can own? Welcome to 3192 Richmond Terrace, a spacious 3-bedroom, 2-bath duplex offering great potential for homeownership. The main level features a large, open living area, generously sized bedrooms, and a full bath. Upstairs, you'll find a spacious primary suite complete with its own private bathroom. With a little updating and personal touch, this home can truly shine. Stop paying someone else's mortgage and take advantage of the opportunity to build equity and make this property your own.
Key facts
- 1,570 sq ft lot
- Built 1999
- Listed 3 days
Property features AI
Finance
- HOA & community: Association: Dome; Monthly association fee; Association covers snow removal and outside maintenance
Exterior
- Parking: Assigned parking
- Utilities: 220 volt electric
- Home design: 2-story dwelling; Fair condition
- Construction: Aluminum siding; Year built: approximate
- Exterior features: Water view; Lot approximately 0.04 acres (about 1,570 sq ft)
Interior
- Kitchen: Refrigerator
- Bathrooms: 1 full bathroom; 1 three-quarter bathroom (total 2 bathrooms)
- Heating & cooling: Natural gas heating; Hot water heating; Cooling units
- Interior features: Refrigerator included; Central cooling (units); Natural gas and hot water heating
Neighborhood map
What this means for you Summary
Snapshot
- This is a 3-bed/2.0-bath single-family listed at $325k. Condition is rated average.
Deal economics
- At list price, monthly cash flow is $1k ($12k/yr) — positive.
- The deal already cash-flows at list — no discount required.
- Meets the 1% rule at list price ($4k rent vs $325k).
- Cap rate 10.1% vs local median 2.6% in New York — top-decile yield for the area; either an underpriced asset or a hidden risk that comps aren't pricing in. Stress-test before assuming the spread holds.
Location & tenants
- Location reads 75/100 on livability (#268 in NY, #4,188 nationally) — a middle-class / working-renter tenant base. Strengths: amenities A+, commute A+, health & safety A; Watch: crime F, cost of living F.
- Market conditions: 108 active listings in the ZIP; 3 comparable units currently listed for rent nearby; rentals leasing fast (median 5d on market — plan ~1-2 weeks tenant-placement turnaround); solid renter incomes; 480 units permitted in Richmond County in 2024 (22 in 5+ unit buildings).
- At $4,145/mo this rent would consume 59% of the median local household income ($84k/yr) (locally 1198% of renters already pay >50% of income on rent) — very limited rent-growth headroom before tenants either downsize or default.
Forward outlook
- Local home prices are declining (-3.0%/yr); year-one equity from $2k of loan paydown is wiped out by about $10k of value loss. Plan a longer hold.
- Richmond County population projected to shrink 5% by 2050 — rents likely to lag national; underwrite the cash flow, not the appreciation.
- At projected returns (-3.0% appreciation + 3.0% rent growth), your $91k cash investment doubles in ~9 years — after that, you're playing with house money.
Negotiation context
- Only 3 days on market — expect competitive offers; lowballing is unlikely to land.
Risks & watch-outs
- Climate carrying-cost: major wind risk, 27% chance of damaging wind over 30y; extreme-heat days projected 7→15/yr by 2055 (HVAC capex compounding) — expect insurance premiums to compound above CPI over the hold.
Questions for the listing agent
- Is there a deadline driving the sale (1031 exchange, divorce, estate, relocation)? That informs how much negotiation room exists.
- Schools are B-rated — typically a magnet for longer-tenancy family renters. What's the average tenant stay here, and is there a school-zone premium baked into asking?
- Crime grade is F in this area — have there been break-ins, vandalism, or insurance claims at this property in the last 3 years? What carrier currently insures it and at what premium?
- What's the average days-on-market for RENTAL listings here right now (not sales)? A rising rental-DOM trend means longer vacancies and softer asking-rent achievability than the comps imply.
- What's the recent tenant-quality profile in this submarket — average credit score on applications, eviction rate, late-payment / NSF rate, and stable-employment percentage? A property-management company in the area should have these aggregated.
- How much new for-sale + rental construction is in the pipeline within 1–3 miles? Heavy new supply typically softens prices + rents 12–24 months out; constrained supply supports both.
Investment metrics
- 1% rule
- 1.28% ✓
- Cap rate
- 10.10%
- Cash-on-cash
- 13.58%
- DSCR
- 1.60
- GRM
- 6.5
CMA / ARV
- ARV (on-the-fly)
- $534,000
- Comps found
- 12
Show comp detail 12 sales within ~0.75 mi
| Address | Dist | Beds/Ba | Sqft | Sold | Price | $/sf | Match |
|---|---|---|---|---|---|---|---|
| 27 Grandview Ave | 0.05mi | 2/1.5 (-1) | 1,470 (-2%) | 3mo | $475,000 | $323 | 85 |
| 60 Northfield Ct | 0.19mi | 3/2.5 | 1,391 (-7%) | 1mo | $550,000 | $395 | 76 |
| 10 South Ave | 0.06mi | 4/2.0 (+1) | 1,672 (+12%) | 4mo | $525,000 | $314 | 70 |
| 11 Coonley Ct | 0.42mi | 3/2.0 | 1,408 (-6%) | 2mo | $423,000 | $300 | 68 |
| 138 Union Ave | 0.58mi | 3/3.5 | 1,504 (+0%) | 0mo | $765,000 | $509 | 66 |
| 43 Andros Ave | 0.26mi | 3/1.5 | 1,344 (-10%) | 6mo | $480,000 | $357 | 64 |
| 136 Union Ave | 0.58mi | 3/3.5 | 1,475 (-2%) | 1mo | $730,000 | $495 | 63 |
| 176 Arlington Pl | 0.37mi | 3/1.5 | 1,350 (-10%) | 4mo | $480,000 | $356 | 61 |
| 36 Lockman Ave | 0.28mi | 4/1.5 (+1) | 1,360 (-9%) | 5mo | $560,000 | $412 | 60 |
| 221 South Ave | 0.38mi | 3/1.5 | 1,326 (-12%) | 2mo | $330,000 | $249 | 59 |
| 13 Coonley Ct | 0.42mi | 2/1.0 (-1) | 1,408 (-6%) | 3mo | $400,000 | $284 | 59 |
| 133 Van Pelt Ave | 0.71mi | 3/1.0 | 1,704 (+14%) | 5mo | $540,000 | $317 | 36 |
Match score weights: distance 35% · size 25% · config 20% · recency 20%. Top-matched comps best support the ARV.
Projected returns pro-forma
-3.0% appreciation · 3.0% rent growth · sell at horizon
- IRR
- 3.7%
- Equity multiple
- 1.14×
- Total profit
- $12,983
- Equity at exit
- $48,444
- IRR
- 13.2%
- Equity multiple
- 2.06×
- Total profit
- $95,989
- Equity at exit
- $28,091
Cash invested: $90,972 (down + closing). Projections, not guarantees.
Landlord ↔ Tenant lean methodology
- Overall (CITY)
- 0 Strongly Tenant-Friendly
- State New York
- 15 Strongly Tenant-Friendly · D+10
- County
- — inherits STATE
- City New York
- 0 Strongly Tenant-Friendly · D+34
ZIP-level market 10303
- Home prices YoY
- -24.8%
- Active inventory
- 108
- Price-to-rent
- 6.5×
Monthly cashflow live
- Estimated rent
- $4,145 medium interval (Pro) →
- Mortgage (P&I)
- −$1,704
- Tax est. 1.5%
- −$406 /mo · $4,874/yr
- Insurance
- −$135
- HOA
- −$0
- Vacancy / Maint / Mgmt
- −$871
- Net cashflow
- $1,029
Break-even live
UW: 25.0% down · 7.5% · 30yr · 1.5% tax · 5.0% vac · 8.0% maint · 8.0% mgmt
Financing live
Cash to close
- Down payment
- $81,225
- Closing costs
- $9,747
- Reserves months
- —
- Total cash needed
- —
Loan-product check · same deal, 3 products live
Conventional
25% down · 7.5% · 30yr
- Down + closing
- —
- Monthly P&I
- —
- Monthly cashflow
- —
- DSCR
- —
- Eligible?
- —
Personal DTI + credit; lowest rate.
DSCR
20% down · 8.5% · 30yr
- Down + closing
- —
- Monthly P&I
- —
- Monthly cashflow
- —
- DSCR
- —
- Eligible?
- —
No personal income docs; deal must DSCR.
Hard money
10% down · 12.0% · 12mo
- Down + closing
- —
- Monthly P&I
- —
- Monthly cashflow
- —
- DSCR
- —
- Eligible?
- —
Short-term bridge; refi at stabilization.
Rent comps 3 comps
| Address | Beds | Baths | Sqft | Rent | $/sqft | DOM | Units | Dist |
|---|---|---|---|---|---|---|---|---|
| 200 Glenn Zamorski DR Lot Glenn Elizabethport, NJ | 3.0 | 2.0 | 1550 | $7,000 | $4.52 | 1d | 1 | 1.12mi |
| 76 Port Ave Unit 2 Elizabethport, NJ | 3.0 | 2.0 | 1250 | $2,799 | $2.24 | 20d | 1 | 1.14mi |
| 76 Port Ave #1 Elizabethport, NJ | 3.0 | 2.0 | 1275 | $2,750 | $2.16 | 5d | 1 | 1.14mi |
Listing history 10 events
-
2026-06-18days on market $324,900 Active 3 DOM
-
2026-06-17days on market $324,900 Active 2 DOM
-
2026-06-15statusdays on market $324,900 Active 1 DOM
-
2026-06-15days on market $324,900 Coming Soon 12 DOM
-
2026-06-13days on market $324,900 Coming Soon 10 DOM
-
2026-06-09days on market $324,900 Coming Soon 6 DOM
-
2026-06-08days on market $324,900 Coming Soon 5 DOM
-
2026-06-07days on market $324,900 Coming Soon 4 DOM
-
2026-06-04remarks 515-char remark
-
2026-06-04$324,900 Coming Soon 1 DOM
ⓘ Source: listings_history table (triggers on properties + properties_extension) + one-shot
backfill from property_details.listing_events for pre-trigger history.
Climate risk First Street
- Flood 3/10 Moderate FEMA zone X (unshaded) · 9% chance over 30 yrs
- Wildfire 1/10 Low
- Heat 7/10 Severe 7 d/yr ≥98°F today · 15 d/yr by 30 yrs out
- Wind 6/10 Major 27% chance of damaging wind over 30 yrs
- Air quality 4/10 Moderate 5 unhealthy d/yr today · 6 by 30 yrs out
Nearby sold comps map
Loading sold comps map…
Walkable amenities ~0.75 mi
Loading nearby amenities…
Taxation est. · year 1
- Rental income
- $49,744
- − Mortgage interest
- −$18,199
- − Property taxes
- −$4,874
- − Insurance
- −$1,624
- − Repairs & maintenance
- −$3,979
- − Management
- −$3,979
- − Depreciation
- −$9,452
- Taxable income
- $7,636
- Est. tax owed @ 24.0%
- −$1,833
- After-tax cash flow
- $10,521/yr
For passive investors: Depreciation is non-cash, so a rental often shows a tax loss while cash-flowing — sheltering income. Rental losses are passive: they offset passive income freely, and up to $25,000/yr can offset ordinary (W-2) income if you actively participate and your MAGI is under $100k (phasing out to $0 by $150k); unused losses carry forward. On sale, claimed depreciation is recaptured at up to 25%, and gains may owe capital-gains tax (a 1031 exchange can defer both). Figures are a year-1 estimate at your 24.0% rate — not tax advice; consult a CPA.
Condition & rehab AI · 14 photos
This 3-bedroom, 2-bath duplex requires moderate updates to its exterior and interior, including painting and landscaping, to improve its resale and rental value.
Repairs flagged
- Minor Paint — Faded paint on interior walls and exterior.
- Minor Landscaping — Overgrown areas in landscaping.
Value-add opportunities
- Both Painting and updating the kitchen and bathroom — These updates will improve the home's curb appeal and interior aesthetics, making it more attractive to potential buyers or renters.
- Both Landscaping improvements — A well-maintained and aesthetically pleasing exterior can significantly increase the home's resale and rental value.
Renovation cost estimate screening
| Repair item | Severity | Est. cost |
|---|---|---|
| Paint · Faded paint on interior walls and exterior. | Minor | $500–3,000 |
| Landscaping · Overgrown areas in landscaping. | Minor | $500–3,000 |
| Total estimated repair cost · 2 items | $1,000–6,000 |
Value-add ROI direction
- Both Painting and updating the kitchen and bathroom — These updates will improve the home's curb appeal and interior aesthetics, making it more attractive to potential buyers or renters. ↑
- Both Landscaping improvements — A well-maintained and aesthetically pleasing exterior can significantly increase the home's resale and rental value. ↑
ⓘ Cost ranges are severity-bucket heuristics (US national rule-of-thumb). Get contractor quotes + a written scope before underwriting a rehab budget.
Schools (NCES district)
No district data.
Livability — New York
- Score
- 75/100
- State rank
- #268
- US rank
- #4188
Category grades
Schools grade is shown separately in the Schools card above.
Census & demographics
- Census place
- New York, NY
- County
- Richmond County · 404,174 people
- City population
- 7,731,280
- Metro
- New York-Newark-Jersey City, NY-NJ-PA
- Population (ZIP)
- 26,497
- Household income
- $83,947
- Rent vs Own
- Severe rent burden
- 1198.0
Population outlook (Richmond County) Hauer SSP2
- Today (2025)
- 482,784 people
- By 2030
- 481,831 · -0.2%
- By 2040
- 473,159 · -2.0%
- By 2050
- 457,242 · -5.3%
- By 2075
- 408,029 · -15.5%
- By 2100
- 341,459 · -29.3%
Race, ethnicity, and origin ACS 2023
- Neighborhood character
- Highly diverse neighborhood (Simpson 0.72)
- Race & ethnicity
- Hispanic / Latino 38% Black 33% Two or more races 17% White 15% Asian 10%
- Hispanic origin (detail)
- Mexican 5% Puerto Rican 19% Dominican 5%
- Common ancestry
- Romanian 2% Italian 1% Swiss 1%
- Foreign-born
- 26% · Canada, China, Jamaica
- Languages at home
- 57% English-only · Spanish 25% Other Indo-European 6% Chinese 3%
Political lean MEDSL · Richmond
- 2024 margin
- Strong R (+29.8) · D 35.1% · R 64.9%
- 2008→2024 swing
- -25.7pp toward R · 2008: -4.0pp · 2024: -29.8pp
- All cycles
- 2024: R+29.8 2020: R+14.9 2016: R+16.8 2012: D+0.8 2008: R+4.0
Not yet ingested
- Civics
- —
Market trends
- HPI YoY
- ▼ -121.86%
- Current HPI
- 369.2771
- Rent YoY
- —
- Metro
- New York-Newark-Jersey City, NY-NJ-PA
- State GDP YoY
- ▲ 2.60%
- F500 in state
- 92
Industry mix (Fortune 500 HQ in NY)
| Industry | F500 HQs | Revenue |
|---|---|---|
| Financial Services | 10 | $950B |
|
||
| Consumer Goods | 9 | $162B |
|
||
| Insurance | 4 | $225B |
|
||
| Telecommunications | 2 | $144B |
|
||
| Pharmaceuticals | 2 | $112B |
|
||
| Media / Entertainment | 2 | $69B |
|
||
Price history
1 event — show timeline
- 2026-06-03 Coming Soon $324,900 SIBORMLS
Cash-flow waterfall
monthlySold comps — $/sqft
last 12 mo · ≤1 miLoading sold comps…