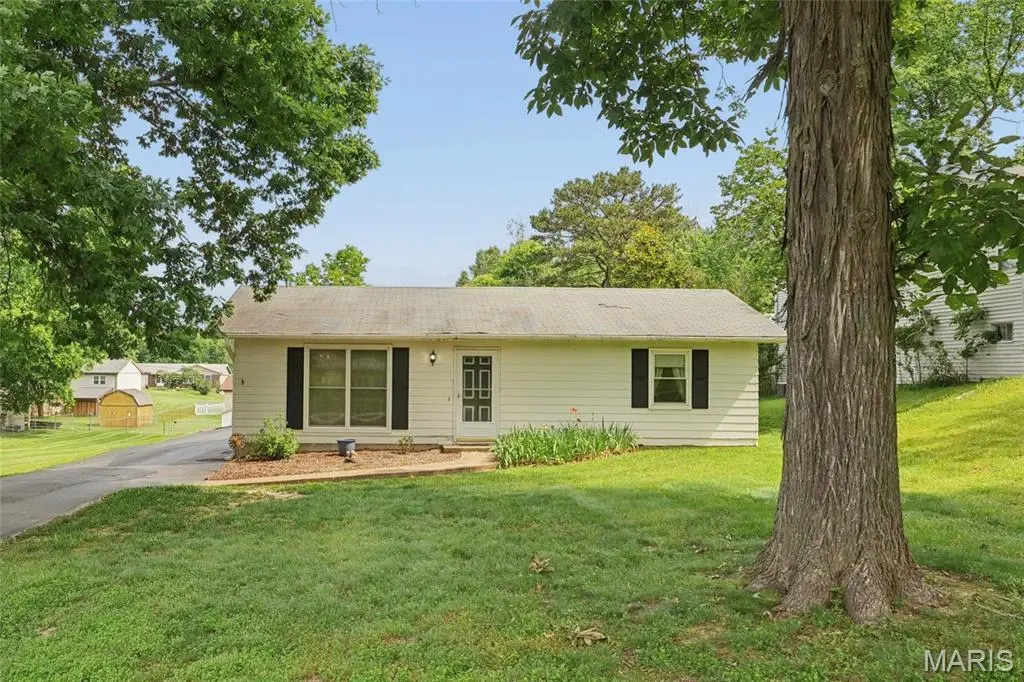
118 Wallach Dr · Murphy, MO
Flood risk 1/10 · Minimal
- FEMA flood zone
- X (unshaded)
- Chance of flooding over 30 yrs
- 0.0%
- Est. flood insurance / yr
- $507 – $1,088
Fire risk 3/10 · Minor
- Est. fire insurance / yr
- $1,054 – $1,958
Heat risk 5/10 · Moderate
- Hot days now (above 106°F)
- 7 days/yr
- Hot days in 30 yrs
- 21 days/yr
Wind risk 2/10 · Minimal
- Chance of severe wind over 30 yrs
- 1.0%
Air-quality risk 3/10 · Minor
- Unhealthy air days now
- 2 days/yr
- Unhealthy air days in 30 yrs
- 4 days/yr
Risk factors via First Street. Map © Google.
Why this score? — see what drove the D+ grade
The composite is a weighted blend of 9 inputs, each scored 0–100. Each bar is that input's sub-score; the figure is the points it added to the 100-point composite (weight × sub-score).
- Cash flow +18.2/30.0
- ARV discount +7.5/15.0
- DSCR +5.7/10.0
- Rent growth +4.4/5.0
- 1% rule +4.1/10.0
- Schools +3.5/10.0
- Livability +3.0/5.0
- Condition / age +2.5/5.0
- Appreciation +0.0/10.0
$225,000
🖨 Deal sheet 📄 Offer letter ✓ Due diligence
Listing remarks
Spacious 3 bedroom, 2 bath Ranch with 2 car Carport on Scenic ½ Acre Lot on a Private road is now available for purchase. Original garage was converted to a Primary Bedroom Suite but is currently used as a family room. This all electric, much loved One Level Home is ready for a new family to make it their own. Seller prefers an AS-IS Sale on Special Sales Contract. Inspections are welcome for buyer information only. Seller will do no repairs. All appliances are included: (washer, dryer, refrigerator, portable microwave) ANY OFFERS SHOULD BE RECEIVED NO LATER THAN 5:00 PM WEDNESDAY JUNE 10 WITH ACCEPTANCE DEADLINE THURSDAY JUNE 11 AT 10:00 AM
Key facts
- 0.5 acre lot
- 2 parking spots
- Built 1984
Property features AI
Finance
- Other: Gentle sloping lot with asphalt private road frontage; Lot dimensions approximately 109 x 200; Community features include sewer gutters and storm sewer
- HOA & community: Part of Wallach Rd Association; Annual association fee of $250 covering parking/roads maintenance and snow removal; Association provides other amenities (unspecified)
Exterior
- Parking: Carport with 2 spaces; Off-street parking
- Utilities: Public water; Public sewer; Electricity connected (electric service listed as Other); Natural gas not available
- Home design: Single-family home; One level; Private ownership
- Construction: Vinyl siding; Asphalt shingle roof; Slab foundation; Built by builder (year built source: Builder)
- Exterior features: Patio; Chain link partial backyard fence; Shed(s)
Interior
- Kitchen: Free-standing electric range; Refrigerator
- Bedrooms: 3 bedrooms on the main level
- Flooring: Carpet; Vinyl
- Bathrooms: 2 full bathrooms (both on main level)
- Heating & cooling: Electric forced-air heating; Central air; Wall/window air conditioning units
- Interior features: Laminate counters; Open floorplan; Insulated windows
- Laundry & utility: Laundry room on the main level; Electric water heater
Neighborhood map
What this means for you Summary
Snapshot
- This is a 3-bed/1.0-bath other listed at $225k.
Deal economics
- At list price, monthly cash flow is $202 ($2k/yr) — positive.
- The deal already cash-flows at list — no discount required.
- To meet the 1% rule (rent ≥ 1% of price), the offer needs to be $204k (9.3% below list).
- Recommended offer: $204k (9.3% below list) — sets the bar for 1% rule.
- Cap rate 7.4% vs local median 3.0% in Murphy — top-decile yield for the area; either an underpriced asset or a hidden risk that comps aren't pricing in. Stress-test before assuming the spread holds.
Location & tenants
- Location reads 60/100 on livability (#461 in MO) — a middle-class / working-renter tenant base. Strengths: cost of living A+, housing A+; Watch: crime D+, employment D+, amenities F.
- Northwest R-I (suburban): math 37% / reading 43% proficiency, ranked #128 of 324 in MO (top 40%) — families likely to look elsewhere, expect single-tenant / working-renter base with shorter leases.
- Zoned schools: Murphy Elem. (math 47% / reading 42%, grade F, #413 of 1,115 statewide, top 42%, 463 students, 48% FRL); Northwest High (math 26% / reading 56%, grade F, #236 of 521 statewide, top 45%, 1,841 students, 27% FRL) — zoned schools at 37% FRL track the district average.
- Market conditions: Rents rising fast (+7.7%/yr); 146 active listings in the ZIP; 2 comparable units currently listed for rent nearby; solid renter incomes; 807 units permitted in Jefferson County in 2024 (104 in 5+ unit buildings).
Forward outlook
- Local home prices are declining (-3.0%/yr); year-one equity from $2k of loan paydown is wiped out by about $7k of value loss. Plan a longer hold.
- At projected returns (-3.0% appreciation + 7.7% rent growth), your $63k cash investment doubles in ~10 years — after that, you're playing with house money.
Negotiation context
- Only 3 days on market — expect competitive offers; lowballing is unlikely to land.
- Current owner paid $105k; list at $225k implies a 114% gain — meaningful room to come down on a strong offer.
Risks & watch-outs
- Climate carrying-cost: extreme-heat days projected 7→21/yr by 2055 (HVAC capex compounding) — expect insurance premiums to compound above CPI over the hold.
Questions for the listing agent
- What does the HOA fee cover, when was the last increase, and are there any pending special assessments or reserve-fund shortfalls?
- Is there a deadline driving the sale (1031 exchange, divorce, estate, relocation)? That informs how much negotiation room exists.
- Schools are F-rated, which usually means shorter tenancies and higher turnover. Who's the typical renter profile here, and what's been the actual vacancy rate?
- Crime grade is D in this area — have there been break-ins, vandalism, or insurance claims at this property in the last 3 years? What carrier currently insures it and at what premium?
- The area grade is low — what's the realistic commute time and amenity access for the typical tenant pool here? Any planned neighborhood developments (good or bad) we should know about?
- What's the average days-on-market for RENTAL listings here right now (not sales)? A rising rental-DOM trend means longer vacancies and softer asking-rent achievability than the comps imply.
- What's the recent tenant-quality profile in this submarket — average credit score on applications, eviction rate, late-payment / NSF rate, and stable-employment percentage? A property-management company in the area should have these aggregated.
- How much new for-sale + rental construction is in the pipeline within 1–3 miles? Heavy new supply typically softens prices + rents 12–24 months out; constrained supply supports both.
Investment metrics
- 1% rule
- 0.91% ✗
- Cap rate
- 7.37%
- Cash-on-cash
- 3.85%
- DSCR
- 1.17
- GRM
- 9.2
CMA / ARV
No comps found within radius.
Projected returns pro-forma
-3.0% appreciation · 7.72% rent growth · sell at horizon
- IRR
- -5.5%
- Equity multiple
- 0.79×
- Total profit
- $-13,480
- Equity at exit
- $33,548
- IRR
- 8.8%
- Equity multiple
- 1.80×
- Total profit
- $50,565
- Equity at exit
- $19,454
Cash invested: $63,000 (down + closing). Projections, not guarantees.
Landlord ↔ Tenant lean methodology
- Overall (STATE)
- 81 Strongly Landlord-Friendly
- State Missouri
- 81 Strongly Landlord-Friendly · R+10
- County
- — inherits STATE
- City
- — inherits STATE
ZIP-level market 63026
- Rents YoY
- 7.7%
- Active inventory
- 146
- Price-to-rent
- 9.2×
Monthly cashflow live
- Estimated rent
- $2,041 medium interval (Pro) →
- Mortgage (P&I)
- −$1,180
- Tax from tax record
- −$116 /mo · $1,389/yr
- Insurance
- −$94
- HOA
- −$21
- Vacancy / Maint / Mgmt
- −$429
- Net cashflow
- $202
Break-even live
UW: 25.0% down · 7.5% · 30yr · 1.5% tax · 5.0% vac · 8.0% maint · 8.0% mgmt
Financing live
Cash to close
- Down payment
- $56,250
- Closing costs
- $6,750
- Reserves months
- —
- Total cash needed
- —
Loan-product check · same deal, 3 products live
Conventional
25% down · 7.5% · 30yr
- Down + closing
- —
- Monthly P&I
- —
- Monthly cashflow
- —
- DSCR
- —
- Eligible?
- —
Personal DTI + credit; lowest rate.
DSCR
20% down · 8.5% · 30yr
- Down + closing
- —
- Monthly P&I
- —
- Monthly cashflow
- —
- DSCR
- —
- Eligible?
- —
No personal income docs; deal must DSCR.
Hard money
10% down · 12.0% · 12mo
- Down + closing
- —
- Monthly P&I
- —
- Monthly cashflow
- —
- DSCR
- —
- Eligible?
- —
Short-term bridge; refi at stabilization.
Rent comps 2 comps
| Address | Beds | Baths | Sqft | Rent | $/sqft | DOM | Units | Dist |
|---|---|---|---|---|---|---|---|---|
| 301 Clay Creek Trl Fenton, MO | 1.0–2.0 | 1.0–2.0 | 1071 | $2,081 | $1.94 | 1d | 17 | 0.87mi |
| 63 Patricia Pl Fenton, MO | 3.0 | 1.0 | 1091 | $1,995 | $1.83 | 10d | 1 | 0.89mi |
HOA detail
- Monthly dues
- $21 · $252/yr
- Likely covers
- electric
Listing history 6 events
-
2026-06-13statusdays on market $225,000 Pending 3 DOM
-
2026-06-10remarks 650-char remark
-
2026-06-09statusdays on market $225,000 Active 1 DOM
-
2026-06-08days on market $225,000 Coming Soon 4 DOM
-
2026-06-07days on market $225,000 Coming Soon 3 DOM
-
2026-06-05$225,000 Coming Soon 1 DOM
ⓘ Source: listings_history table (triggers on properties + properties_extension) + one-shot
backfill from property_details.listing_events for pre-trigger history.
Tax reassessment forecast MO · Resets to sale price
- Current annual tax
- $1,389 · $116/mo
- Projected year-2 tax
- $2,182 · $182/mo
- Expected delta
- +$793/yr (+$66/mo · 57.1%)
ⓘ Screening estimate from a state-policy table — verify with the county assessor before closing.
Climate risk First Street
- Flood 1/10 Low FEMA zone X (unshaded) · 0% chance over 30 yrs
- Wildfire 3/10 Moderate
- Heat 5/10 Major 7 d/yr ≥106°F today · 21 d/yr by 30 yrs out
- Wind 2/10 Low 100% chance of damaging wind over 30 yrs
- Air quality 3/10 Moderate 2 unhealthy d/yr today · 4 by 30 yrs out
Nearby sold comps map
Loading sold comps map…
Walkable amenities ~0.75 mi
Loading nearby amenities…
Taxation est. · year 1
- Rental income
- $24,496
- − Mortgage interest
- −$12,603
- − Property taxes
- −$1,389
- − Insurance
- −$1,125
- − Repairs & maintenance
- −$1,960
- − Management
- −$1,960
- − HOA
- −$252
- − Depreciation
- −$6,545
- Taxable loss
- −$1,338
- Est. tax savings @ 24.0%
- +$321
- After-tax cash flow
- $2,748/yr
For passive investors: Depreciation is non-cash, so a rental often shows a tax loss while cash-flowing — sheltering income. Rental losses are passive: they offset passive income freely, and up to $25,000/yr can offset ordinary (W-2) income if you actively participate and your MAGI is under $100k (phasing out to $0 by $150k); unused losses carry forward. On sale, claimed depreciation is recaptured at up to 25%, and gains may owe capital-gains tax (a 1031 exchange can defer both). Figures are a year-1 estimate at your 24.0% rate — not tax advice; consult a CPA.
Schools (NCES district)
- District
- Northwest R-I
- NCES district ID
- 2922890
- Math proficiency
- 37% ▼ -9.00%
- Reading proficiency
- 43% ▼ -9.00%
- Median HH income
- $55,998
- Composite
- 35.05/100
- National rank
- #5034
- State rank
- #128 of 324 in MO
Livability — Murphy
- Score
- 60/100
- State rank
- #461
- US rank
- #18506
Category grades
Schools grade is shown separately in the Schools card above.
Census & demographics
- Census place
- Murphy, MO
- County
- Jefferson County · 108,544 people
- Metro
- St. Louis, MO-IL
- Population (ZIP)
- 45,354
- Household income
- $97,553
- Rent vs Own
- Severe rent burden
- 513.0
Population outlook (Jefferson County) Hauer SSP2
- Today (2025)
- 235,088 people
- By 2030
- 238,365 · +1.4%
- By 2040
- 240,156 · +2.2%
- By 2050
- 234,651 · -0.2%
- By 2075
- 214,569 · -8.7%
- By 2100
- 179,697 · -23.6%
Race, ethnicity, and origin ACS 2023
- Neighborhood character
- Predominantly White (87%)
- Race & ethnicity
- White 87% Two or more races 8% Hispanic / Latino 3% Asian 2% Black 1%
- Common ancestry
- Romanian 4% Lithuanian 3% Slovak 1%
- Foreign-born
- 3% · Canada, China
- Languages at home
- 95% English-only · Spanish 1% Russian/Polish/Slavic 1% Other Indo-European 1%
Political lean MEDSL · Jefferson
- 2024 margin
- Solid R (+36.7) · D 31.0% · R 67.7% · Other 1.3%
- 2008→2024 swing
- -39.3pp toward R · 2008: 2.5pp · 2024: -36.7pp
- All cycles
- 2024: R+36.7 2020: R+33.9 2016: R+35.3 2012: R+12.7 2008: D+2.5
Not yet ingested
- Civics
- —
Market trends
- HPI YoY
- ▼ -300.59%
- Current HPI
- 211.8944
- Rent YoY
- ▲ 7.72%
- Metro
- St. Louis, MO-IL
- State GDP YoY
- ▲ 1.84%
- F500 in state
- 20
Industry mix (Fortune 500 HQ in MO)
| Industry | F500 HQs | Revenue |
|---|---|---|
| Healthcare | 1 | $163B |
|
||
| Insurance | 1 | $21B |
|
||
| Industrial Technology | 1 | $17B |
|
||
| Retail | 1 | $16B |
|
||
| Industrial Distribution | 1 | $10B |
|
||
| Utilities | 1 | $9B |
|
||
Price history
+114.3% since first listed3 events — show timeline
- 2026-06-04 Coming Soon $225,000 MARIS as Distributed by MLS Grid
- 2004-01-02 Sold (Public Records) $105,000 Public Records
- 2001-05-16 Sold (Public Records) — Public Records
Property tax history
+2.8%/yrLatest (2025): $1,389 · +6.9% YoY. Source: county tax records.
Cash-flow waterfall
monthlySold comps — $/sqft
last 12 mo · ≤1 miLoading sold comps…