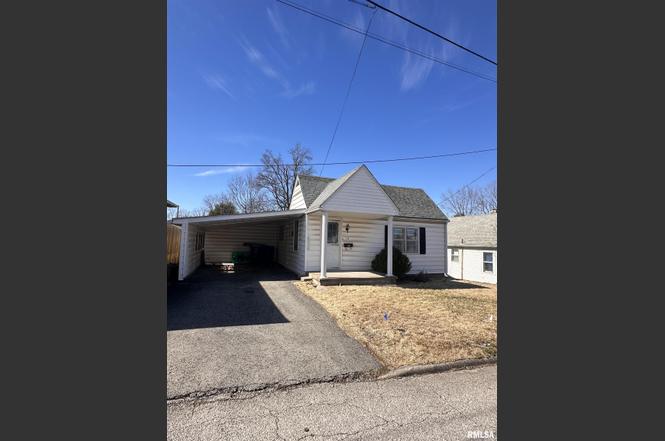
115 East Ave · Anna, IL
Flood risk 1/10 · Minimal
- FEMA flood zone
- X (unshaded)
- Chance of flooding over 30 yrs
- 0.0%
- Est. flood insurance / yr
- $473 – $860
Fire risk 1/10 · Minimal
- Est. fire insurance / yr
- $804 – $1,492
Heat risk 5/10 · Moderate
- Hot days now (above 107°F)
- 7 days/yr
- Hot days in 30 yrs
- 21 days/yr
Wind risk 2/10 · Minimal
- Chance of severe wind over 30 yrs
- 3.0%
Air-quality risk 1/10 · Minimal
- Unhealthy air days now
- 0 days/yr
- Unhealthy air days in 30 yrs
- 0 days/yr
Risk factors via First Street. Map © Google.
Why this score? — see what drove the C+ grade
The composite is a weighted blend of 9 inputs, each scored 0–100. Each bar is that input's sub-score; the figure is the points it added to the 100-point composite (weight × sub-score).
- Cash flow +27.1/30.0
- ARV discount +10.0/15.0
- DSCR +9.4/10.0
- 1% rule +7.3/10.0
- Livability +2.8/5.0
- Rent growth +2.5/5.0
- Condition / age +2.5/5.0
- Schools +2.4/10.0
- Appreciation +0.0/10.0
$84,900
🖨 Deal sheet 📄 Offer letter ✓ Due diligence
Listing remarks MLS
Cozy home with a great back yard! You'll enjoy a large living room, 2 nice size bedrooms, a deck, large bathroom and plenty of outdoor space! Make an appointment before this one is gone!
Key facts
- Covered carport
- Full basement
- Large back yard
Tags
Property features AI
Exterior
- Parking: Attached carport; No enclosed garage spaces
- Utilities: Public water; Public sewer
- Home design: Single family residence; Built in 1921; Shingle roof
- Construction: Built in 1921
- Exterior features: Shed(s); Level lot; Paved road access
Interior
- Kitchen: Dishwasher
- Bedrooms: 2 bedrooms (main level)
- Flooring: Carpet in bedrooms and living area; Laminate in dining room, kitchen, and entry
- Bathrooms: 1 full bathroom
- Heating & cooling: Central air; Electric forced air heating; Gas water heater
- Interior features: Ceiling fan(s); Partial unfinished basement
Neighborhood map
What this means for you Summary
Snapshot
- This is a 2-bed/1.0-bath single-family listed at $85k.
Deal economics
- At list price, monthly cash flow is $241 ($3k/yr) — positive.
- The deal already cash-flows at list — no discount required.
- Meets the 1% rule at list price ($1k rent vs $85k).
- Recommended offer: $80k (6.0% below list) — sets the bar for market timing.
- Cap rate 9.7% vs local median 5.7% in Anna — top-decile yield for the area; either an underpriced asset or a hidden risk that comps aren't pricing in. Stress-test before assuming the spread holds.
Location & tenants
- Location reads 56/100 on livability (#1,184 in IL) — a working-class tenant base; expect higher turnover. Strengths: cost of living A+, housing A+; Watch: crime F, amenities F, commute F.
- Anna Jonesboro Chsd 81 (town): math 20% / reading 30% proficiency, ranked #623 of 919 in IL (top 68%) — low school quality limits family demand, transient renter base, plan for 1-2y turnover.
- Zoned schools: Anna-Jonesboro High School (math 12% / reading 22%, grade F, #430 of 693 statewide, top 66%, 497 students, 0% FRL).
- Market conditions: 38 active listings in the ZIP; 10 units permitted in Union County in 2024 (0 in 5+ unit buildings).
Forward outlook
- Local home prices are declining (-3.0%/yr); year-one equity from $587 of loan paydown is wiped out by about $3k of value loss. Plan a longer hold.
- Union County population projected at -18% by 2050 — secular population decline; favor cash flow + early exit over multi-decade hold.
- At projected returns (-3.0% appreciation + 3.0% rent growth), your $24k cash investment doubles in ~10 years — after that, you're playing with house money.
Negotiation context
- It's been on market 69 days — a 6% lower offer ($80k) is reasonable based on typical stale-listing flexibility.
- 4 sale attempts since 3y ago with the ask held roughly flat each time — persistent listings suggest the price (not the market) is what's stuck; bring a comps-based counter.
Risks & watch-outs
- Watch-outs: built in 1921 — expect roof / HVAC / electrical / plumbing capex.
- Climate carrying-cost: extreme-heat days projected 7→21/yr by 2055 (HVAC capex compounding) — expect insurance premiums to compound above CPI over the hold.
Questions for the listing agent
- It's been on market 69 days. Have you received any prior offers? Is the seller open to a 6% concession, seller financing, or rate buy-down credit?
- Built in 1921 — when were the roof, HVAC, electrical panel, plumbing, and water heater last replaced?
- Why hasn't it sold? Are there any deal-killer items the seller is aware of (foundation, flood, title, zoning, code violations)?
- Is there a deadline driving the sale (1031 exchange, divorce, estate, relocation)? That informs how much negotiation room exists.
- Schools are F-rated, which usually means shorter tenancies and higher turnover. Who's the typical renter profile here, and what's been the actual vacancy rate?
- Crime grade is F in this area — have there been break-ins, vandalism, or insurance claims at this property in the last 3 years? What carrier currently insures it and at what premium?
- What's the average days-on-market for RENTAL listings here right now (not sales)? A rising rental-DOM trend means longer vacancies and softer asking-rent achievability than the comps imply.
- What's the recent tenant-quality profile in this submarket — average credit score on applications, eviction rate, late-payment / NSF rate, and stable-employment percentage? A property-management company in the area should have these aggregated.
- How much new for-sale + rental construction is in the pipeline within 1–3 miles? Heavy new supply typically softens prices + rents 12–24 months out; constrained supply supports both.
Investment metrics
- 1% rule
- 1.23% ✓
- Cap rate
- 9.70%
- Cash-on-cash
- 12.17%
- DSCR
- 1.54
- GRM
- 6.8
CMA / ARV
- ARV (on-the-fly)
- $89,984
- Comps found
- 12
Show comp detail 12 sales within ~0.75 mi
| Address | Dist | Beds/Ba | Sqft | Sold | Price | $/sf | Match |
|---|---|---|---|---|---|---|---|
| 111 Grand Ave | 0.08mi | 3/2.0 (+1) | 1,200 (+1%) | 3mo | $132,000 | $110 | 83 |
| 108 East Ave | 0.04mi | 3/1.0 (+1) | 1,152 (-3%) | 9mo | $74,500 | $65 | 81 |
| 110 East Ave | 0.04mi | 3/1.0 (+1) | 1,251 (+6%) | 6mo | $95,000 | $76 | 78 |
| 202 Court St | 0.44mi | 2/1.0 | 1,124 (-5%) | 14mo | $69,500 | $62 | 59 |
| 119 Warren St | 0.75mi | 2/2.0 | 1,160 (-2%) | 6mo | $52,000 | $45 | 53 |
| 113 Grove Ave | 0.15mi | 3/2.0 (+1) | 1,344 (+14%) | 12mo | $77,900 | $58 | 52 |
| 121 Turner Ave | 0.45mi | 3/2.0 (+1) | 1,250 (+6%) | 14mo | $150,000 | $120 | 49 |
| 109 E Lewis St | 0.74mi | 2/2.0 | 1,220 (+3%) | 12mo | $80,000 | $66 | 46 |
| 810 Brady Mill Rd | 0.64mi | 3/1.0 (+1) | 1,260 (+6%) | 13mo | $125,000 | $99 | 44 |
| 121 W Chestnut St | 0.69mi | 2/1.0 | 1,080 (-9%) | 15mo | $62,500 | $58 | 41 |
| 605 N Main St | 0.74mi | 3/2.0 (+1) | 1,032 (-13%) | 6mo | $86,000 | $83 | 30 |
| 134 W Chestnut St | 0.75mi | 2/2.0 | 1,008 (-15%) | 14mo | $88,000 | $87 | 24 |
Match score weights: distance 35% · size 25% · config 20% · recency 20%. Top-matched comps best support the ARV.
Projected returns pro-forma
-3.0% appreciation · 3.0% rent growth · sell at horizon
- IRR
- 1.8%
- Equity multiple
- 1.07×
- Total profit
- $1,608
- Equity at exit
- $12,659
- IRR
- 11.4%
- Equity multiple
- 1.89×
- Total profit
- $21,229
- Equity at exit
- $7,341
Cash invested: $23,772 (down + closing). Projections, not guarantees.
Landlord ↔ Tenant lean methodology
- Overall (STATE)
- 43 Moderately Tenant-Leaning
- State Illinois
- 43 Moderately Tenant-Leaning · D+7
- County
- — inherits STATE
- City
- — inherits STATE
ZIP-level market 62906
- Home prices YoY
- -13.6%
- Active inventory
- 38
- Price-to-rent
- 6.8×
Monthly cashflow live
- Estimated rent
- $1,048 medium interval (Pro) →
- Mortgage (P&I)
- −$445
- Tax est. 1.5%
- −$106 /mo · $1,274/yr
- Insurance
- −$35
- HOA
- −$0
- Vacancy / Maint / Mgmt
- −$220
- Net cashflow
- $241
Break-even live
UW: 25.0% down · 7.5% · 30yr · 1.5% tax · 5.0% vac · 8.0% maint · 8.0% mgmt
Financing live
Cash to close
- Down payment
- $21,225
- Closing costs
- $2,547
- Reserves months
- —
- Total cash needed
- —
Loan-product check · same deal, 3 products live
Conventional
25% down · 7.5% · 30yr
- Down + closing
- —
- Monthly P&I
- —
- Monthly cashflow
- —
- DSCR
- —
- Eligible?
- —
Personal DTI + credit; lowest rate.
DSCR
20% down · 8.5% · 30yr
- Down + closing
- —
- Monthly P&I
- —
- Monthly cashflow
- —
- DSCR
- —
- Eligible?
- —
No personal income docs; deal must DSCR.
Hard money
10% down · 12.0% · 12mo
- Down + closing
- —
- Monthly P&I
- —
- Monthly cashflow
- —
- DSCR
- —
- Eligible?
- —
Short-term bridge; refi at stabilization.
Listing history 9 events
-
2026-04-30status Pending
-
2026-03-26status Active
-
2026-03-19historical Under Contract
-
2026-02-20$84,900 Active
-
2024-02-26soldstatus $74,800 187-char remark
Show marketing remark (187 chars)
Cozy home with a great back yard! You'll enjoy a large living room, 2 nice size bedrooms, a deck, large bathroom and plenty of outdoor space! Make an appointment before this one is gone!
-
2024-02-26soldstatus $74,800 Closed 187-char remark
Show marketing remark (187 chars)
Cozy home with a great back yard! You'll enjoy a large living room, 2 nice size bedrooms, a deck, large bathroom and plenty of outdoor space! Make an appointment before this one is gone!
-
2023-12-05historical Under Contract 187-char remark
Show marketing remark (187 chars)
Cozy home with a great back yard! You'll enjoy a large living room, 2 nice size bedrooms, a deck, large bathroom and plenty of outdoor space! Make an appointment before this one is gone!
-
2023-11-30$74,800 187-char remark
Show marketing remark (187 chars)
Cozy home with a great back yard! You'll enjoy a large living room, 2 nice size bedrooms, a deck, large bathroom and plenty of outdoor space! Make an appointment before this one is gone!
-
2023-11-30$74,800 Active 187-char remark
Show marketing remark (187 chars)
Cozy home with a great back yard! You'll enjoy a large living room, 2 nice size bedrooms, a deck, large bathroom and plenty of outdoor space! Make an appointment before this one is gone!
ⓘ Source: listings_history table (triggers on properties + properties_extension) + one-shot
backfill from property_details.listing_events for pre-trigger history.
Climate risk First Street
- Flood 1/10 Low FEMA zone X (unshaded) · 0% chance over 30 yrs
- Wildfire 1/10 Low
- Heat 5/10 Major 7 d/yr ≥107°F today · 21 d/yr by 30 yrs out
- Wind 2/10 Low 3% chance of damaging wind over 30 yrs
- Air quality 1/10 Low 0 unhealthy d/yr today · 0 by 30 yrs out
Nearby sold comps map
Loading sold comps map…
Walkable amenities ~0.75 mi
Loading nearby amenities…
Taxation est. · year 1
- Rental income
- $12,573
- − Mortgage interest
- −$4,756
- − Property taxes
- −$1,274
- − Insurance
- −$424
- − Repairs & maintenance
- −$1,006
- − Management
- −$1,006
- − Depreciation
- −$2,470
- Taxable income
- $1,638
- Est. tax owed @ 24.0%
- −$393
- After-tax cash flow
- $2,499/yr
For passive investors: Depreciation is non-cash, so a rental often shows a tax loss while cash-flowing — sheltering income. Rental losses are passive: they offset passive income freely, and up to $25,000/yr can offset ordinary (W-2) income if you actively participate and your MAGI is under $100k (phasing out to $0 by $150k); unused losses carry forward. On sale, claimed depreciation is recaptured at up to 25%, and gains may owe capital-gains tax (a 1031 exchange can defer both). Figures are a year-1 estimate at your 24.0% rate — not tax advice; consult a CPA.
Schools (NCES district)
- District
- Anna Jonesboro Chsd 81
- NCES district ID
- 1703780
- Math proficiency
- 20% ▲ 5.00%
- Reading proficiency
- 30% ▲ 5.00%
- Median HH income
- $42,213
- Composite
- 24.33/100
- National rank
- #13113
- State rank
- #623 of 919 in IL
Livability — Anna
- Score
- 56/100
- State rank
- #1184
- US rank
- #22395
Category grades
Schools grade is shown separately in the Schools card above.
Census & demographics
- Census place
- Anna, IL
- Population (ZIP)
- 7,218
Population outlook (Union County) Hauer SSP2
- Today (2025)
- 16,606 people
- By 2030
- 16,055 · -3.3%
- By 2040
- 14,875 · -10.4%
- By 2050
- 13,645 · -17.8%
- By 2075
- 10,704 · -35.5%
- By 2100
- 7,880 · -52.5%
Race, ethnicity, and origin ACS 2023
- Neighborhood character
- Predominantly White (93%)
- Race & ethnicity
- White 93% Two or more races 5% Hispanic / Latino 3% Black 1%
- Common ancestry
- Slovak 3% Lithuanian 2% Serbian 2%
- Foreign-born
- 2% · Canada
- Languages at home
- 97% English-only · Spanish 3%
Political lean MEDSL · Union
- 2024 margin
- Solid R (+43.2) · D 27.8% · R 71.0% · Other 1.2%
- 2008→2024 swing
- -31.3pp toward R · 2008: -11.9pp · 2024: -43.2pp
- All cycles
- 2024: R+43.2 2020: R+40.2 2016: R+39.8 2012: R+21.9 2008: R+11.9
Not yet ingested
- Civics
- —
Market trends
- HPI YoY
- ▼ -20.17%
- Current HPI
- 128.4925
- Rent YoY
- —
- Metro
- —
- State GDP YoY
- ▲ 1.59%
- F500 in state
- 60
Industry mix (Fortune 500 HQ in IL)
| Industry | F500 HQs | Revenue |
|---|---|---|
| Insurance | 4 | $201B |
|
||
| Consumer Goods | 4 | $87B |
|
||
| Industrial Machinery | 3 | $64B |
|
||
| Healthcare | 2 | $55B |
|
||
| Retail / Pharmacy | 1 | $148B |
|
||
| Agriculture / Food | 1 | $86B |
|
||
Price history
+13.5% since first listed9 events — show timeline
- 2026-04-30 Pending — RMLSA as Distributed by MLS Grid
- 2026-03-26 Relisted — RMLSA as Distributed by MLS Grid
- 2026-03-19 Contingent — RMLSA as Distributed by MLS Grid
- 2026-02-20 Listed $84,900 RMLSA as Distributed by MLS Grid
- 2024-02-26 Sold (MLS) $74,800 RMLSA as Distributed by MLS Grid
- 2024-02-26 Sold (MLS) $74,800 MRED as Distributed by MLS Grid
- 2023-12-05 Contingent — RMLSA as Distributed by MLS Grid
- 2023-11-30 Listed $74,800 RMLSA as Distributed by MLS Grid
- 2023-11-30 Listed $74,800 MRED as Distributed by MLS Grid
Cash-flow waterfall
monthlySold comps — $/sqft
last 12 mo · ≤1 miLoading sold comps…