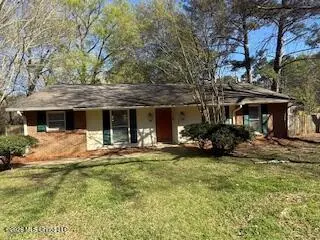
117 Shenandoah Rd · Flowood, MS
Flood risk 7/10 · Major
- FEMA flood zone
- X (unshaded)
- Chance of flooding over 30 yrs
- 0.99%
- Est. flood insurance / yr
- $507 – $1,088
Fire risk 3/10 · Minor
- Est. fire insurance / yr
- $1,241 – $2,305
Heat risk 7/10 · Major
- Hot days now (above 108°F)
- 7 days/yr
- Hot days in 30 yrs
- 20 days/yr
Wind risk 8/10 · Major
- Chance of severe wind over 30 yrs
- 80.0%
Air-quality risk 2/10 · Minimal
- Unhealthy air days now
- 1 days/yr
- Unhealthy air days in 30 yrs
- 1 days/yr
Risk factors via First Street. Map © Google.
Why this score? — see what drove the B+ grade
The composite is a weighted blend of 9 inputs, each scored 0–100. Each bar is that input's sub-score; the figure is the points it added to the 100-point composite (weight × sub-score).
- Cash flow +29.2/30.0
- ARV discount +15.0/15.0
- DSCR +10.0/10.0
- 1% rule +7.7/10.0
- Schools +4.6/10.0
- Livability +3.9/5.0
- Rent growth +3.2/5.0
- Condition / age +2.5/5.0
- Appreciation +0.0/10.0
$165,000
🖨 Deal sheet 📄 Offer letter ✓ Due diligence
Listing remarks MLS
You don't want to miss this beautiful 3 Bedroom, 2 Bathroom home on a large corner lot in Bellegrove subdivision! Fresh Paint, New Roof, and New A/C Unit!! The foyer with coat closet leads into the main living and dining area. This home features wood-look flooring throughout the living space with a brick fireplace, gorgeous mantle, and is open to the spacious dining area. The kitchen includes a pantry and space for a breakfast area. The hallway leads to the master suite and bathroom, two other spacious bedrooms, and the guest bathroom! There is an additional linen/storage closet at the end of the hallway. The huge backyard features a concrete patio, full privacy fence, storage room, and an additional outdoor storage shed. Conveniently located in Bellegrove subdivision! Schedule an appointment for your private viewing today!!
Key facts
- Fresh paint
- New carpet
- Renovated bathrooms
Tags
Neighborhood map
What this means for you Summary
Snapshot
- This is a 3-bed/1.0-bath single-family listed at $165k.
Deal economics
- At list price, monthly cash flow is $508 ($6k/yr) — positive.
- The deal already cash-flows at list — no discount required.
- Meets the 1% rule at list price ($2k rent vs $165k).
- Cap rate 10.5% vs local median 4.3% in Flowood — top-decile yield for the area; either an underpriced asset or a hidden risk that comps aren't pricing in. Stress-test before assuming the spread holds.
Location & tenants
- Location reads 77/100 on livability (#10 in MS, #3,075 nationally) — a middle-class / working-renter tenant base. Strengths: crime A+, cost of living A+, housing A+; Watch: amenities F, commute F.
- Rankin County School District (rural): math 56% / reading 48% proficiency, ranked #6 of 130 in MS (top 5%) — acceptable for families but not a draw, mixed tenant base, ~2y average lease.
- Zoned schools: Highland Bluff Elementary (math 52% / reading 50%, grade C-, #58 of 375 statewide, top 15%, 577 students, 100% FRL); Northwest Rankin Middle School (math 63% / reading 51%, grade B, #13 of 179 statewide, top 7%, 1,374 students, 100% FRL); Northwest Rankin High School (math 48% / reading 42%, grade D-, #34 of 197 statewide, top 17%, 1,898 students, 100% FRL) — zoned schools average 100% FRL vs 35% district-wide (65 pts higher); higher-poverty schools than district average — tighter screening recommended.
- Market conditions: Rents rising (+2.9%/yr); 433 active listings in the ZIP; 9 comparable units currently listed for rent nearby; rentals at typical pace (median 23d on market — plan ~3-4 weeks tenant-placement turnaround); solid renter incomes; 343 units permitted in Rankin County in 2024 (0 in 5+ unit buildings).
Forward outlook
- Local home prices are declining (-3.0%/yr); year-one equity from $1k of loan paydown is wiped out by about $5k of value loss. Plan a longer hold.
- Rankin County population projected at +17% by 2050 — long-run rental-demand tailwind backs the buy-and-hold thesis.
- At projected returns (-3.0% appreciation + 2.9% rent growth), your $46k cash investment doubles in ~9 years — after that, you're playing with house money.
Negotiation context
- Only 12 days on market — expect competitive offers; lowballing is unlikely to land.
- 2 sale attempts since 7y ago with the ask held roughly flat each time — persistent listings suggest the price (not the market) is what's stuck; bring a comps-based counter.
Risks & watch-outs
- Watch-outs: flood insurance adds $66/mo.
- Climate carrying-cost: major flood risk; severe wind risk, 80% chance of damaging wind over 30y; extreme-heat days projected 7→20/yr by 2055 (HVAC capex compounding) — expect insurance premiums to compound above CPI over the hold.
Questions for the listing agent
- What's the actual annual flood-insurance premium (NFIP or private), and is the property in a SFHA with mandatory coverage?
- Is there a deadline driving the sale (1031 exchange, divorce, estate, relocation)? That informs how much negotiation room exists.
- Schools are B-rated — typically a magnet for longer-tenancy family renters. What's the average tenant stay here, and is there a school-zone premium baked into asking?
- What's the average days-on-market for RENTAL listings here right now (not sales)? A rising rental-DOM trend means longer vacancies and softer asking-rent achievability than the comps imply.
- What's the recent tenant-quality profile in this submarket — average credit score on applications, eviction rate, late-payment / NSF rate, and stable-employment percentage? A property-management company in the area should have these aggregated.
- How much new for-sale + rental construction is in the pipeline within 1–3 miles? Heavy new supply typically softens prices + rents 12–24 months out; constrained supply supports both.
Investment metrics
- 1% rule
- 1.27% ✓
- Cap rate
- 10.47%
- Cash-on-cash
- 14.91%
- DSCR
- 1.66
- GRM
- 6.6
CMA / ARV
- ARV (on-the-fly)
- $233,864
- Comps found
- 12
Show comp detail 12 sales within ~0.75 mi
| Address | Dist | Beds/Ba | Sqft | Sold | Price | $/sf | Match |
|---|---|---|---|---|---|---|---|
| 117 Shenandoah Rd | 0.00mi | 3/2.0 | 1,426 (0%) | 1mo | $165,000 | $116 | 95 |
| 169 Bellegrove Cir | 0.53mi | 3/2.0 | 1,394 (-2%) | 2mo | $220,000 | $158 | 66 |
| 1 Brandy Village Cv | 0.37mi | 3/2.0 | 1,331 (-7%) | 2mo | $218,000 | $164 | 66 |
| 408 Pinebrook Cir | 0.58mi | 3/2.0 | 1,402 (-2%) | 3mo | $239,900 | $171 | 64 |
| 102 Cumberland Rd | 0.48mi | 3/2.0 | 1,335 (-6%) | 0mo | $145,000 | $109 | 63 |
| 123 Cumberland Rd | 0.50mi | 3/2.0 | 1,346 (-6%) | 1mo | $219,900 | $163 | 63 |
| 117 Cumberland Rd | 0.51mi | 3/2.0 | 1,339 (-6%) | 3mo | $219,900 | $164 | 60 |
| 203 Lotus Dr | 0.73mi | 3/2.0 | 1,408 (-1%) | 1mo | $269,900 | $192 | 59 |
| 191 Bellegrove Cir | 0.33mi | 3/2.0 | 1,242 (-13%) | 3mo | $193,500 | $156 | 57 |
| 100 Vine Ln | 0.70mi | 2/2.0 (-1) | 1,381 (-3%) | 0mo | $209,900 | $152 | 53 |
| 148 W Pinebrook Dr | 0.65mi | 3/2.0 | 1,604 (+12%) | 0mo | $289,900 | $181 | 44 |
| 504 Pinebark Cv | 0.67mi | 3/2.0 | 1,585 (+11%) | 5mo | $286,000 | $180 | 42 |
Match score weights: distance 35% · size 25% · config 20% · recency 20%. Top-matched comps best support the ARV.
Projected returns pro-forma
-3.0% appreciation · 2.9% rent growth · sell at horizon
- IRR
- 3.0%
- Equity multiple
- 1.12×
- Total profit
- $5,419
- Equity at exit
- $24,602
- IRR
- 12.5%
- Equity multiple
- 1.99×
- Total profit
- $45,627
- Equity at exit
- $14,266
Cash invested: $46,200 (down + closing). Projections, not guarantees.
Landlord ↔ Tenant lean methodology
- Overall (STATE)
- 90 Strongly Landlord-Friendly
- State Mississippi
- 90 Strongly Landlord-Friendly · R+11
- County
- — inherits STATE
- City
- — inherits STATE
ZIP-level market 39047
- Home prices YoY
- -32.6%
- Rents YoY
- 2.9%
- Active inventory
- 433
- Price-to-rent
- 6.6×
Monthly cashflow live
- Estimated rent
- $2,090 high interval (Pro) →
- Mortgage (P&I)
- −$865
- Tax from tax record
- −$143 /mo · $1,716/yr
- Insurance
- −$69
- Flood insurance flood zone
- −$66 /mo · $798/yr
- HOA
- −$0
- Vacancy / Maint / Mgmt
- −$439
- Net cashflow
- $508
Break-even live
UW: 25.0% down · 7.5% · 30yr · 1.5% tax · 5.0% vac · 8.0% maint · 8.0% mgmt
Financing live
Cash to close
- Down payment
- $41,250
- Closing costs
- $4,950
- Reserves months
- —
- Total cash needed
- —
Loan-product check · same deal, 3 products live
Conventional
25% down · 7.5% · 30yr
- Down + closing
- —
- Monthly P&I
- —
- Monthly cashflow
- —
- DSCR
- —
- Eligible?
- —
Personal DTI + credit; lowest rate.
DSCR
20% down · 8.5% · 30yr
- Down + closing
- —
- Monthly P&I
- —
- Monthly cashflow
- —
- DSCR
- —
- Eligible?
- —
No personal income docs; deal must DSCR.
Hard money
10% down · 12.0% · 12mo
- Down + closing
- —
- Monthly P&I
- —
- Monthly cashflow
- —
- DSCR
- —
- Eligible?
- —
Short-term bridge; refi at stabilization.
Rent comps 9 comps
| Address | Beds | Baths | Sqft | Rent | $/sqft | DOM | Units | Dist |
|---|---|---|---|---|---|---|---|---|
| 218 Shenandoah Rd N Brandon, MS | 3.0 | 2.0 | 1625 | $2,006 | $1.23 | 43d | 1 | 0.17mi |
| 199 Dogwood Cir Brandon, MS | 3.0 | 2.0 | 1550 | $1,900 | $1.23 | 44d | 1 | 0.22mi |
| 183 Cumberland Rd Brandon, MS | 3.0 | 2.0 | 1097 | $1,750 | $1.60 | 21d | 1 | 0.32mi |
| 413 Shenandoah Rd N Brandon, MS | 4.0 | 2.0 | 1715 | $2,056 | $1.20 | 13d | 1 | 0.39mi |
| 154 Plum Tree Rd Brandon, MS | 3.0 | 2.0 | 1289 | $1,931 | $1.50 | 23d | 1 | 0.46mi |
| 133 Cumberland Rd Brandon, MS | 4.0 | 3.0 | 1846 | $2,225 | $1.21 | 23d | 1 | 0.47mi |
| 352 Brendalwood Cv Brandon, MS | 2.0 | 1.5 | 1248 | $1,157 | $0.93 | 43d | 1 | 1.01mi |
| 500 Avalon Way Brandon, MS | 2.0–3.0 | 2.0 | 1287 | $2,052 | $1.59 | 13d | 6 | 1.05mi |
| 520 Vine Dr Flowood, MS | 2.0–3.0 | 2.0 | 1114 | $1,745 | $1.57 | 13d | 8 | 1.30mi |
Listing history 4 events
-
2026-03-27status Pending
-
2026-03-15$165,000 Active
-
2019-06-20soldstatus 836-char remark
Show marketing remark (836 chars)
You don't want to miss this beautiful 3 Bedroom, 2 Bathroom home on a large corner lot in Bellegrove subdivision! Fresh Paint, New Roof, and New A/C Unit!! The foyer with coat closet leads into the main living and dining area. This home features wood-look flooring throughout the living space with a brick fireplace, gorgeous mantle, and is open to the spacious dining area. The kitchen includes a pantry and space for a breakfast area. The hallway leads to the master suite and bathroom, two other spacious bedrooms, and the guest bathroom! There is an additional linen/storage closet at the end of the hallway. The huge backyard features a concrete patio, full privacy fence, storage room, and an additional outdoor storage shed. Conveniently located in Bellegrove subdivision! Schedule an appointment for your private viewing today!!
-
2019-03-28$119,900 836-char remark
Show marketing remark (836 chars)
You don't want to miss this beautiful 3 Bedroom, 2 Bathroom home on a large corner lot in Bellegrove subdivision! Fresh Paint, New Roof, and New A/C Unit!! The foyer with coat closet leads into the main living and dining area. This home features wood-look flooring throughout the living space with a brick fireplace, gorgeous mantle, and is open to the spacious dining area. The kitchen includes a pantry and space for a breakfast area. The hallway leads to the master suite and bathroom, two other spacious bedrooms, and the guest bathroom! There is an additional linen/storage closet at the end of the hallway. The huge backyard features a concrete patio, full privacy fence, storage room, and an additional outdoor storage shed. Conveniently located in Bellegrove subdivision! Schedule an appointment for your private viewing today!!
ⓘ Source: listings_history table (triggers on properties + properties_extension) + one-shot
backfill from property_details.listing_events for pre-trigger history.
Tax reassessment forecast MS · Resets to sale price
- Current annual tax
- $1,716 · $143/mo
- Projected year-2 tax
- $1,716 · $143/mo
- Expected delta
- $0/yr ($0/mo · 0.0%)
ⓘ Screening estimate from a state-policy table — verify with the county assessor before closing.
Climate risk First Street
- Flood 7/10 Severe FEMA zone X (unshaded) · 99% chance over 30 yrs
- Wildfire 3/10 Moderate
- Heat 7/10 Severe 7 d/yr ≥108°F today · 20 d/yr by 30 yrs out
- Wind 8/10 Severe 80% chance of damaging wind over 30 yrs
- Air quality 2/10 Low 1 unhealthy d/yr today · 1 by 30 yrs out
Nearby sold comps map
Loading sold comps map…
Walkable amenities ~0.75 mi
Loading nearby amenities…
Taxation est. · year 1
- Rental income
- $25,080
- − Mortgage interest
- −$9,243
- − Property taxes
- −$1,716
- − Insurance
- −$1,622
- − Repairs & maintenance
- −$2,006
- − Management
- −$2,006
- − Depreciation
- −$4,800
- Taxable income
- $3,687
- Est. tax owed @ 24.0%
- −$885
- After-tax cash flow
- $5,207/yr
For passive investors: Depreciation is non-cash, so a rental often shows a tax loss while cash-flowing — sheltering income. Rental losses are passive: they offset passive income freely, and up to $25,000/yr can offset ordinary (W-2) income if you actively participate and your MAGI is under $100k (phasing out to $0 by $150k); unused losses carry forward. On sale, claimed depreciation is recaptured at up to 25%, and gains may owe capital-gains tax (a 1031 exchange can defer both). Figures are a year-1 estimate at your 24.0% rate — not tax advice; consult a CPA.
Schools (NCES district)
- District
- Rankin County School District
- NCES district ID
- 2803830
- Math proficiency
- 56% ▼ -4.00%
- Reading proficiency
- 48% ▼ -6.00%
- Median HH income
- $61,867
- Composite
- 45.62/100
- National rank
- #2587
- State rank
- #6 of 130 in MS
Livability — Flowood
- Score
- 77/100
- State rank
- #10
- US rank
- #3075
Category grades
Schools grade is shown separately in the Schools card above.
Census & demographics
- County
- Rankin County · 123,614 people
- City population
- 9,222
- Metro
- Jackson, MS
- Population (ZIP)
- 40,808
- Household income
- $100,347
- Rent vs Own
- Severe rent burden
- 551.0
Population outlook (Rankin County) Hauer SSP2
- Today (2025)
- 164,317 people
- By 2030
- 171,013 · +4.1%
- By 2040
- 182,723 · +11.2%
- By 2050
- 192,376 · +17.1%
- By 2075
- 209,535 · +27.5%
- By 2100
- 209,534 · +27.5%
Race, ethnicity, and origin ACS 2023
- Neighborhood character
- Predominantly White (77%)
- Race & ethnicity
- White 77% Black 16% Two or more races 4% Hispanic / Latino 2% Asian 1%
- Common ancestry
- Italian 4% Slovak 3% Serbian 3%
- Foreign-born
- 3% · Canada
- Languages at home
- 95% English-only · Spanish 3% Other Indo-European 1% Other Asian/Pacific 1%
Political lean MEDSL · Rankin
- 2024 margin
- Solid R (+47.1) · D 25.9% · R 73.0% · Other 1.0%
- 2008→2024 swing
- +6.4pp toward D · 2008: -53.5pp · 2024: -47.1pp
- All cycles
- 2024: R+47.1 2020: R+45.4 2016: R+52.9 2012: R+51.9 2008: R+53.5
Not yet ingested
- Civics
- —
Market trends
- HPI YoY
- ▼ -79.01%
- Current HPI
- 162.9709
- Rent YoY
- ▲ 2.90%
- Metro
- Jackson, MS
- State GDP YoY
- —
- F500 in state
- 0
Price history
+37.6% since first listed4 events — show timeline
- 2026-03-27 Pending — MLSU
- 2026-03-15 Listed $165,000 MLSU
- 2019-06-20 Sold (MLS) — MLSU
- 2019-03-28 Listed $119,900 MLSU
Property tax history
+12.4%/yrLatest (2025): $1,716 · +5.4% YoY. Source: county tax records.
Cash-flow waterfall
monthlySold comps — $/sqft
last 12 mo · ≤1 miLoading sold comps…