 🌊 Lakefront
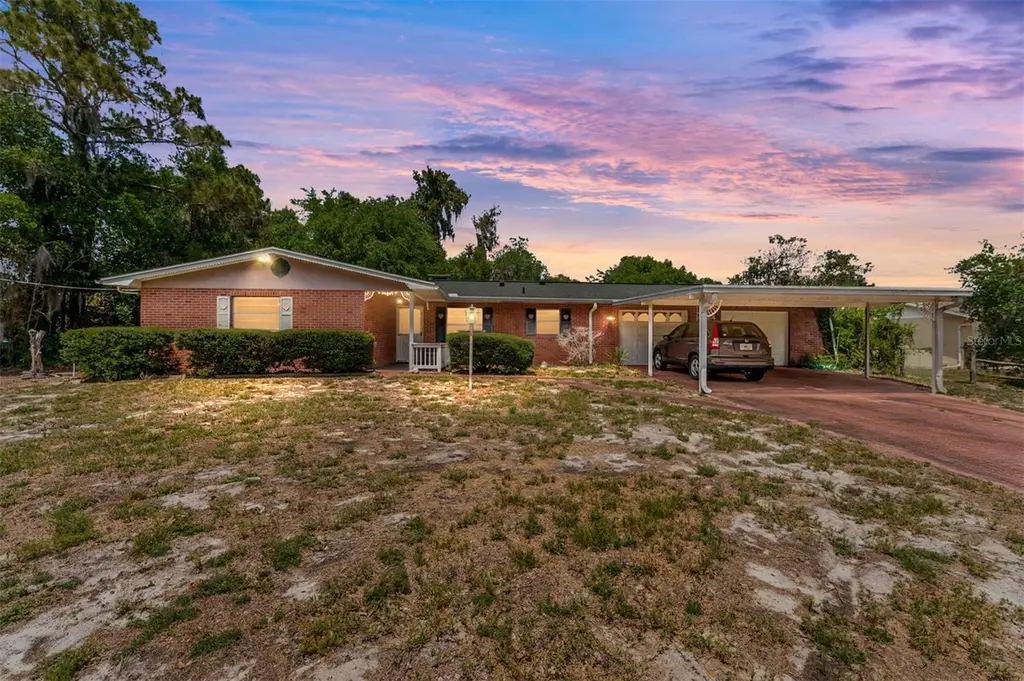
927 S Val Dr · Inverness, FL
Flood risk 1/10 · Minimal
- FEMA flood zone
- X (unshaded)
- Chance of flooding over 30 yrs
- 0.0%
- Est. flood insurance / yr
- $507 – $1,088
Fire risk 5/10 · Moderate
- Est. fire insurance / yr
- $947 – $1,759
Heat risk 9/10 · Severe
- Hot days now (above 108°F)
- 7 days/yr
- Hot days in 30 yrs
- 23 days/yr
Wind risk 9/10 · Severe
- Chance of severe wind over 30 yrs
- 99.0%
Air-quality risk 1/10 · Minimal
- Unhealthy air days now
- 0 days/yr
- Unhealthy air days in 30 yrs
- 0 days/yr
Risk factors via First Street. Map © Google.
Why this score? — see what drove the D+ grade
The composite is a weighted blend of 9 inputs, each scored 0–100. Each bar is that input's sub-score; the figure is the points it added to the 100-point composite (weight × sub-score).
- Cash flow +20.9/30.0
- DSCR +6.6/10.0
- 1% rule +4.4/10.0
- Schools +4.1/10.0
- ARV discount +3.6/15.0
- Livability +3.4/5.0
- Rent growth +2.5/5.0
- Condition / age +2.5/5.0
- Appreciation +0.0/10.0
$235,000
🖨 Deal sheet 📄 Offer letter ✓ Due diligence
Listing remarks MLS
WATERFRONT HOME WITH BEAUTIFUL LANDSCAPING. .. LOTS OF TREES AND GARDENS. OVERSIZED 2 CAR GARAGE, PLUS A CARPORT, FAMILY ROOM WITH FIREPLACE, NEW ROOF IN 2000, 12 X 16 OUT BUILDING WITH ELECTRIC, SPRINKLER SYSTEM, BOAT DOCK AND RAMP, GUEST QUARTERS WITH THEIR OWN ENTRY TO BACK PATIO AREA.
Key facts
- In-law suite
- Great lot
- Updated well
Tags
Property features AI
Finance
- Other: On waterfront (Henderson Lake) with lakefront access and water view; Lakefront extras include boat port, private boat ramp, fishing pier and seawall; Total waterfront frontage 72 feet (36 ft lake frontage, 36 ft lake-chain frontage); Property acreage approximately 0.43 acres (1/4 to less than 1/2 acre)
- Financial info: No lease restrictions indicated; Homestead exemption claimed
- HOA & community: Pets allowed
Exterior
- Parking: Attached garage with 2 garage spaces; Carport with 2 spaces; Driveway; Off-street parking; Guest parking; Oversized parking spaces; Garage door opener; Bathroom in garage
- Security: Private mailbox
- Utilities: Well water; Septic tank; Cable available; Water connected
- Home design: Single-family residence; One story; Fixer condition; Faces southwest
- Construction: Block, brick and concrete construction; Shingle roof; Slab foundation; Estimated building area and living area provided
- Exterior features: Covered, enclosed and screened patios/porches including front and rear porches; Patio; Private mailbox; Storage shed(s); Chain link fencing; Mature landscaping with oak trees; Near golf course and marina; Oversized, dead-end street lot
Interior
- Kitchen: Built-in oven; Cooktop; Microwave; Refrigerator; Solid wood cabinets; Kitchen/open family room layout
- Bedrooms: 3 bedrooms
- Flooring: Carpet; Laminate
- Bathrooms: 3 full bathrooms
- Heating & cooling: Central heating; Central air conditioning
- Interior features: Ceiling fans; Kitchen/family room combo; Living room/dining room combo; Open floorplan; Solid wood cabinets; Programmable thermostat; Walk-in closets; Built-in oven; Cooktop; Microwave; Refrigerator; Carpet flooring; Laminate flooring; Wood-burning fireplace in living room; Den/Library/Office; Interior in-law suite (no private entry); Seven total rooms
- Laundry & utility: Laundry area in garage
Neighborhood map
What this means for you Summary
Snapshot
- This is a 2-bed/2.5-bath single-family listed at $235k.
Deal economics
- At list price, monthly cash flow is $325 ($4k/yr) — positive.
- The deal already cash-flows at list — no discount required.
- To meet the 1% rule (rent ≥ 1% of price), the offer needs to be $220k (6.4% below list).
- Recommended offer: $220k (6.4% below list) — sets the bar for 1% rule.
- Cap rate 8.0% vs local median 4.9% in Inverness — top-decile yield for the area; either an underpriced asset or a hidden risk that comps aren't pricing in. Stress-test before assuming the spread holds.
Location & tenants
- Location reads 67/100 on livability (#564 in FL) — a middle-class / working-renter tenant base. Strengths: cost of living A+, housing A-; Watch: health & safety C-, amenities F, commute F.
- Citrus (rural): math 49% / reading 50% proficiency, ranked #44 of 73 in FL (top 60%) — families likely to look elsewhere, expect single-tenant / working-renter base with shorter leases.
- Zoned schools: Inverness Primary School (math 54% / reading 55%, grade C, #892 of 2,144 statewide, top 44%, 683 students, 65% FRL); Citrus High School (math 34% / reading 51%, grade F, #264 of 667 statewide, top 41%, 1,503 students, 54% FRL) — zoned schools at 60% FRL track the district average.
- Market conditions: 208 active listings in the ZIP; 2 comparable units currently listed for rent nearby; 2,443 units permitted in Citrus County in 2024 (0 in 5+ unit buildings).
Forward outlook
- Local home prices are declining (-3.0%/yr); year-one equity from $2k of loan paydown is wiped out by about $7k of value loss. Plan a longer hold.
- Citrus County population projected to shrink 10% by 2050 — rents likely to lag national; underwrite the cash flow, not the appreciation.
Negotiation context
- Only 2 days on market — expect competitive offers; lowballing is unlikely to land.
- 2 sale attempts since 15y ago with the ask held roughly flat each time — persistent listings suggest the price (not the market) is what's stuck; bring a comps-based counter.
- Current owner paid $110k; list at $235k implies a 114% gain — meaningful room to come down on a strong offer.
Risks & watch-outs
- Climate carrying-cost: severe wind risk, 99% chance of damaging wind over 30y; moderate wildfire risk; extreme-heat days projected 7→23/yr by 2055 (HVAC capex compounding) — expect insurance premiums to compound above CPI over the hold.
Questions for the listing agent
- Built in 1976 — when were the roof, HVAC, electrical panel, plumbing, and water heater last replaced?
- Is there a deadline driving the sale (1031 exchange, divorce, estate, relocation)? That informs how much negotiation room exists.
- Schools are B-rated — typically a magnet for longer-tenancy family renters. What's the average tenant stay here, and is there a school-zone premium baked into asking?
- The area grade is low — what's the realistic commute time and amenity access for the typical tenant pool here? Any planned neighborhood developments (good or bad) we should know about?
- This sits on a lake — are riparian / water-frontage rights deeded with the parcel? Any dock permits, shoreline easements, or HOA water-use restrictions?
- What's the documented flood / surge / shoreline-erosion history here (FEMA AND non-FEMA — e.g., storm surge, creek backup, septic-field saturation)?
- Any water-quality or seasonal algae-bloom issues that affect tenant satisfaction or short-term-rental demand?
- What's the average days-on-market for RENTAL listings here right now (not sales)? A rising rental-DOM trend means longer vacancies and softer asking-rent achievability than the comps imply.
- What's the recent tenant-quality profile in this submarket — average credit score on applications, eviction rate, late-payment / NSF rate, and stable-employment percentage? A property-management company in the area should have these aggregated.
- How much new for-sale + rental construction is in the pipeline within 1–3 miles? Heavy new supply typically softens prices + rents 12–24 months out; constrained supply supports both.
Investment metrics
- 1% rule
- 0.94% ✗
- Cap rate
- 7.95%
- Cash-on-cash
- 5.93%
- DSCR
- 1.26
- GRM
- 8.9
CMA / ARV
- ARV (on-the-fly)
- $216,160
- Comps found
- 11
Show comp detail 11 sales within ~0.75 mi
| Address | Dist | Beds/Ba | Sqft | Sold | Price | $/sf | Match |
|---|---|---|---|---|---|---|---|
| 826 S Val Dr | 0.10mi | 2/2.0 | 1,182 (+6%) | 15mo | $211,340 | $179 | 72 |
| 1005 S Val Dr | 0.02mi | 2/2.0 | 1,222 (+9%) | 14mo | $230,000 | $188 | 71 |
| 7330 E Allen Dr | 0.14mi | 2/2.0 | 1,008 (-10%) | 5mo | $235,000 | $233 | 71 |
| 908 Pritchard Island Rd | 0.47mi | 2/2.0 | 1,148 (+2%) | 3mo | $213,000 | $186 | 70 |
| 814 S Bel Air Dr | 0.16mi | 2/1.5 | 1,019 (-9%) | 8mo | $171,500 | $168 | 67 |
| 1005 S Bel Air Dr | 0.06mi | 2/1.5 | 1,020 (-9%) | 15mo | $205,000 | $201 | 66 |
| 930 Pritchard Island Rd | 0.43mi | 2/2.0 | 1,148 (+2%) | 10mo | $120,000 | $105 | 65 |
| 7426 E Allen Dr | 0.16mi | 2/1.0 | 1,078 (-4%) | 23mo | $280,000 | $260 | 61 |
| 7228 E Oak Isle Dr | 0.34mi | 2/2.0 | 1,248 (+11%) | 12mo | $290,000 | $232 | 53 |
| 975 Pritchard Island Rd | 0.47mi | 2/2.0 | 1,260 (+12%) | 14mo | $245,000 | $194 | 44 |
| 7509 E Gospel Island Rd | 0.74mi | 2/2.0 | 1,288 (+15%) | 23mo | $249,000 | $193 | 20 |
Match score weights: distance 35% · size 25% · config 20% · recency 20%. Top-matched comps best support the ARV.
Projected returns pro-forma
-3.0% appreciation · 3.0% rent growth · sell at horizon
- IRR
- -7.2%
- Equity multiple
- 0.73×
- Total profit
- $-17,462
- Equity at exit
- $35,039
- IRR
- 2.4%
- Equity multiple
- 1.17×
- Total profit
- $11,076
- Equity at exit
- $20,319
Cash invested: $65,800 (down + closing). Projections, not guarantees.
Landlord ↔ Tenant lean methodology
- Overall (STATE)
- 87 Strongly Landlord-Friendly
- State Florida
- 87 Strongly Landlord-Friendly · R+3
- County
- — inherits STATE
- City
- — inherits STATE
ZIP-level market 34450
- Home prices YoY
- -18.7%
- Active inventory
- 208
- Price-to-rent
- 8.9×
Monthly cashflow live
- Estimated rent
- $2,200 medium interval (Pro) →
- Mortgage (P&I)
- −$1,232
- Tax from tax record
- −$82 /mo · $990/yr
- Insurance
- −$98
- HOA
- −$0
- Vacancy / Maint / Mgmt
- −$462
- Net cashflow
- $325
Break-even live
UW: 25.0% down · 7.5% · 30yr · 1.5% tax · 5.0% vac · 8.0% maint · 8.0% mgmt
Financing live
Cash to close
- Down payment
- $58,750
- Closing costs
- $7,050
- Reserves months
- —
- Total cash needed
- —
Loan-product check · same deal, 3 products live
Conventional
25% down · 7.5% · 30yr
- Down + closing
- —
- Monthly P&I
- —
- Monthly cashflow
- —
- DSCR
- —
- Eligible?
- —
Personal DTI + credit; lowest rate.
DSCR
20% down · 8.5% · 30yr
- Down + closing
- —
- Monthly P&I
- —
- Monthly cashflow
- —
- DSCR
- —
- Eligible?
- —
No personal income docs; deal must DSCR.
Hard money
10% down · 12.0% · 12mo
- Down + closing
- —
- Monthly P&I
- —
- Monthly cashflow
- —
- DSCR
- —
- Eligible?
- —
Short-term bridge; refi at stabilization.
Rent comps 2 comps
| Address | Beds | Baths | Sqft | Rent | $/sqft | DOM | Units | Dist |
|---|---|---|---|---|---|---|---|---|
| 908 Pritchard Island Rd Inverness, FL | 2.0 | 2.0 | 1148 | $2,200 | $1.92 | 21d | 1 | 0.44mi |
| 876 Pritchard Island Rd Inverness, FL | 2.0 | 2.0 | 1148 | $2,200 | $1.92 | 21d | 1 | 0.49mi |
Listing history 6 events
-
2026-05-13status Pending
-
2026-05-11$235,000 Active
-
2011-12-30soldstatus $110,000 289-char remark
Show marketing remark (289 chars)
WATERFRONT HOME WITH BEAUTIFUL LANDSCAPING. .. LOTS OF TREES AND GARDENS. OVERSIZED 2 CAR GARAGE, PLUS A CARPORT, FAMILY ROOM WITH FIREPLACE, NEW ROOF IN 2000, 12 X 16 OUT BUILDING WITH ELECTRIC, SPRINKLER SYSTEM, BOAT DOCK AND RAMP, GUEST QUARTERS WITH THEIR OWN ENTRY TO BACK PATIO AREA.
-
2011-08-28$124,900 289-char remark
Show marketing remark (289 chars)
WATERFRONT HOME WITH BEAUTIFUL LANDSCAPING. .. LOTS OF TREES AND GARDENS. OVERSIZED 2 CAR GARAGE, PLUS A CARPORT, FAMILY ROOM WITH FIREPLACE, NEW ROOF IN 2000, 12 X 16 OUT BUILDING WITH ELECTRIC, SPRINKLER SYSTEM, BOAT DOCK AND RAMP, GUEST QUARTERS WITH THEIR OWN ENTRY TO BACK PATIO AREA.
-
1992-06-01soldstatus $100,000
-
1983-01-01soldstatus $66,000
ⓘ Source: listings_history table (triggers on properties + properties_extension) + one-shot
backfill from property_details.listing_events for pre-trigger history.
Tax reassessment forecast FL · Resets to sale price
- Current annual tax
- $990 · $82/mo
- Projected year-2 tax
- $1,950 · $163/mo
- Expected delta
- +$961/yr (+$80/mo · 97.1%)
ⓘ Screening estimate from a state-policy table — verify with the county assessor before closing.
Climate risk First Street
- Flood 1/10 Low FEMA zone X (unshaded) · 0% chance over 30 yrs
- Wildfire 5/10 Major
- Heat 9/10 Extreme 7 d/yr ≥108°F today · 23 d/yr by 30 yrs out
- Wind 9/10 Extreme 99% chance of damaging wind over 30 yrs
- Air quality 1/10 Low 0 unhealthy d/yr today · 0 by 30 yrs out
Nearby sold comps map
Loading sold comps map…
Walkable amenities ~0.75 mi
Loading nearby amenities…
Taxation est. · year 1
- Rental income
- $26,400
- − Mortgage interest
- −$13,164
- − Property taxes
- −$990
- − Insurance
- −$1,175
- − Repairs & maintenance
- −$2,112
- − Management
- −$2,112
- − Depreciation
- −$6,836
- Taxable income
- $11
- Est. tax owed @ 24.0%
- −$3
- After-tax cash flow
- $3,900/yr
For passive investors: Depreciation is non-cash, so a rental often shows a tax loss while cash-flowing — sheltering income. Rental losses are passive: they offset passive income freely, and up to $25,000/yr can offset ordinary (W-2) income if you actively participate and your MAGI is under $100k (phasing out to $0 by $150k); unused losses carry forward. On sale, claimed depreciation is recaptured at up to 25%, and gains may owe capital-gains tax (a 1031 exchange can defer both). Figures are a year-1 estimate at your 24.0% rate — not tax advice; consult a CPA.
Schools (NCES district)
- District
- Citrus
- NCES district ID
- 1200270
- Math proficiency
- 49% ▼ -10.00%
- Reading proficiency
- 50% ▼ -6.00%
- Median HH income
- $38,618
- Composite
- 41.28/100
- National rank
- #3519
- State rank
- #44 of 73 in FL
Livability — Inverness
- Score
- 67/100
- State rank
- #564
- US rank
- #10791
Category grades
Schools grade is shown separately in the Schools card above.
Census & demographics
- City population
- 10,621
- Population (ZIP)
- 10,408
Population outlook (Citrus County) Hauer SSP2
- Today (2025)
- 138,622 people
- By 2030
- 136,886 · -1.3%
- By 2040
- 132,009 · -4.8%
- By 2050
- 125,196 · -9.7%
- By 2075
- 108,570 · -21.7%
- By 2100
- 84,454 · -39.1%
Race, ethnicity, and origin ACS 2023
- Neighborhood character
- Predominantly White (81%)
- Race & ethnicity
- White 81% Two or more races 10% Hispanic / Latino 8% Asian 3% Black 1%
- Hispanic origin (detail)
- Mexican 3% Puerto Rican 3%
- Common ancestry
- Romanian 4% Slovak 3% Lithuanian 2%
- Foreign-born
- 8% · Canada
- Languages at home
- 90% English-only · Spanish 4% Other Indo-European 3% Tagalog/Filipino 1%
Political lean MEDSL · Citrus
- 2024 margin
- Solid R (+45.9) · D 26.8% · R 72.6%
- 2008→2024 swing
- -29.8pp toward R · 2008: -16.1pp · 2024: -45.9pp
- All cycles
- 2024: R+45.9 2020: R+41.0 2016: R+39.7 2012: R+21.9 2008: R+16.1
Not yet ingested
- Civics
- —
Market trends
- HPI YoY
- ▼ -72.56%
- Current HPI
- 315.9725
- Rent YoY
- —
- Metro
- —
- State GDP YoY
- ▲ 3.28%
- F500 in state
- 36
Industry mix (Fortune 500 HQ in FL)
| Industry | F500 HQs | Revenue |
|---|---|---|
| Industrial Technology | 2 | $29B |
|
||
| Insurance | 2 | $17B |
|
||
| Retail | 1 | $60B |
|
||
| Technology Distribution | 1 | $58B |
|
||
| Homebuilding | 1 | $35B |
|
||
| Technology Manufacturing | 1 | $35B |
|
||
Price history
+256.1% since first listed6 events — show timeline
- 2026-05-13 Pending — Stellar MLS as Distributed by MLS Grid
- 2026-05-11 Listed $235,000 Stellar MLS as Distributed by MLS Grid
- 2011-12-30 Sold (MLS) $110,000 RACC
- 2011-08-28 Listed $124,900 RACC
- 1992-06-01 Sold (Public Records) $100,000 Public Records
- 1983-01-01 Sold (Public Records) $66,000 Public Records
Property tax history
+2.2%/yrLatest (2025): $990 · +8.6% YoY. Source: county tax records.
Cash-flow waterfall
monthlySold comps — $/sqft
last 12 mo · ≤1 miLoading sold comps…