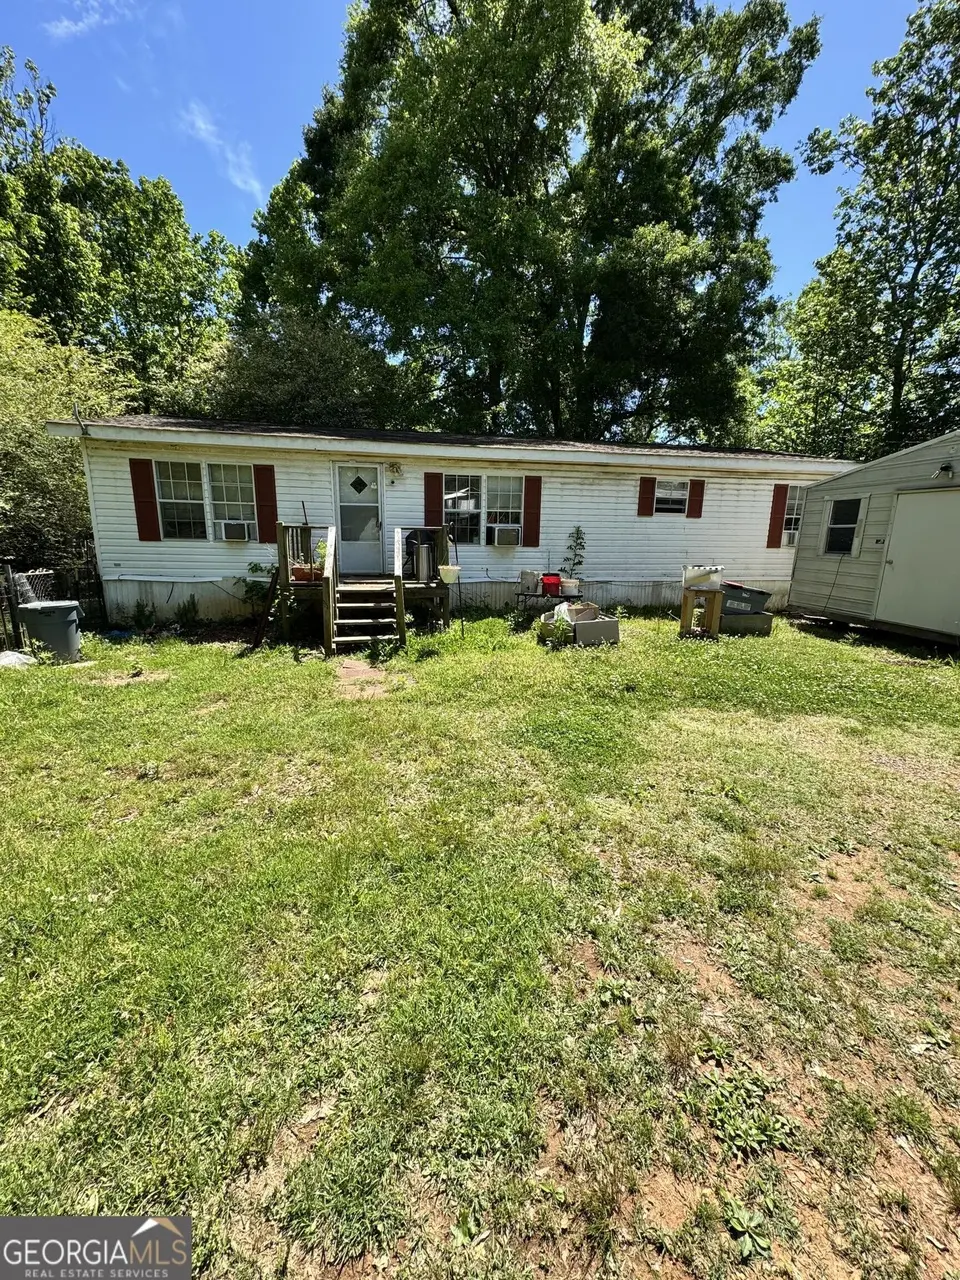
477 Knight Rd · Cedartown, GA
Flood risk 1/10 · Minimal
- FEMA flood zone
- X (unshaded)
- Chance of flooding over 30 yrs
- 0.0%
- Est. flood insurance / yr
- $507 – $1,088
Fire risk 7/10 · Major
- Est. fire insurance / yr
- $963 – $1,789
Heat risk 5/10 · Moderate
- Hot days now (above 105°F)
- 7 days/yr
- Hot days in 30 yrs
- 19 days/yr
Wind risk 4/10 · Minor
- Chance of severe wind over 30 yrs
- 18.0%
Air-quality risk 3/10 · Minor
- Unhealthy air days now
- 2 days/yr
- Unhealthy air days in 30 yrs
- 3 days/yr
Risk factors via First Street. Map © Google.
Why this score? — see what drove the B- grade
The composite is a weighted blend of 9 inputs, each scored 0–100. Each bar is that input's sub-score; the figure is the points it added to the 100-point composite (weight × sub-score).
- Cash flow +30.0/30.0
- 1% rule +10.0/10.0
- DSCR +10.0/10.0
- ARV discount +7.5/15.0
- Livability +3.2/5.0
- Rent growth +2.5/5.0
- Condition / age +2.5/5.0
- Schools +2.1/10.0
- Appreciation +0.0/10.0
$49,000
🖨 Deal sheet (PDF) 📄 Offer letter ✓ Due diligence
Listing remarks
1996 manufactured home situated on approximately 1 acre of owned land with a private, wooded setting. This 3-bedroom, 2-bath home provides 1,248 sq ft with a comfortable layout featuring a spacious living area with a fireplace, separate kitchen/dining space, laundry area, and generous outdoor space. Exterior features include driveway parking. Enjoy the quiet setting, mature trees, and value-add potential of this property.
Key facts
- Spacious living area
- Driveway parking
- 1 acre lot
Tags
Property features AI
Finance
- Other: Accepts Cash, Conventional, FHA, USDA Loan, VA Loan
- HOA & community: No HOA; No association fees
Exterior
- Parking: Carport; Off-street parking; Over 1 space per unit (2 total parking spaces)
- Utilities: Public water; Septic tank; Electricity available; Water available
- Home design: Single family residence; One story; Resale property
- Construction: Built in 1996; Vinyl siding; Composition roof; Owner-provided building area (1248)
- Exterior features: Open lot; Other exterior features
Interior
- Kitchen: Dishwasher; Refrigerator; Electric water heater
- Bedrooms: 3 bedrooms on the main level
- Flooring: Carpet; Laminate; Vinyl
- Bathrooms: 2 full bathrooms (both on the main level)
- Heating & cooling: Forced air heating; Electric cooling; Window unit(s)
- Interior features: Separate shower; Soaking tub; Walk-in closet(s); Fireplace (1)
- Laundry & utility: Laundry area (other)
Neighborhood map
What this means for you Summary
Snapshot
- This is a 3-bed/2.0-bath manufactured listed at $49k.
Deal economics
- At list price, monthly cash flow is $1k ($12k/yr) — positive.
- The deal already cash-flows at list — no discount required.
- Meets the 1% rule at list price ($2k rent vs $49k).
- Recommended offer: $48k (3.0% below list) — sets the bar for market timing.
- Cap rate 31.8% vs local median 3.2% in Cedartown — top-decile yield for the area; either an underpriced asset or a hidden risk that comps aren't pricing in. Stress-test before assuming the spread holds.
Location & tenants
- Location reads 64/100 on livability (#253 in GA) — a middle-class / working-renter tenant base. Strengths: cost of living A+, housing A+, health & safety A+; Watch: crime D+, amenities F, commute F.
- Polk County (town): math 21% / reading 28% proficiency, ranked #128 of 174 in GA (top 74%) — low school quality limits family demand, transient renter base, plan for 1-2y turnover; 62% free/reduced lunch — lower-income household profile, screen leases tightly.
- Zoned schools: Rockmart Middle School (math 22% / reading 31%, grade F, #282 of 470 statewide, top 61%, 706 students, 78% FRL); Rockmart High School (math 8% / reading 22%, grade F, #294 of 424 statewide, top 70%, 950 students, 78% FRL) — zoned schools average 78% FRL vs 62% district-wide (16 pts higher); higher-poverty schools than district average — tighter screening recommended.
- Market conditions: 198 active listings in the ZIP; 128 units permitted in Polk County in 2024 (0 in 5+ unit buildings).
- This rent runs 36% of the median local income ($57k/yr) — at the standard rent-burdened threshold; future hikes will face affordability resistance.
Forward outlook
- Local home prices are declining (-3.0%/yr); year-one equity from $339 of loan paydown is wiped out by about $1k of value loss. Plan a longer hold.
- Polk County population projected to shrink 10% by 2050 — rents likely to lag national; underwrite the cash flow, not the appreciation.
- At projected returns (-3.0% appreciation + 3.0% rent growth), your $14k cash investment doubles in ~2 years — after that, you're playing with house money.
Negotiation context
- It's been on market 38 days — a 3% lower offer ($48k) is reasonable based on typical stale-listing flexibility.
Risks & watch-outs
- Climate carrying-cost: major wildfire risk; extreme-heat days projected 7→19/yr by 2055 (HVAC capex compounding) — expect insurance premiums to compound above CPI over the hold.
Questions for the listing agent
- It's been on market 38 days. Have you received any prior offers? Is the seller open to a 3% concession, seller financing, or rate buy-down credit?
- Is there a deadline driving the sale (1031 exchange, divorce, estate, relocation)? That informs how much negotiation room exists.
- Schools are F-rated, which usually means shorter tenancies and higher turnover. Who's the typical renter profile here, and what's been the actual vacancy rate?
- Crime grade is D in this area — have there been break-ins, vandalism, or insurance claims at this property in the last 3 years? What carrier currently insures it and at what premium?
- What's the average days-on-market for RENTAL listings here right now (not sales)? A rising rental-DOM trend means longer vacancies and softer asking-rent achievability than the comps imply.
- What's the recent tenant-quality profile in this submarket — average credit score on applications, eviction rate, late-payment / NSF rate, and stable-employment percentage? A property-management company in the area should have these aggregated.
- How much new for-sale + rental construction is in the pipeline within 1–3 miles? Heavy new supply typically softens prices + rents 12–24 months out; constrained supply supports both.
Investment metrics
- 1% rule
- 3.48% ✓
- Cap rate
- 31.79%
- Cash-on-cash
- 91.06%
- DSCR
- 5.05
- GRM
- 2.4
CMA / ARV
- ARV (median comp)
- $198,087
- List price
- $49,000
- Delta
- -75.26%
- Verdict
- UNDERPRICED
- Comps
- 11 within 1.0 mi
Projected returns pro-forma
-3.0% appreciation · 3.0% rent growth · sell at horizon
- IRR
- 91.8%
- Equity multiple
- 5.25×
- Total profit
- $58,376
- Equity at exit
- $7,306
- IRR
- 94.6%
- Equity multiple
- 10.93×
- Total profit
- $136,242
- Equity at exit
- $4,237
Cash invested: $13,720 (down + closing). Projections, not guarantees.
Landlord ↔ Tenant lean methodology
- Overall (STATE)
- 90 Strongly Landlord-Friendly
- State Georgia
- 90 Strongly Landlord-Friendly · R+3
- County
- — inherits STATE
- City
- — inherits STATE
ZIP-level market 30153
- Home prices YoY
- -4.6%
- Active inventory
- 198
- Price-to-rent
- 2.4×
Monthly cashflow live
- Estimated rent
- $1,706 medium interval (Pro) →
- Mortgage (P&I)
- −$257
- Tax from tax record
- −$29 /mo · $354/yr
- Insurance
- −$20
- HOA
- −$0
- Vacancy / Maint / Mgmt
- −$358
- Net cashflow
- $1,041
Break-even live
Sensitivity live
| Price | -10% $1,069 | -5% $1,055 | +0% $1,041 | +5% $1,027 | +10% $1,013 |
|---|---|---|---|---|---|
| Rent | -10% $906 | -5% $974 | +0% $1,041 | +5% $1,109 | +10% $1,176 |
| Rate | -1.0pp $1,066 | -0.5pp $1,054 | base $1,041 | +0.5pp $1,028 | +1.0pp $1,016 |
UW: 25.0% down · 7.5% · 30yr · 1.5% tax · 5.0% vac · 8.0% maint · 8.0% mgmt
Financing live
Cash to close
- Down payment
- $12,250
- Closing costs
- $1,470
- Reserves months
- —
- Total cash needed
- —
Loan-product check · same deal, 3 products live
Conventional
25% down · 7.5% · 30yr
- Down + closing
- —
- Monthly P&I
- —
- Monthly cashflow
- —
- DSCR
- —
- Eligible?
- —
Personal DTI + credit; lowest rate.
DSCR
20% down · 8.5% · 30yr
- Down + closing
- —
- Monthly P&I
- —
- Monthly cashflow
- —
- DSCR
- —
- Eligible?
- —
No personal income docs; deal must DSCR.
Hard money
10% down · 12.0% · 12mo
- Down + closing
- —
- Monthly P&I
- —
- Monthly cashflow
- —
- DSCR
- —
- Eligible?
- —
Short-term bridge; refi at stabilization.
Listing history 14 events
-
2026-06-18days on market $49,000 Active 38 DOM
-
2026-06-17days on market $49,000 Active 37 DOM
-
2026-06-16days on market $49,000 Active 36 DOM
-
2026-06-15statusdays on market $49,000 Active 35 DOM
-
2026-06-13pricestatusdays on market $49,000 Price Change 33 DOM
-
2026-06-09days on market $69,000 Active 29 DOM
-
2026-06-08days on market $69,000 Active 28 DOM
-
2026-06-07days on market $69,000 Active 27 DOM
-
2026-06-04days on market $69,000 Active 24 DOM
-
2026-06-03days on market $69,000 Active 23 DOM
-
2026-06-02days on market $69,000 Active 22 DOM
-
2026-06-01days on market $69,000 Active 21 DOM
-
2026-05-31days on market $69,000 Active 20 DOM
-
2026-05-11$69,000 New 425-char remark
ⓘ Source: listings_history table (triggers on properties + properties_extension) + one-shot
backfill from property_details.listing_events for pre-trigger history.
Tax reassessment forecast GA · Resets to sale price
- Current annual tax
- $354 · $29/mo
- Projected year-2 tax
- $451 · $38/mo
- Expected delta
- +$97/yr (+$8/mo · 27.4%)
ⓘ Screening estimate from a state-policy table — verify with the county assessor before closing.
Climate risk First Street
- Flood 1/10 Low FEMA zone X (unshaded) · 0% chance over 30 yrs
- Wildfire 7/10 Severe
- Heat 5/10 Major 7 d/yr ≥105°F today · 19 d/yr by 30 yrs out
- Wind 4/10 Moderate 18% chance of damaging wind over 30 yrs
- Air quality 3/10 Moderate 2 unhealthy d/yr today · 3 by 30 yrs out
Nearby sold comps map
Loading sold comps map…
Walkable amenities ~0.75 mi
Loading nearby amenities…
Taxation est. · year 1
- Rental income
- $20,476
- − Mortgage interest
- −$2,745
- − Property taxes
- −$354
- − Insurance
- −$245
- − Repairs & maintenance
- −$1,638
- − Management
- −$1,638
- − Depreciation
- −$1,425
- Taxable income
- $12,431
- Est. tax owed @ 24.0%
- −$2,983
- After-tax cash flow
- $9,510/yr
For passive investors: Depreciation is non-cash, so a rental often shows a tax loss while cash-flowing — sheltering income. Rental losses are passive: they offset passive income freely, and up to $25,000/yr can offset ordinary (W-2) income if you actively participate and your MAGI is under $100k (phasing out to $0 by $150k); unused losses carry forward. On sale, claimed depreciation is recaptured at up to 25%, and gains may owe capital-gains tax (a 1031 exchange can defer both). Figures are a year-1 estimate at your 24.0% rate — not tax advice; consult a CPA.
Schools (NCES district)
- District
- Polk County
- NCES district ID
- 1304200
- Math proficiency
- 21% ▼ -15.00%
- Reading proficiency
- 28% ▼ -3.00%
- Median HH income
- $39,318
- Composite
- 20.6/100
- National rank
- #8550
- State rank
- #128 of 174 in GA
Livability — Cedartown
- Score
- 64/100
- State rank
- #253
- US rank
- #14084
Category grades
Schools grade is shown separately in the Schools card above.
Census & demographics
- County
- Polk County · 18,467 people
- City population
- 24,071
- Metro
- Cedartown, GA
- Population (ZIP)
- 18,467
- Household income
- $57,377
- Rent vs Own
- Severe rent burden
- 340.0
Population outlook (Polk County) Hauer SSP2
- Today (2025)
- 40,729 people
- By 2030
- 40,103 · -1.5%
- By 2040
- 38,594 · -5.2%
- By 2050
- 36,753 · -9.8%
- By 2075
- 31,687 · -22.2%
- By 2100
- 25,448 · -37.5%
Race, ethnicity, and origin ACS 2023
- Neighborhood character
- Predominantly White (81%)
- Race & ethnicity
- White 81% Black 10% Hispanic / Latino 6% Two or more races 4% Asian 1%
- Hispanic origin (detail)
- Mexican 4% Puerto Rican 2%
- Common ancestry
- Italian 2% Slovak 1% Romanian 1%
- Foreign-born
- 3% · Canada, China
- Languages at home
- 95% English-only · Spanish 2% Other Indo-European 1% German/W. Germanic 1%
Political lean MEDSL · Polk
- 2024 margin
- Solid R (+60.5) · D 19.6% · R 80.1%
- 2008→2024 swing
- -19.4pp toward R · 2008: -41.1pp · 2024: -60.5pp
- All cycles
- 2024: R+60.5 2020: R+57.1 2016: R+57.5 2012: R+45.6 2008: R+41.1
Not yet ingested
- Civics
- —
Market trends
- HPI YoY
- ▼ -18.01%
- Current HPI
- 370.1814
- Rent YoY
- —
- Metro
- Cedartown, GA
- State GDP YoY
- ▲ 2.66%
- F500 in state
- 28
Industry mix (Fortune 500 HQ in GA)
| Industry | F500 HQs | Revenue |
|---|---|---|
| Paper / Packaging | 2 | $29B |
|
||
| Retail | 1 | $160B |
|
||
| Transportation / Logistics | 1 | $91B |
|
||
| Airlines | 1 | $62B |
|
||
| Consumer Goods | 1 | $47B |
|
||
| Utilities | 1 | $25B |
|
||
Price history
-29.0% since first listed2 events — show timeline
- 2026-06-11 Price Changed $49,000 GAMLS
- 2026-05-11 Listed $69,000 GAMLS
Property tax history
+0.5%/yrLatest (2025): $354 · +4.1% YoY. Source: county tax records.
Cash-flow waterfall
monthlySold comps — $/sqft
last 12 mo · ≤1 miLoading sold comps…