952 Armistead Way · Baltimore, MD
Flood risk 1/10 · Minimal
- FEMA flood zone
- X (unshaded)
- Chance of flooding over 30 yrs
- 0.0%
- Est. flood insurance / yr
- $473 – $860
Fire risk 1/10 · Minimal
- Est. fire insurance / yr
- $755 – $1,403
Heat risk 8/10 · Major
- Hot days now (above 103°F)
- 7 days/yr
- Hot days in 30 yrs
- 15 days/yr
Wind risk 6/10 · Moderate
- Chance of severe wind over 30 yrs
- 27.0%
Air-quality risk 4/10 · Minor
- Unhealthy air days now
- 6 days/yr
- Unhealthy air days in 30 yrs
- 7 days/yr
Risk factors via First Street. Map © Google.
Why this score? — see what drove the B- grade
The composite is a weighted blend of 9 inputs, each scored 0–100. Each bar is that input's sub-score; the figure is the points it added to the 100-point composite (weight × sub-score).
- Cash flow +30.0/30.0
- 1% rule +10.0/10.0
- DSCR +10.0/10.0
- ARV discount +7.5/15.0
- Rent growth +5.0/5.0
- Livability +3.8/5.0
- Condition / age +2.2/5.0
- Schools +1.0/10.0
- Appreciation +0.0/10.0
$59,000
🖨 Deal sheet (PDF) 📄 Offer letter ✓ Due diligence
Listing remarks
Welcome to 952 Armistead Way, located in the Armistead Gardens community! This home offers 3 bedrooms and 1 full bathroom, providing plenty of space and potential for its next owner. The main level features a functional layout with a bright living area and a kitchen ready for your personal touch. Upstairs, you’ll find three comfortable bedrooms and a full bath. Whether you’re a first-time buyer or looking for a property to customize, this home presents a great opportunity. Step outside to enjoy the yard space, perfect for relaxing or entertaining. This home is being sold as-is, offering a great chance to add your own updates and build equity. Please note: Buyer must be approved
Key facts
- Bright living area
- Yard space
- $530 HOA
Tags
Property features AI
Finance
- HOA & community: Co-op fee of $530 monthly (covers other items)
Exterior
- Parking: On-street parking
- Utilities: Public water; Public sewer; Natural gas heating and hot water
- Home design: Interior townhouse/rowhouse; Ownership: Cooperative; Year built: estimated
- Construction: Block construction; Block foundation; Above-grade structure
- Exterior features: Tidal water not present; Located within city limits
Interior
- Bedrooms: Three bedrooms on the main level
- Bathrooms: One full bathroom on the main level; One full bathroom total
- Heating & cooling: Forced air heating; Natural gas hot water
- Interior features: Estimated living area; No basement
Neighborhood map
What this means for you Summary
Snapshot
- This is a 3-bed/1.0-bath townhouse listed at $59k. Condition is rated fair.
Deal economics
- At list price, monthly cash flow is $523 ($6k/yr) — positive.
- The deal already cash-flows at list — no discount required.
- Meets the 1% rule at list price ($2k rent vs $59k).
- Recommended offer: $57k (3.0% below list) — sets the bar for market timing.
- Cap rate 16.9% vs local median 6.0% in Baltimore — top-decile yield for the area; either an underpriced asset or a hidden risk that comps aren't pricing in. Stress-test before assuming the spread holds.
Location & tenants
- Location reads 76/100 on livability (#90 in MD, #3,396 nationally) — a middle-class / working-renter tenant base. Strengths: amenities A+, commute A+, housing A+; Watch: schools D, crime F.
- Baltimore City Public Schools (urban): math 7% / reading 16% proficiency, ranked #24 of 24 in MD (top 100%) — low school quality limits family demand, transient renter base, plan for 1-2y turnover; 79% free/reduced lunch — lower-income household profile, screen leases tightly.
- Market conditions: Rents rising fast (+9.9%/yr); 145 active listings in the ZIP; 27 comparable units currently listed for rent nearby; rentals at typical pace (median 25d on market — plan ~3-4 weeks tenant-placement turnaround); lower-income renter base — watch delinquency; 1,273 units permitted in Baltimore city in 2024 (1,104 in 5+ unit buildings).
- At $1,849/mo this rent would consume 51% of the median local household income ($43k/yr) (locally 966% of renters already pay >50% of income on rent) — very limited rent-growth headroom before tenants either downsize or default.
Forward outlook
- Local home prices are declining (-3.0%/yr); year-one equity from $408 of loan paydown is wiped out by about $2k of value loss. Plan a longer hold.
- Baltimore County population projected to shrink 4% by 2050 — rents likely to lag national; underwrite the cash flow, not the appreciation.
- At projected returns (-3.0% appreciation + 8.0% rent growth), your $17k cash investment doubles in ~3 years — after that, you're playing with house money.
Negotiation context
- It's been on market 31 days — a 3% lower offer ($57k) is reasonable based on typical stale-listing flexibility.
Risks & watch-outs
- Watch-outs: HOA is 29% of rent; built in 1945 — expect roof / HVAC / electrical / plumbing capex.
- Climate carrying-cost: major wind risk, 27% chance of damaging wind over 30y; extreme-heat days projected 7→15/yr by 2055 (HVAC capex compounding) — expect insurance premiums to compound above CPI over the hold.
Questions for the listing agent
- It's been on market 31 days. Have you received any prior offers? Is the seller open to a 3% concession, seller financing, or rate buy-down credit?
- Have any recent inspections been done? Can we get a copy of the seller's disclosures and any deferred-maintenance estimates?
- Built in 1945 — when were the roof, HVAC, electrical panel, plumbing, and water heater last replaced?
- What does the HOA fee cover, when was the last increase, and are there any pending special assessments or reserve-fund shortfalls?
- Is there a deadline driving the sale (1031 exchange, divorce, estate, relocation)? That informs how much negotiation room exists.
- Schools are D-rated, which usually means shorter tenancies and higher turnover. Who's the typical renter profile here, and what's been the actual vacancy rate?
- Crime grade is F in this area — have there been break-ins, vandalism, or insurance claims at this property in the last 3 years? What carrier currently insures it and at what premium?
- What's the average days-on-market for RENTAL listings here right now (not sales)? A rising rental-DOM trend means longer vacancies and softer asking-rent achievability than the comps imply.
- What's the recent tenant-quality profile in this submarket — average credit score on applications, eviction rate, late-payment / NSF rate, and stable-employment percentage? A property-management company in the area should have these aggregated.
- How much new for-sale + rental construction is in the pipeline within 1–3 miles? Heavy new supply typically softens prices + rents 12–24 months out; constrained supply supports both.
Investment metrics
- 1% rule
- 3.13% ✓
- Cap rate
- 16.93%
- Cash-on-cash
- 37.99%
- DSCR
- 2.69
- GRM
- 2.7
CMA / ARV
No comps found within radius.
Projected returns pro-forma
-3.0% appreciation · 8.0% rent growth · sell at horizon
- IRR
- 42.8%
- Equity multiple
- 3.05×
- Total profit
- $33,878
- Equity at exit
- $8,797
- IRR
- 52.2%
- Equity multiple
- 8.16×
- Total profit
- $118,309
- Equity at exit
- $5,101
Cash invested: $16,520 (down + closing). Projections, not guarantees.
Landlord ↔ Tenant lean methodology
- Overall (CITY)
- 12 Strongly Tenant-Friendly
- State Maryland
- 27 Tenant-Leaning · D+14
- County
- — inherits STATE
- City Baltimore
- 12 Strongly Tenant-Friendly · D+58
ZIP-level market 21205
- Home prices YoY
- -5.8%
- Rents YoY
- 9.9%
- Active inventory
- 145
- Price-to-rent
- 2.7×
Monthly cashflow live
- Estimated rent
- $1,849 high interval (Pro) →
- Mortgage (P&I)
- −$309
- Tax est. 1.5%
- −$74 /mo · $885/yr
- Insurance
- −$25
- HOA
- −$530
- Vacancy / Maint / Mgmt
- −$388
- Net cashflow
- $523
Break-even live
Sensitivity live
| Price | -10% $564 | -5% $543 | +0% $523 | +5% $503 | +10% $482 |
|---|---|---|---|---|---|
| Rent | -10% $377 | -5% $450 | +0% $523 | +5% $596 | +10% $669 |
| Rate | -1.0pp $553 | -0.5pp $538 | base $523 | +0.5pp $508 | +1.0pp $492 |
UW: 25.0% down · 7.5% · 30yr · 1.5% tax · 5.0% vac · 8.0% maint · 8.0% mgmt
Financing live
Cash to close
- Down payment
- $14,750
- Closing costs
- $1,770
- Reserves months
- —
- Total cash needed
- —
Loan-product check · same deal, 3 products live
Conventional
25% down · 7.5% · 30yr
- Down + closing
- —
- Monthly P&I
- —
- Monthly cashflow
- —
- DSCR
- —
- Eligible?
- —
Personal DTI + credit; lowest rate.
DSCR
20% down · 8.5% · 30yr
- Down + closing
- —
- Monthly P&I
- —
- Monthly cashflow
- —
- DSCR
- —
- Eligible?
- —
No personal income docs; deal must DSCR.
Hard money
10% down · 12.0% · 12mo
- Down + closing
- —
- Monthly P&I
- —
- Monthly cashflow
- —
- DSCR
- —
- Eligible?
- —
Short-term bridge; refi at stabilization.
Rent comps 27 comps
| Address | Beds | Baths | Sqft | Rent | $/sqft | DOM | Units | Dist |
|---|---|---|---|---|---|---|---|---|
| 4300 Orchard Ridge Blvd Baltimore, MD | 1.0–3.0 | 1.0–2.0 | 1021 | $1,809 | $1.77 | 45d | 1 | 0.90mi |
| 6004 Amberwood Rd Baltimore, MD | 2.0 | 1.0 | 751 | $1,220 | $1.62 | 21d | 1 | 0.99mi |
| 363 Gusryan St Baltimore, MD | 2.0 | 2.0 | 840 | $1,950 | $2.32 | 14d | 1 | 1.03mi |
| 442 Folcroft St Unit A Baltimore, MD | 2.0 | 1.5 | 1071 | $1,600 | $1.49 | 5d | 1 | 1.08mi |
| 334 Kane St Baltimore, MD | 2.0 | 2.0 | 1050 | $1,675 | $1.60 | 25d | 1 | 1.08mi |
| 456 Elrino St Unit B Baltimore, MD | 2.0 | 1.0 | 800 | $1,600 | $2.00 | 45d | 1 | 1.09mi |
| 4022 Ardley Ave Baltimore, MD | 2.0 | 1.0 | 896 | $1,750 | $1.95 | 45d | 1 | 1.14mi |
| 560 Bayview Blvd Baltimore, MD | 1.0–3.0 | 1.0–3.0 | 1108 | $3,372 | $3.04 | 3d | 25 | 1.17mi |
| 223 Grundy St Baltimore, MD | 2.0 | 1.0 | 864 | $1,450 | $1.68 | 25d | 1 | 1.22mi |
| 6802 Conley St Baltimore, MD | 2.0 | 1.5 | 939 | $1,750 | $1.86 | 23d | 1 | 1.27mi |
| 7124 Gough St Baltimore, MD | 2.0 | 1.5 | 1096 | $1,700 | $1.55 | 23d | 1 | 1.31mi |
| 7136 Eastbrook Ave Baltimore, MD | 4.0 | 2.0 | 996 | $2,200 | $2.21 | 6d | 1 | 1.32mi |
| 321 Fagley St Baltimore, MD | 2.0 | 1.0 | 800 | $1,650 | $2.06 | 21d | 1 | 1.34mi |
| 5305 Moravia Rd Baltimore, MD | 3.0 | 1.0 | 679 | $1,993 | $2.93 | 3d | 1 | 1.35mi |
| 3413 Leverton Ave Baltimore, MD | 2.0 | 1.0 | 832 | $1,000 | $1.20 | 25d | 1 | 1.35mi |
| 6905 Bank St Baltimore, MD | 2.0 | 1.5 | 784 | $1,650 | $2.10 | 45d | 1 | 1.35mi |
| 3902 Erdman Ave Unit 1 Baltimore, MD | 2.0 | 1.0 | 1000 | $1,275 | $1.27 | 25d | 1 | 1.36mi |
| 4015 Eastern Ave Unit 2L Baltimore, MD | 3.0 | 2.0 | 1100 | $1,800 | $1.64 | 45d | 1 | 1.38mi |
| 3905 Bank St Baltimore, MD | 4.0 | 1.0–3.0 | 909 | $2,820 | $3.10 | 3d | 20 | 1.39mi |
| 1310 N Ellwood Ave #1 Baltimore, MD | 2.0 | 1.0 | 1000 | $1,550 | $1.55 | 23d | 1 | 1.42mi |
| 1310 N Ellwood Ave Baltimore, MD | 2.0 | 1.0 | 1000 | $1,450 | $1.45 | 14d | 1 | 1.42mi |
| 3646 Lyndale Ave Baltimore, MD | 2.0 | 1.5 | 840 | $1,475 | $1.76 | 45d | 1 | 1.42mi |
| 3566 Dudley Ave Baltimore, MD | 2.0 | 1.0 | 896 | $1,800 | $2.01 | 25d | 1 | 1.42mi |
| 3205 Esther Pl Baltimore, MD | 2.0 | 2.0 | 960 | $1,850 | $1.93 | 25d | 1 | 1.43mi |
| 203 N Ellwood Ave Unit Main Baltimore, MD | 2.0 | 2.0 | 880 | $2,200 | $2.50 | 25d | 1 | 1.47mi |
| 520 N Decker Ave Baltimore, MD | 2.0 | 1.0 | 1000 | $1,650 | $1.65 | 45d | 1 | 1.48mi |
| 7319 Conley St Baltimore, MD | 3.0 | 2.0 | 1080 | $1,950 | $1.81 | 19d | 1 | 1.49mi |
HOA detail
- Monthly dues
- $530 · $6,360/yr
Listing history 15 events
-
2026-06-21days on market $59,000 Active 31 DOM
-
2026-06-18days on market $59,000 Active 28 DOM
-
2026-06-17pricedays on market $59,000 Active 27 DOM
-
2026-06-16days on market $65,000 Active 26 DOM
-
2026-06-15days on market $65,000 Active 25 DOM
-
2026-06-13days on market $65,000 Active 23 DOM
-
2026-06-09days on market $65,000 Active 19 DOM
-
2026-06-08days on market $65,000 Active 18 DOM
-
2026-06-07days on market $65,000 Active 17 DOM
-
2026-06-04days on market $65,000 Active 14 DOM
-
2026-06-03days on market $65,000 Active 13 DOM
-
2026-06-02days on market $65,000 Active 12 DOM
-
2026-06-01days on market $65,000 Active 11 DOM
-
2026-05-31days on market $65,000 Active 10 DOM
-
2026-05-12$60,000 Active 904-char remark
ⓘ Source: listings_history table (triggers on properties + properties_extension) + one-shot
backfill from property_details.listing_events for pre-trigger history.
Climate risk First Street
- Flood 1/10 Low FEMA zone X (unshaded) · 0% chance over 30 yrs
- Wildfire 1/10 Low
- Heat 8/10 Severe 7 d/yr ≥103°F today · 15 d/yr by 30 yrs out
- Wind 6/10 Major 27% chance of damaging wind over 30 yrs
- Air quality 4/10 Moderate 6 unhealthy d/yr today · 7 by 30 yrs out
Nearby sold comps map
Loading sold comps map…
Walkable amenities ~0.75 mi
Loading nearby amenities…
Taxation est. · year 1
- Rental income
- $22,189
- − Mortgage interest
- −$3,305
- − Property taxes
- −$885
- − Insurance
- −$295
- − Repairs & maintenance
- −$1,775
- − Management
- −$1,775
- − HOA
- −$6,360
- − Depreciation
- −$1,716
- Taxable income
- $6,078
- Est. tax owed @ 24.0%
- −$1,459
- After-tax cash flow
- $4,818/yr
For passive investors: Depreciation is non-cash, so a rental often shows a tax loss while cash-flowing — sheltering income. Rental losses are passive: they offset passive income freely, and up to $25,000/yr can offset ordinary (W-2) income if you actively participate and your MAGI is under $100k (phasing out to $0 by $150k); unused losses carry forward. On sale, claimed depreciation is recaptured at up to 25%, and gains may owe capital-gains tax (a 1031 exchange can defer both). Figures are a year-1 estimate at your 24.0% rate — not tax advice; consult a CPA.
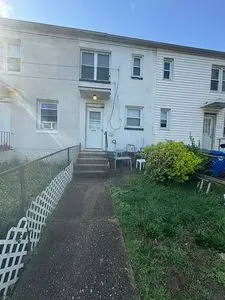
Condition & rehab AI · 1 photo
This townhouse requires moderate renovations, focusing on exterior repairs and landscaping to improve its curb appeal and property value.
Repairs flagged
- Major fence — Severe overgrowth and damage
- Major concrete path — Significant wear and tear
Value-add opportunities
- Both landscaping — Improves curb appeal and property value
- Both fence repair — Enhances safety and property value
- Both concrete path repair — Enhances property value and usability
Renovation cost estimate screening
| Repair item | Severity | Est. cost |
|---|---|---|
| fence · Severe overgrowth and damage | Major | $15,000–50,000 |
| concrete path · Significant wear and tear | Major | $15,000–50,000 |
| Total estimated repair cost · 2 items | $30,000–100,000 |
Value-add ROI direction
- Both landscaping — Improves curb appeal and property value ↑
- Both fence repair — Enhances safety and property value ↑
- Both concrete path repair — Enhances property value and usability ↑
ⓘ Cost ranges are severity-bucket heuristics (US national rule-of-thumb). Get contractor quotes + a written scope before underwriting a rehab budget.
Schools (NCES district)
- District
- Baltimore City Public Schools
- NCES district ID
- 2400090
- Math proficiency
- 7% ▼ -9.00%
- Reading proficiency
- 16% ▼ -5.00%
- Median HH income
- $42,108
- Composite
- 10.08/100
- National rank
- #9805
- State rank
- #24 of 24 in MD
Livability — Baltimore
- Score
- 76/100
- State rank
- #90
- US rank
- #3396
Category grades
Schools grade is shown separately in the Schools card above.
Census & demographics
- Census place
- Baltimore, MD
- County
- Baltimore City · 558,601 people
- City population
- 588,727
- Metro
- Baltimore-Columbia-Towson, MD
- Population (ZIP)
- 13,013
- Household income
- $43,176
- Rent vs Own
- Severe rent burden
- 966.0
Population outlook (Baltimore County) Hauer SSP2
- Today (2025)
- 624,249 people
- By 2030
- 621,541 · -0.4%
- By 2040
- 609,756 · -2.3%
- By 2050
- 597,249 · -4.3%
- By 2075
- 552,236 · -11.5%
- By 2100
- 513,934 · -17.7%
Race, ethnicity, and origin ACS 2023
- Neighborhood character
- Diverse neighborhood (Simpson 0.60)
- Race & ethnicity
- Black 60% Hispanic / Latino 16% White 14% Two or more races 11% Asian 3%
- Hispanic origin (detail)
- Mexican 1% Cuban 1% Dominican 4%
- Common ancestry
- Slovak 3% Romanian 1%
- Foreign-born
- 16% · Canada, China
- Languages at home
- 79% English-only · Spanish 11% Arabic 4% Chinese 1%
Political lean MEDSL · Baltimore
- 2024 margin
- Solid D (+73.0) · D 85.2% · R 12.2% · Other 2.6%
- 2008→2024 swing
- -2.5pp toward R · 2008: 75.5pp · 2024: 73.0pp
- All cycles
- 2024: D+73.0 2020: D+76.6 2016: D+74.6 2012: D+76.4 2008: D+75.5
Not yet ingested
- Civics
- —
Market trends
- HPI YoY
- ▼ -15.03%
- Current HPI
- 244.1345
- Rent YoY
- ▲ 9.88%
- Metro
- Baltimore-Columbia-Towson, MD
- State GDP YoY
- ▲ 2.97%
- F500 in state
- 12
Industry mix (Fortune 500 HQ in MD)
| Industry | F500 HQs | Revenue |
|---|---|---|
| Aerospace / Defense | 1 | $71B |
|
||
| Utilities | 1 | $25B |
|
||
| Hotels | 1 | $24B |
|
||
| Consumer Goods | 1 | $7B |
|
||
| Real Estate | 1 | $6B |
|
||
| Chemicals | 1 | $2B |
|
||
Price history
-9.2% since first listed2 events — show timeline
- 2026-06-16 Price Changed $59,000 BRIGHT MLS
- 2026-05-21 Listed $65,000 BRIGHT MLS
Cash-flow waterfall
monthlySold comps — $/sqft
last 12 mo · ≤1 miLoading sold comps…