155 2nd Ave · Peconic, NY
Flood risk 9/10 · Severe
- FEMA flood zone
- AE
- Chance of flooding over 30 yrs
- 0.99%
- Est. flood insurance / yr
- $2,026 – $9,024
Fire risk 2/10 · Minimal
- Est. fire insurance / yr
- $691 – $1,283
Heat risk 5/10 · Moderate
- Hot days now (above 90°F)
- 7 days/yr
- Hot days in 30 yrs
- 18 days/yr
Wind risk 8/10 · Major
- Chance of severe wind over 30 yrs
- 80.0%
Air-quality risk 3/10 · Minor
- Unhealthy air days now
- 2 days/yr
- Unhealthy air days in 30 yrs
- 3 days/yr
Risk factors via First Street. Map © Google.
Why this score? — see what drove the B+ grade
The composite is a weighted blend of 9 inputs, each scored 0–100. Each bar is that input's sub-score; the figure is the points it added to the 100-point composite (weight × sub-score).
- Cash flow +29.6/30.0
- ARV discount +10.4/15.0
- DSCR +10.0/10.0
- 1% rule +7.6/10.0
- Appreciation +5.7/10.0
- Schools +4.8/10.0
- Livability +2.7/5.0
- Rent growth +2.5/5.0
- Condition / age +2.5/5.0
$949,000
🖨 Deal sheet (PDF) 📄 Offer letter ✓ Due diligence
Listing remarks MLS
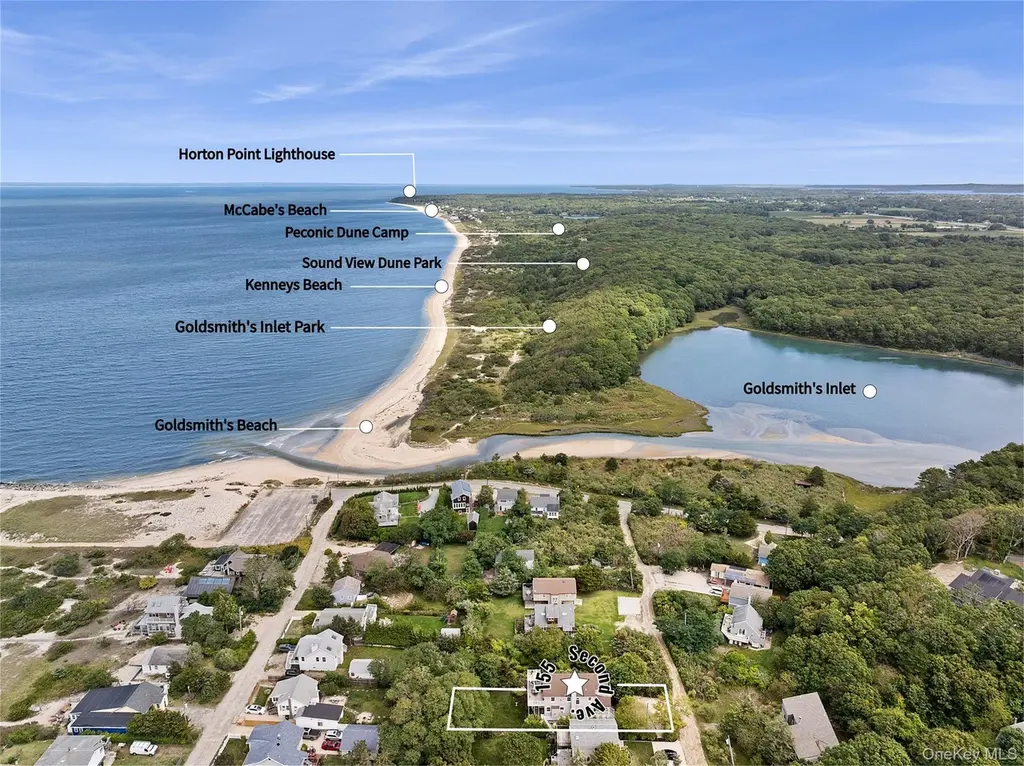
North Fork Coastal Living by the Sound. Located in Peconic near Goldsmith Inlet and the Long Island Sound, this house was personally built by the owner, an experienced home builder, with a focus on superior materials, meticulous construction and pride of ownership. An open living, dining, and kitchen areas extend to a balcony that showcases beautiful sunsets and water views, creating a seamless indoor-outdoor experience. Currently unfurnished and ready for your own personal touch! Nearby beach is a stones throw from the house, and Goldsmith’s inlet provide opportunities for kayaking, paddle boarding, swimming and fishing while vineyards, farm-to-table restaurants, and local landmarks such as Horton Point Lighthouse are just minutes away. With endless outdoor recreation and breathtaking evening skies, this property captures the best of North Fork living.
Key facts
- Goldsmith inlet
- Outdoor recreation
- Nearby beach
Tags
Neighborhood map
What this means for you Summary
Snapshot
- This is a 3-bed/1.5-bath single-family listed at $949k.
Deal economics
- At list price, monthly cash flow is $3k ($35k/yr) — positive.
- The deal already cash-flows at list — no discount required.
- Meets the 1% rule at list price ($12k rent vs $949k).
- Recommended offer: $892k (6.0% below list) — sets the bar for market timing.
Location & tenants
- Location reads 54/100 on livability (#1,144 in NY) — a working-class tenant base; expect higher turnover. Strengths: crime A+, employment A+; Watch: amenities F, commute F, cost of living F.
- Southold Union Free School District (town): math 46% / reading 59% proficiency, ranked #298 of 590 in NY (top 50%) — acceptable for families but not a draw, mixed tenant base, ~2y average lease; only 17% free/reduced lunch — higher-income household profile.
- Zoned schools: Southold Elementary School (math 37% / reading 62%, grade D, #1,085 of 2,108 statewide, top 56%, 317 students, 35% FRL); Southold Junior-Senior High School (math 52% / reading 52%, grade D+, #946 of 1,100 statewide, top 88%, 380 students, 40% FRL) — zoned schools average 38% FRL vs 17% district-wide (21 pts higher); higher-poverty schools than district average — tighter screening recommended.
- Market conditions: 7 active listings in the ZIP; 3 comparable units currently listed for rent nearby; rentals lingering (median 46d on market — plan ~5-8 weeks vacancy on turnover, expect pricing pressure); 100% of comp listings sitting > 30 days — soft ceiling on asking rent; 1,366 units permitted in Suffolk County in 2024 (216 in 5+ unit buildings).
Forward outlook
- In year one you build about $21k of equity ($7k loan paydown + $14k appreciation (1.5% local appreciation)).
- Suffolk County population projected to shrink 5% by 2050 — rents likely to lag national; underwrite the cash flow, not the appreciation.
- At projected returns (1.5% appreciation + 3.0% rent growth), your $266k cash investment doubles in ~5 years — after that, you're playing with house money.
- By year 3, paydown + projected appreciation supports a ~$54k cash-out refi (75% LTV) — recoverable capital for the next deal without selling this one.
Negotiation context
- It's been on market 90 days — a 6% lower offer ($892k) is reasonable based on typical stale-listing flexibility.
- 2 sale attempts; this cycle's ask has dropped $50k (5%) from the opening price — seller is motivated, your offer sets the floor, not the list.
- Current owner paid $85k; list at $949k implies a 1016% gain — meaningful room to come down on a strong offer.
Risks & watch-outs
- Watch-outs: flood insurance adds $460/mo.
- Climate carrying-cost: in FEMA flood zone AE (mandatory federal flood insurance); severe wind risk, 80% chance of damaging wind over 30y; extreme-heat days projected 7→18/yr by 2055 (HVAC capex compounding) — expect insurance premiums to compound above CPI over the hold.
Questions for the listing agent
- It's been on market 90 days. Have you received any prior offers? Is the seller open to a 6% concession, seller financing, or rate buy-down credit?
- What's the actual annual flood-insurance premium (NFIP or private), and is the property in a SFHA with mandatory coverage?
- Why hasn't it sold? Are there any deal-killer items the seller is aware of (foundation, flood, title, zoning, code violations)?
- Is there a deadline driving the sale (1031 exchange, divorce, estate, relocation)? That informs how much negotiation room exists.
- Schools are F-rated, which usually means shorter tenancies and higher turnover. Who's the typical renter profile here, and what's been the actual vacancy rate?
- What's the average days-on-market for RENTAL listings here right now (not sales)? A rising rental-DOM trend means longer vacancies and softer asking-rent achievability than the comps imply.
- What's the recent tenant-quality profile in this submarket — average credit score on applications, eviction rate, late-payment / NSF rate, and stable-employment percentage? A property-management company in the area should have these aggregated.
- How much new for-sale + rental construction is in the pipeline within 1–3 miles? Heavy new supply typically softens prices + rents 12–24 months out; constrained supply supports both.
Investment metrics
- 1% rule
- 1.26% ✓
- Cap rate
- 10.61%
- Cash-on-cash
- 15.43%
- DSCR
- 1.69
- GRM
- 6.6
CMA / ARV
- ARV (median comp)
- $1,013,941
- List price
- $949,000
- Delta
- -6.40%
- Verdict
- FAIR
- Comps
- 2 within 1.0 mi
Projected returns pro-forma
1.5% appreciation · 3.0% rent growth · sell at horizon
- IRR
- 16.5%
- Equity multiple
- 1.86×
- Total profit
- $229,474
- Equity at exit
- $348,707
- IRR
- 19.3%
- Equity multiple
- 3.45×
- Total profit
- $650,336
- Equity at exit
- $483,167
Cash invested: $265,720 (down + closing). Projections, not guarantees.
Landlord ↔ Tenant lean methodology
- Overall (STATE)
- 15 Strongly Tenant-Friendly
- State New York
- 15 Strongly Tenant-Friendly · D+10
- County
- — inherits STATE
- City
- — inherits STATE
ZIP-level market 11958
- Home prices YoY
- 0.7%
- Active inventory
- 7
- Price-to-rent
- 6.6×
Monthly cashflow live
- Estimated rent
- $11,954 medium interval (Pro) →
- Mortgage (P&I)
- −$4,977
- Tax from tax record
- −$654 /mo · $7,852/yr
- Insurance
- −$395
- Flood insurance flood zone
- −$460 /mo · $5,525/yr
- HOA
- −$0
- Vacancy / Maint / Mgmt
- −$2,510
- Net cashflow
- $2,957
Break-even live
Sensitivity live
| Price | -10% $3,494 | -5% $3,226 | +0% $2,957 | +5% $2,689 | +10% $2,420 |
|---|---|---|---|---|---|
| Rent | -10% $2,013 | -5% $2,485 | +0% $2,957 | +5% $3,429 | +10% $3,902 |
| Rate | -1.0pp $3,435 | -0.5pp $3,198 | base $2,957 | +0.5pp $2,711 | +1.0pp $2,461 |
UW: 25.0% down · 7.5% · 30yr · 1.5% tax · 5.0% vac · 8.0% maint · 8.0% mgmt
Financing live
Cash to close
- Down payment
- $237,250
- Closing costs
- $28,470
- Reserves months
- —
- Total cash needed
- —
Loan-product check · same deal, 3 products live
Conventional
25% down · 7.5% · 30yr
- Down + closing
- —
- Monthly P&I
- —
- Monthly cashflow
- —
- DSCR
- —
- Eligible?
- —
Personal DTI + credit; lowest rate.
DSCR
20% down · 8.5% · 30yr
- Down + closing
- —
- Monthly P&I
- —
- Monthly cashflow
- —
- DSCR
- —
- Eligible?
- —
No personal income docs; deal must DSCR.
Hard money
10% down · 12.0% · 12mo
- Down + closing
- —
- Monthly P&I
- —
- Monthly cashflow
- —
- DSCR
- —
- Eligible?
- —
Short-term bridge; refi at stabilization.
Rent comps 3 comps
| Address | Beds | Baths | Sqft | Rent | $/sqft | DOM | Units | Dist |
|---|---|---|---|---|---|---|---|---|
| 1100 Huntington Blvd Peconic, NY | 3.0 | 3.0 | 1600 | $12,000 | $7.50 | 46d | 1 | 0.06mi |
| 1685 Peconic Ln Peconic, NY | 3.0 | 3.0 | 3100 | $18,000 | $5.81 | 46d | 1 | 0.98mi |
| 6710 Soundview Ave Southold, NY | 4.0 | 2.0 | 2000 | $4,900 | $2.45 | 46d | 1 | 1.20mi |
Listing history 21 events
-
2026-06-22days on market $949,000 Active 90 DOM
-
2026-06-21days on market $949,000 Active 89 DOM
-
2026-06-21days on market $949,000 Active 88 DOM
-
2026-06-18days on market $949,000 Active 86 DOM
-
2026-06-17days on market $949,000 Active 85 DOM
-
2026-06-16days on market $949,000 Active 84 DOM
-
2026-06-15days on market $949,000 Active 83 DOM
-
2026-06-13days on market $949,000 Active 81 DOM
-
2026-06-12days on market $949,000 Active 80 DOM
-
2026-06-09days on market $949,000 Active 77 DOM
-
2026-06-08days on market $949,000 Active 76 DOM
-
2026-06-07days on market $949,000 Active 75 DOM
-
2026-06-07pricedays on market $949,000 Active 74 DOM
-
2026-06-04days on market $999,000 Active 71 DOM
-
2026-06-02days on market $999,000 Active 70 DOM
-
2026-06-01days on market $999,000 Active 69 DOM
-
2026-05-31days on market $999,000 Active 68 DOM
-
2026-03-23$999,000 Active 874-char remark
Show marketing remark (874 chars)
North Fork Coastal Living by the Sound. Located in Peconic near Goldsmith Inlet and the Long Island Sound, this house was personally built by the owner, an experienced home builder, with a focus on superior materials, meticulous construction and pride of ownership. An open living, dining, and kitchen areas extend to a balcony that showcases beautiful sunsets and water views, creating a seamless indoor-outdoor experience. Currently unfurnished and ready for your own personal touch! Nearby beach is a stones throw from the house, and Goldsmith’s inlet provide opportunities for kayaking, paddle boarding, swimming and fishing while vineyards, farm-to-table restaurants, and local landmarks such as Horton Point Lighthouse are just minutes away. With endless outdoor recreation and breathtaking evening skies, this property captures the best of North Fork living.
-
2025-09-22$1,195,000 Active
-
1989-02-01soldstatus $85,000
-
1988-03-08soldstatus $60,000
ⓘ Source: listings_history table (triggers on properties + properties_extension) + one-shot
backfill from property_details.listing_events for pre-trigger history.
Tax reassessment forecast NY · Partial reset (capped growth)
- Current annual tax
- $7,852 · $654/mo
- Projected year-2 tax
- $11,945 · $995/mo
- Expected delta
- +$4,093/yr (+$341/mo · 52.1%)
ⓘ Screening estimate from a state-policy table — verify with the county assessor before closing.
Climate risk First Street
- Flood 9/10 Extreme FEMA zone AE · 99% chance over 30 yrs
- Wildfire 2/10 Low
- Heat 5/10 Major 7 d/yr ≥90°F today · 18 d/yr by 30 yrs out
- Wind 8/10 Severe 80% chance of damaging wind over 30 yrs
- Air quality 3/10 Moderate 2 unhealthy d/yr today · 3 by 30 yrs out
Nearby sold comps map
Loading sold comps map…
Walkable amenities ~0.75 mi
Loading nearby amenities…
Taxation est. · year 1
- Rental income
- $143,453
- − Mortgage interest
- −$53,159
- − Property taxes
- −$7,852
- − Insurance
- −$10,270
- − Repairs & maintenance
- −$11,476
- − Management
- −$11,476
- − Depreciation
- −$27,607
- Taxable income
- $21,612
- Est. tax owed @ 24.0%
- −$5,187
- After-tax cash flow
- $30,299/yr
For passive investors: Depreciation is non-cash, so a rental often shows a tax loss while cash-flowing — sheltering income. Rental losses are passive: they offset passive income freely, and up to $25,000/yr can offset ordinary (W-2) income if you actively participate and your MAGI is under $100k (phasing out to $0 by $150k); unused losses carry forward. On sale, claimed depreciation is recaptured at up to 25%, and gains may owe capital-gains tax (a 1031 exchange can defer both). Figures are a year-1 estimate at your 24.0% rate — not tax advice; consult a CPA.
Schools (NCES district)
- District
- Southold Union Free School District
- NCES district ID
- 3627620
- Math proficiency
- 46% ▼ -10.00%
- Reading proficiency
- 59% ▲ 6.00%
- Median HH income
- $78,622
- Composite
- 47.54/100
- National rank
- #2269
- State rank
- #298 of 590 in NY
Livability — Peconic
- Score
- 54/100
- State rank
- #1144
- US rank
- #23856
Category grades
Schools grade is shown separately in the Schools card above.
Census & demographics
- Census place
- Peconic, NY
- City population
- 864
- Population (ZIP)
- 864
Population outlook (Suffolk County) Hauer SSP2
- Today (2025)
- 1,505,262 people
- By 2030
- 1,498,318 · -0.5%
- By 2040
- 1,471,101 · -2.3%
- By 2050
- 1,424,848 · -5.3%
- By 2075
- 1,337,157 · -11.2%
- By 2100
- 1,217,720 · -19.1%
Race, ethnicity, and origin ACS 2023
- Neighborhood character
- Predominantly White (78%)
- Race & ethnicity
- White 78% Hispanic / Latino 22% Two or more races 10%
- Hispanic origin (detail)
- Common ancestry
- Romanian 28% Iranian 1% Lithuanian 1%
- Foreign-born
- 21% · Canada
- Languages at home
- 80% English-only · Spanish 20%
Political lean MEDSL · Suffolk
- 2024 margin
- Lean R (+10.0) · D 45.0% · R 55.0%
- 2008→2024 swing
- -16.0pp toward R · 2008: 6.0pp · 2024: -10.0pp
- All cycles
- 2024: R+10.0 2020: R+0.0 2016: R+8.2 2012: D+2.9 2008: D+6.0
Not yet ingested
- Civics
- —
Market trends
- HPI YoY
- ▲ 1.50%
- Current HPI
- 219.0019
- Rent YoY
- —
- Metro
- —
- State GDP YoY
- ▲ 2.60%
- F500 in state
- 92
Industry mix (Fortune 500 HQ in NY)
| Industry | F500 HQs | Revenue |
|---|---|---|
| Financial Services | 10 | $950B |
|
||
| Consumer Goods | 9 | $162B |
|
||
| Insurance | 4 | $225B |
|
||
| Telecommunications | 2 | $144B |
|
||
| Pharmaceuticals | 2 | $112B |
|
||
| Media / Entertainment | 2 | $69B |
|
||
Price history
+1565.0% since first listed4 events — show timeline
- 2026-03-23 Listed $999,000 OneKey® MLS as Distributed by MLS Grid
- 2025-09-22 Listed $1,195,000 OneKey® MLS as Distributed by MLS Grid
- 1989-02-01 Sold (Public Records) $85,000 Public Records
- 1988-03-08 Sold (Public Records) $60,000 Public Records
Property tax history
+1.6%/yrLatest (2025): $7,852 · +0.0% YoY. Source: county tax records.
Cash-flow waterfall
monthlySold comps — $/sqft
last 12 mo · ≤1 miLoading sold comps…